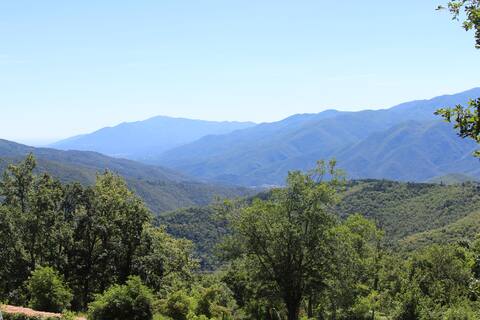
Corsavy Airbnb Market Analysis 2025: Short Term Rental Data & Vacation Rental Statistics in Occitania, France
Is Airbnb profitable in Corsavy in 2025? Explore comprehensive Airbnb analytics for Corsavy, Occitania, France to uncover income potential. This 2025 STR market report for Corsavy, based on AirROI data from April 2024 to March 2025, reveals key trends in the niche market of 18 active listings.
Whether you're considering an Airbnb investment in Corsavy, optimizing your existing vacation rental, or exploring rental arbitrage opportunities, understanding the Corsavy Airbnb data is crucial. Leveraging the low regulation environment is key to maximizing your short term rental income potential. Let's dive into the specifics.
Key Corsavy Airbnb Performance Metrics Overview
Monthly Airbnb Revenue Variations & Income Potential in Corsavy (2025)
Understanding the monthly revenue variations for Airbnb listings in Corsavy is key to maximizing your short term rental income potential. Seasonality significantly impacts earnings. Our analysis, based on data from the past 12 months, shows that the peak revenue month for STRs in Corsavy is typically August, while January often presents the lowest earnings, highlighting opportunities for strategic pricing adjustments during shoulder and low seasons. Explore the typical Airbnb income in Corsavy across different performance tiers:
- Best-in-class properties (Top 10%) achieve $2,491+ monthly, often utilizing dynamic pricing and superior guest experiences.
- Strong performing properties (Top 25%) earn $1,792 or more, indicating effective management and desirable locations/amenities.
- Typical properties (Median) generate around $1,130 per month, representing the average market performance.
- Entry-level properties (Bottom 25%) see earnings around $573, often with potential for optimization.
Average Monthly Airbnb Earnings Trend in Corsavy
Corsavy Airbnb Occupancy Rate Trends (2025)
Maximize your bookings by understanding the Corsavy STR occupancy trends. Seasonal demand shifts significantly influence how often properties are booked. Typically, Augustsees the highest demand (peak season occupancy), while January experiences the lowest (low season). Effective strategies, like adjusting minimum stays or offering promotions, can boost occupancy during slower periods. Here's how different property tiers perform in Corsavy:
- Best-in-class properties (Top 10%) achieve 62%+ occupancy, indicating high desirability and potentially optimized availability.
- Strong performing properties (Top 25%) maintain 45% or higher occupancy, suggesting good market fit and guest satisfaction.
- Typical properties (Median) have an occupancy rate around 26%.
- Entry-level properties (Bottom 25%) average 13% occupancy, potentially facing higher vacancy.
Average Monthly Occupancy Rate Trend in Corsavy
Average Daily Rate (ADR) Airbnb Trends in Corsavy (2025)
Effective short term rental pricing strategy in Corsavy involves understanding monthly ADR fluctuations. The Average Daily Rate (ADR) for Airbnb in Corsavy typically peaks in July and dips lowest during March. Leveraging Airbnb dynamic pricing tools or strategies based on this seasonality can significantly boost revenue. Here's a look at the typical nightly rates achieved:
- Best-in-class properties (Top 10%) command rates of $265+ per night, often due to premium features or locations.
- Strong performing properties (Top 25%) achieve nightly rates of $194 or more.
- Typical properties (Median) charge around $136 per night.
- Entry-level properties (Bottom 25%) earn around $89 per night.
Average Daily Rate (ADR) Trend by Month in Corsavy
Get Live Corsavy Market Intelligence 👇

Explore Real-time Analytics
Airbnb Seasonality Analysis & Trends in Corsavy (2025)
Peak Season (August, July, October)
- Revenue averages $2,034 per month
- Occupancy rates average 44.7%
- Daily rates average $196
Shoulder Season
- Revenue averages $1,226 per month
- Occupancy maintains around 29.8%
- Daily rates hold near $186
Low Season (January, February, March)
- Revenue drops to average $593 per month
- Occupancy decreases to average 15.5%
- Daily rates adjust to average $171
Seasonality Insights for Corsavy
- The Airbnb seasonality in Corsavy shows highly seasonal trends requiring careful strategy. While the sections above show seasonal averages, it's also insightful to look at the extremes:
- During the high season, the absolute peak month showcases Corsavy's highest earning potential, with monthly revenues capable of climbing to $2,345, occupancy reaching a high of 52.9%, and ADRs peaking at $198.
- Conversely, the slowest single month of the year, typically falling within the low season, marks the market's lowest point. In this month, revenue might dip to $400, occupancy could drop to 9.7%, and ADRs may adjust down to $168.
- Understanding both the seasonal averages and these monthly peaks and troughs in revenue, occupancy, and ADR is crucial for maximizing your Airbnb profit potential in Corsavy.
Seasonal Strategies for Maximizing Profit
- Peak Season: Maximize revenue through premium pricing and potentially longer minimum stays. Ensure high availability.
- Low Season: Offer competitive pricing, special promotions (e.g., extended stay discounts), and flexible cancellation policies. Target off-season travelers like remote workers or budget-conscious guests.
- Shoulder Seasons: Implement dynamic pricing that balances peak and low rates. Target weekend travelers or specific events. Offer slightly more flexible terms than peak season.
- Regularly analyze your own performance against these Corsavy seasonality benchmarks and adjust your pricing and availability strategy accordingly.
Best Areas for Airbnb Investment in Corsavy (2025)
Exploring the top neighborhoods for short-term rentals in Corsavy? This section highlights key areas, outlining why they are attractive for hosts and guests, along with notable local attractions. Consider these locations based on your target guest profile and investment strategy.
| Neighborhood / Area | Why Host Here? (Target Guests & Appeal) | Key Attractions & Landmarks |
|---|---|---|
| Corsavy Village | A charming village known for its picturesque landscapes and traditional Catalan architecture. Ideal for tourists looking for a tranquil escape in nature, surrounded by hiking trails. | Cascades de la Carança, Canigou Mountain, Nature walks, Local artisan shops |
| Les Bulles | A beautiful area close to Corsavy offering stunning views of the Pyrenees and access to outdoor activities. Perfect for guests interested in hiking, mountain biking, and exploring nature. | PNR des Pyrénées Catalanes, Caves de Canet-en-Roussillon, Mountain trails, Picnic spots |
| Prades | Known for its cultural heritage, with seasonal festivals and a lively market. A great spot for visitors who wish to experience local culture while enjoying the scenic beauty of the region. | Prades Market, Jardin des Liliacées, Collégiale Saint-Pierre, Côte Vermeille |
| Villefranche-de-Conflent | Historic fortified town offering a glimpse into medieval architecture. Attracts tourists who are interested in history and heritage sites. | Fort Libéria, St. Jacques Church, Caves of Ferre |
| Mont-Louis | A fortified mountain village known for its historical significance and stunning views. Ideal for tourists interested in history and outdoor activities. | Citadel of Mont-Louis, Ski resorts, Hiking trails |
| Espace Cambre d'Aze | A destination for winter sports and summer hiking. Appeals to both adventure seekers and families looking for outdoor recreation. | Ski slopes, Hiking trails, Scenic viewpoints |
| Etang de Matemale | A lovely lake area great for water activities and relaxation. Popular among families for picnics and outdoor fun. | Fishing, Boating, Lakeside camping |
| Bols d'Aigüestortes | Part of a national park known for its breathtaking landscapes and biodiversity. Attracts eco-tourists and hikers alike. | Hiking routes, Biodiversity, Rural tourism |
Understanding Airbnb License Requirements & STR Laws in Corsavy (2025)
While Corsavy, Occitania, France currently shows low STR regulations, specific Airbnb license requirements might still exist or change. Always verify the latest short term rental regulations and Airbnb license requirements directly with local government authorities for Corsavy to ensure full compliance before hosting.
(Source: AirROI data, 2025, finding no licensed listings among those analyzed)
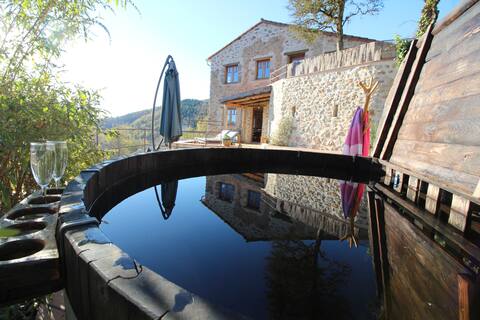
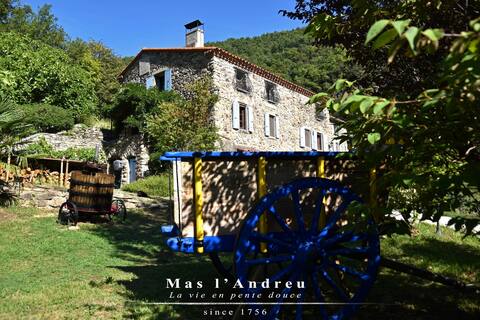
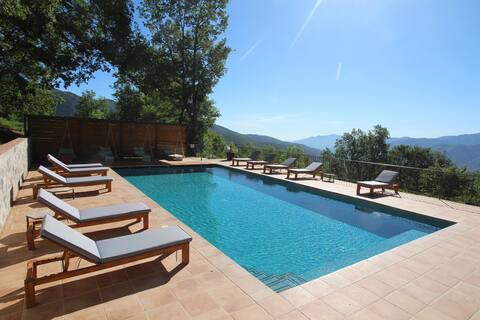
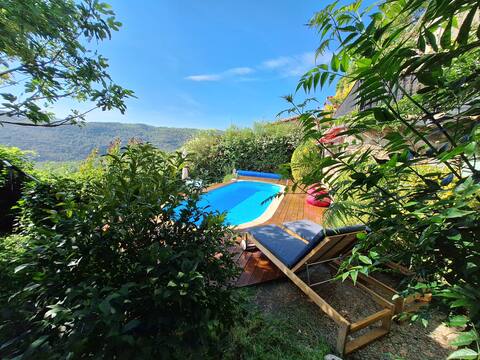
Top Performing Airbnb Properties in Corsavy (2025)
Benchmark your potential! Explore examples of top-performing Airbnb properties in Corsavybased on Trailing Twelve Month (TTM) revenue. Analyze their characteristics, revenue, occupancy rate, and ADR to understand what drives success in this market.

Wilfred le Velu cottage: hidden in the heart of nature
Entire Place • 1 bedroom
Cosy apartment with sauna, pool & mountain views.
Entire Place • 1 bedroom
Mountain retreat with hot tub, pool & sauna.
Entire Place • 3 bedrooms
Gite Guillaume de Gausselme with spa sauna pool
Entire Place • 2 bedrooms
Mountain gites with stunning views, pool and sauna
Entire Place • 2 bedrooms
Private pool, exceptional view, heart of nature!
Entire Place • 1 bedroom
Note: Performance varies based on location, size, amenities, seasonality, and management quality. Data reflects the past 12 months.
Top Performing Airbnb Hosts in Corsavy (2025)
Learn from the best! This table showcases top-performing Airbnb hosts in Corsavy based on the number of properties managed and estimated total revenue over the past year. Analyze their scale and performance metrics.
| Host Name | Properties | Grossing Revenue | Stay Reviews | Avg Rating |
|---|---|---|---|---|
| Alison | 5 | $66,774 | 64 | 4.98/5.0 |
| Arnaud | 3 | $51,965 | 109 | 4.95/5.0 |
| Thierry | 1 | $14,665 | 67 | 4.96/5.0 |
| Kristine | 1 | $13,686 | 29 | 4.90/5.0 |
| Madhu | 1 | $11,994 | 154 | 4.97/5.0 |
| Andy | 1 | $10,201 | 65 | 4.92/5.0 |
| Catherine | 3 | $7,279 | 230 | 4.93/5.0 |
| Gerd | 1 | $4,495 | 8 | 4.00/5.0 |
| Julien | 1 | $2,164 | 12 | 4.67/5.0 |
| Pascale | 1 | $374 | 3 | 4.33/5.0 |
Analyzing the strategies of top hosts, such as their property selection, pricing, and guest communication, can offer valuable lessons for optimizing your own Airbnb operations in Corsavy.
Dive Deeper: Advanced Corsavy STR Market Data (2025)
Ready to unlock more insights? AirROI provides access to advanced metrics and comprehensive Airbnb data for Corsavy. Explore detailed analytics beyond this report to refine your investment strategy, optimize pricing, and maximize your vacation rental profits.
Explore Advanced MetricsCorsavy Short-Term Rental Market Composition (2025): Property & Room Types
Room Type Distribution
Property Type Distribution
Market Composition Insights for Corsavy
- The Corsavy Airbnb market composition is heavily skewed towards Entire Home/Apt listings, which make up 88.9% of the 18 active rentals. This indicates strong guest preference for privacy and space.
- Looking at the property type distribution in Corsavy, House properties are the most common (38.9%), reflecting the local real estate landscape.
- Houses represent a significant 38.9% portion, catering likely to families or larger groups.
- The presence of 11.1% Hotel/Boutique listings indicates integration with traditional hospitality.
Corsavy Airbnb Room Capacity Analysis (2025): Bedroom Distribution
Distribution of Listings by Number of Bedrooms
Room Capacity Insights for Corsavy
- The dominant room capacity in Corsavy is 1 bedroom listings, making up 44.4% of the market. This suggests a strong demand for properties suitable for couples or solo travelers.
- Together, 1 bedroom and 2 bedrooms properties represent 66.6% of the active Airbnb listings in Corsavy, indicating a high concentration in these sizes.
Corsavy Vacation Rental Guest Capacity Trends (2025)
Distribution of Listings by Guest Capacity
Guest Capacity Insights for Corsavy
- The most common guest capacity trend in Corsavy vacation rentals is listings accommodating 4 guests (33.3%). This suggests the primary traveler segment is likely small families or groups.
- Properties designed for 4 guests and 2 guests dominate the Corsavy STR market, accounting for 50.0% of listings.
- 22.3% of properties accommodate 6+ guests, serving the market segment for larger families or group travel in Corsavy.
- On average, properties in Corsavy are equipped to host 4.0 guests.
Corsavy Airbnb Booking Patterns (2025): Available vs. Booked Days
Available Days Distribution
Booked Days Distribution
Booking Pattern Insights for Corsavy
- The most common availability pattern in Corsavy falls within the 271-366 days range, representing 61.1% of listings. This suggests many properties have significant open periods on their calendars.
- Approximately 100.0% of listings show high availability (181+ days open annually), indicating potential for increased bookings or specific owner usage patterns.
- For booked days, the 31-90 days range is most frequent in Corsavy (44.4%), reflecting common guest stay durations or potential owner blocking patterns.
Corsavy Airbnb Minimum Stay Requirements Analysis
Distribution of Listings by Minimum Night Requirement
1 Night
2 listings
11.1% of total
2 Nights
13 listings
72.2% of total
4-6 Nights
1 listings
5.6% of total
7-29 Nights
2 listings
11.1% of total
Key Insights
- The most prevalent minimum stay requirement in Corsavy is 2 Nights, adopted by 72.2% of listings. This highlights the market's preference for shorter, flexible bookings.
- A strong majority (83.3%) of the Corsavy Airbnb data shows acceptance of very short stays (1-2 nights), indicating a dynamic, high-turnover market.
Recommendations
- Align with the market by considering a 2 Nights minimum stay, as 72.2% of Corsavy hosts use this setting.
- If feasible, allowing 1-night stays, especially midweek or during low season, could capture last-minute bookings, as only 11.1% currently do.
- A 2-night minimum appears standard (72.2%). Consider this for weekends or peak periods.
- Adjust minimum nights based on seasonality – potentially shorter during low season and longer during peak demand periods in Corsavy.
Corsavy Airbnb Cancellation Policy Trends Analysis (2025)
Moderate
4 listings
22.2% of total
Firm
4 listings
22.2% of total
Strict
10 listings
55.6% of total
Cancellation Policy Insights for Corsavy
- The prevailing Airbnb cancellation policy trend in Corsavy is Strict, used by 55.6% of listings.
- A majority (77.8%) of hosts in Corsavy utilize Firm or Strict policies, indicating a market where hosts prioritize booking security.
Recommendations for Hosts
- Consider adopting a Strict policy to align with the 55.6% market standard in Corsavy.
- With 55.6% using Strict terms, this is a viable option in Corsavy, particularly for high-value properties or during peak demand periods.
- Regularly review your cancellation policy against competitors and market demand shifts in Corsavy.
Corsavy STR Booking Lead Time Analysis (2025)
Average Booking Lead Time by Month
Booking Lead Time Insights for Corsavy
- The overall average booking lead time for vacation rentals in Corsavy is 72 days.
- Guests book furthest in advance for stays during October (average 143 days), likely coinciding with peak travel demand or local events.
- The shortest booking windows occur for stays in February (average 16 days), indicating more last-minute travel plans during this time.
- Seasonally, Fall (117 days avg.) sees the longest lead times, while Winter (30 days avg.) has the shortest, reflecting typical travel planning cycles.
Recommendations for Hosts
- Use the overall average lead time (72 days) as a baseline for your pricing and availability strategy in Corsavy.
- For October stays, consider implementing length-of-stay discounts or slightly higher rates for bookings made less than 143 days out to capitalize on advance planning.
- Target marketing efforts for the Fall season well in advance (at least 117 days) to capture early planners.
- Monitor your own booking lead times against these Corsavy averages to identify opportunities for dynamic pricing adjustments.
Popular & Essential Airbnb Amenities in Corsavy (2025)
Amenity Prevalence
Amenity Insights for Corsavy
- Essential amenities in Corsavy that guests expect include: Free parking on premises, Coffee maker, Hot water. Lacking these (any) could significantly impact bookings.
- Popular amenities like Wifi, BBQ grill, Kitchen are common but not universal. Offering these can provide a competitive edge.
- Warning: Wifi is not universally provided but is considered essential globally. Ensure reliable Wifi is offered.
Recommendations for Hosts
- Ensure your listing includes all essential amenities for Corsavy: Free parking on premises, Coffee maker, Hot water.
- Consider adding popular differentiators like Wifi or BBQ grill to increase appeal.
- Highlight unique or less common amenities you offer (e.g., hot tub, dedicated workspace, EV charger) in your listing description and photos.
- Regularly check competitor amenities in Corsavy to stay competitive.
Corsavy Airbnb Guest Demographics & Profile Analysis (2025)
Guest Profile Summary for Corsavy
- The typical guest profile for Airbnb in Corsavy consists of a mix of domestic (43%) and international guests, with top international origins including Spain, typically belonging to the Post-2000s (Gen Z/Alpha) group (50%), primarily speaking English or French.
- Domestic travelers account for 43.3% of guests.
- Key international markets include France (43.3%) and Spain (18.9%).
- Top languages spoken are English (32.9%) followed by French (18.3%).
- A significant demographic segment is the Post-2000s (Gen Z/Alpha) group, representing 50% of guests.
Recommendations for Hosts
- Balance marketing efforts between domestic and international channels based on the guest mix.
- Tailor amenities and listing descriptions to appeal to the dominant Post-2000s (Gen Z/Alpha) demographic (e.g., highlight fast WiFi, smart home features, local guides).
- Highlight unique local experiences or amenities relevant to the primary guest profile.
- Consider seasonal promotions aligned with peak travel times for key origin markets.
Nearby Short-Term Rental Market Comparison
How does the Corsavy Airbnb market stack up against its neighbors? Compare key performance metrics like average monthly revenue, ADR, and occupancy rates in surrounding areas to understand the broader regional STR landscape.
| Market | Active Properties | Monthly Revenue | Daily Rate | Avg. Occupancy |
|---|---|---|---|---|
| Vall-llobrega | 15 | $10,261 | $798.88 | 44% |
| Canyelles | 49 | $5,958 | $1023.94 | 37% |
| Arenys de Munt | 28 | $5,100 | $514.27 | 41% |
| Teià | 25 | $5,027 | $348.45 | 45% |
| Cornellà del Terri | 17 | $4,960 | $460.96 | 41% |
| Tiana | 12 | $4,955 | $299.97 | 48% |
| Amer | 10 | $4,848 | $397.58 | 40% |
| Bescanó | 11 | $4,761 | $445.38 | 41% |
| Porqueres | 12 | $4,714 | $469.05 | 36% |
| Premià de Dalt | 28 | $4,630 | $345.43 | 49% |