Comps Airbnb Market Analysis 2025: Short Term Rental Data & Vacation Rental Statistics in Occitania, France
Is Airbnb profitable in Comps in 2025? Explore comprehensive Airbnb analytics for Comps, Occitania, France to uncover income potential. This 2025 STR market report for Comps, based on AirROI data from April 2024 to March 2025, reveals key trends in the niche market of 21 active listings.
Whether you're considering an Airbnb investment in Comps, optimizing your existing vacation rental, or exploring rental arbitrage opportunities, understanding the Comps Airbnb data is crucial. Leveraging the low regulation environment is key to maximizing your short term rental income potential. Let's dive into the specifics.
Key Comps Airbnb Performance Metrics Overview
Monthly Airbnb Revenue Variations & Income Potential in Comps (2025)
Understanding the monthly revenue variations for Airbnb listings in Comps is key to maximizing your short term rental income potential. Seasonality significantly impacts earnings. Our analysis, based on data from the past 12 months, shows that the peak revenue month for STRs in Comps is typically August, while March often presents the lowest earnings, highlighting opportunities for strategic pricing adjustments during shoulder and low seasons. Explore the typical Airbnb income in Comps across different performance tiers:
- Best-in-class properties (Top 10%) achieve $4,007+ monthly, often utilizing dynamic pricing and superior guest experiences.
- Strong performing properties (Top 25%) earn $2,360 or more, indicating effective management and desirable locations/amenities.
- Typical properties (Median) generate around $900 per month, representing the average market performance.
- Entry-level properties (Bottom 25%) see earnings around $337, often with potential for optimization.
Average Monthly Airbnb Earnings Trend in Comps
Comps Airbnb Occupancy Rate Trends (2025)
Maximize your bookings by understanding the Comps STR occupancy trends. Seasonal demand shifts significantly influence how often properties are booked. Typically, Augustsees the highest demand (peak season occupancy), while March experiences the lowest (low season). Effective strategies, like adjusting minimum stays or offering promotions, can boost occupancy during slower periods. Here's how different property tiers perform in Comps:
- Best-in-class properties (Top 10%) achieve 58%+ occupancy, indicating high desirability and potentially optimized availability.
- Strong performing properties (Top 25%) maintain 43% or higher occupancy, suggesting good market fit and guest satisfaction.
- Typical properties (Median) have an occupancy rate around 21%.
- Entry-level properties (Bottom 25%) average 11% occupancy, potentially facing higher vacancy.
Average Monthly Occupancy Rate Trend in Comps
Average Daily Rate (ADR) Airbnb Trends in Comps (2025)
Effective short term rental pricing strategy in Comps involves understanding monthly ADR fluctuations. The Average Daily Rate (ADR) for Airbnb in Comps typically peaks in July and dips lowest during February. Leveraging Airbnb dynamic pricing tools or strategies based on this seasonality can significantly boost revenue. Here's a look at the typical nightly rates achieved:
- Best-in-class properties (Top 10%) command rates of $243+ per night, often due to premium features or locations.
- Strong performing properties (Top 25%) achieve nightly rates of $181 or more.
- Typical properties (Median) charge around $112 per night.
- Entry-level properties (Bottom 25%) earn around $79 per night.
Average Daily Rate (ADR) Trend by Month in Comps
Get Live Comps Market Intelligence 👇

Explore Real-time Analytics
Airbnb Seasonality Analysis & Trends in Comps (2025)
Peak Season (August, July, June)
- Revenue averages $2,636 per month
- Occupancy rates average 45.4%
- Daily rates average $145
Shoulder Season
- Revenue averages $1,390 per month
- Occupancy maintains around 26.4%
- Daily rates hold near $132
Low Season (February, March, October)
- Revenue drops to average $761 per month
- Occupancy decreases to average 14.0%
- Daily rates adjust to average $129
Seasonality Insights for Comps
- The Airbnb seasonality in Comps shows highly seasonal trends requiring careful strategy. While the sections above show seasonal averages, it's also insightful to look at the extremes:
- During the high season, the absolute peak month showcases Comps's highest earning potential, with monthly revenues capable of climbing to $3,198, occupancy reaching a high of 61.3%, and ADRs peaking at $149.
- Conversely, the slowest single month of the year, typically falling within the low season, marks the market's lowest point. In this month, revenue might dip to $528, occupancy could drop to 12.1%, and ADRs may adjust down to $126.
- Understanding both the seasonal averages and these monthly peaks and troughs in revenue, occupancy, and ADR is crucial for maximizing your Airbnb profit potential in Comps.
Seasonal Strategies for Maximizing Profit
- Peak Season: Maximize revenue through premium pricing and potentially longer minimum stays. Ensure high availability.
- Low Season: Offer competitive pricing, special promotions (e.g., extended stay discounts), and flexible cancellation policies. Target off-season travelers like remote workers or budget-conscious guests.
- Shoulder Seasons: Implement dynamic pricing that balances peak and low rates. Target weekend travelers or specific events. Offer slightly more flexible terms than peak season.
- Regularly analyze your own performance against these Comps seasonality benchmarks and adjust your pricing and availability strategy accordingly.
Best Areas for Airbnb Investment in Comps (2025)
Exploring the top neighborhoods for short-term rentals in Comps? This section highlights key areas, outlining why they are attractive for hosts and guests, along with notable local attractions. Consider these locations based on your target guest profile and investment strategy.
| Neighborhood / Area | Why Host Here? (Target Guests & Appeal) | Key Attractions & Landmarks |
|---|---|---|
| Montpellier | Vibrant city known for its rich history and youthful atmosphere, home to a large student population and numerous cultural attractions. Ideal for hosting both short-term tourists and long-term renters. | Place de la Comédie, Montpellier Zoo, Musée Fabre, Antigone district, Botanical Garden |
| Nîmes | Famous for its well-preserved Roman architecture and historical sites, Nîmes attracts visitors interested in history and culture, making it a great market for tourists and vacation rentals. | Arena of Nîmes, Maison Carrée, Jardins de la Fontaine, Pont du Gard, Nîmes Museum |
| Avignon | Historic city known for the stunning Palais des Papes and the annual theatre festival. Perfect for Airbnb hosts due to its popularity among international tourists. | Palais des Papes, Pont Saint-Bénézet, Avignon Festival, Rocher des Doms, Museu Calvet |
| Sète | Picturesque coastal town renowned for its canals and seafood. Popular among beachgoers and visitors looking for a relaxing seaside experience. | Étang de Thau, Mont Saint-Clair, Sète beaches, Cimetière marin, Fisherman's Museum |
| Carcassonne | Home to a UNESCO World Heritage-listed fortified city, Carcassonne is a significant tourist destination that draws history enthusiasts and families alike. | Cité de Carcassonne, Château Comtal, Basilique Saint-Nazaire, Canal du Midi, La Cité's restaurant scene |
| Toulouse | The fourth largest city in France, known for its aerospace industry and vibrant cultural scene. Attracts both business travelers and tourists, making it a versatile location for hosts. | Capitole de Toulouse, Basilique Saint-Sernin, Cité de l'Espace, Garonne River, Les Abattoirs |
| Perpignan | A city with a distinct Catalan influence, Perpignan offers a unique blend of French and Spanish culture, attracting tourists who seek diverse experiences. | Palace of the Kings of Majorca, Perpignan Cathedral, Castillet, Le Castillet museum, Pyrénées-Orientales vineyards |
| Saint-Rémy-de-Provence | Charming Provencal town known for its beautiful landscapes and rich history. Very popular among tourists looking for the quintessential French countryside experience. | Saint-Paul-de-Mausole, Glanum archaeological site, market square, Van Gogh's landscapes, Provençal cuisine |
Understanding Airbnb License Requirements & STR Laws in Comps (2025)
While Comps, Occitania, France currently shows low STR regulations, specific Airbnb license requirements might still exist or change. Always verify the latest short term rental regulations and Airbnb license requirements directly with local government authorities for Comps to ensure full compliance before hosting.
(Source: AirROI data, 2025, finding no licensed listings among those analyzed)
Top Performing Airbnb Properties in Comps (2025)
Benchmark your potential! Explore examples of top-performing Airbnb properties in Compsbased on Trailing Twelve Month (TTM) revenue. Analyze their characteristics, revenue, occupancy rate, and ADR to understand what drives success in this market.

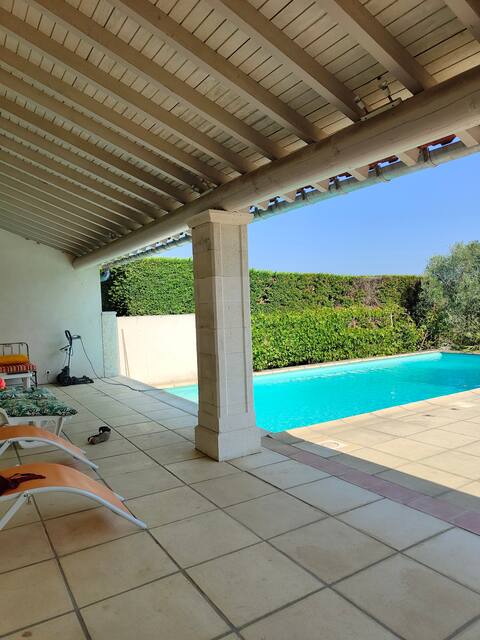
4 bedroom villa with pool and airco
Entire Place • 4 bedrooms

Charming cottage Le clos Olives .
Entire Place • 1 bedroom
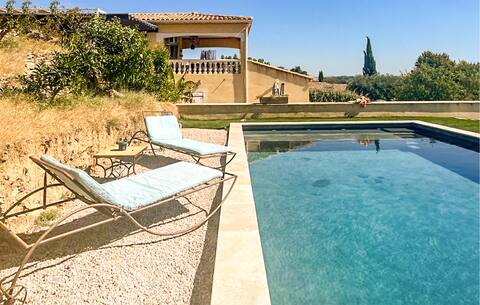
Villa with pool surrounded by olive trees
Entire Place • 3 bedrooms
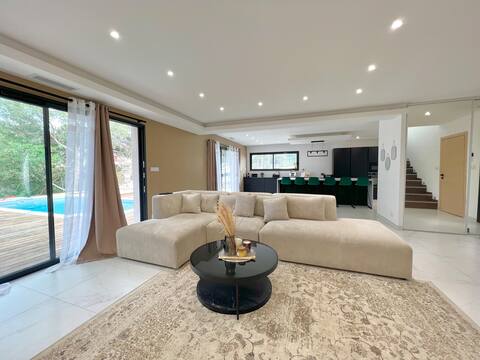
Stunning home in Comps with kitchen
Entire Place • 3 bedrooms
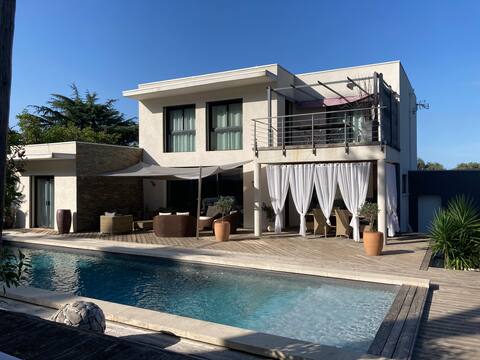
Contemporary villa with swimming pool not overlooked
Entire Place • 4 bedrooms
Logement avec piscine
Entire Place • 2 bedrooms
Note: Performance varies based on location, size, amenities, seasonality, and management quality. Data reflects the past 12 months.
Top Performing Airbnb Hosts in Comps (2025)
Learn from the best! This table showcases top-performing Airbnb hosts in Comps based on the number of properties managed and estimated total revenue over the past year. Analyze their scale and performance metrics.
| Host Name | Properties | Grossing Revenue | Stay Reviews | Avg Rating |
|---|---|---|---|---|
| Helen | 1 | $29,713 | 11 | 5.00/5.0 |
| Jasmine | 1 | $22,412 | 126 | 4.90/5.0 |
| Daniel | 1 | $18,247 | 5 | 4.60/5.0 |
| Host #137499444 | 1 | $17,856 | 1 | 0.00/5.0 |
| Salima | 1 | $15,015 | 4 | 4.25/5.0 |
| Teddy | 3 | $13,922 | 36 | 4.80/5.0 |
| Host #67215269 | 1 | $13,059 | 2 | 0.00/5.0 |
| Alain | 1 | $12,529 | 18 | 4.89/5.0 |
| Norbert | 1 | $9,407 | 13 | 4.23/5.0 |
| Jeremy | 1 | $8,957 | 8 | 4.88/5.0 |
Analyzing the strategies of top hosts, such as their property selection, pricing, and guest communication, can offer valuable lessons for optimizing your own Airbnb operations in Comps.
Dive Deeper: Advanced Comps STR Market Data (2025)
Ready to unlock more insights? AirROI provides access to advanced metrics and comprehensive Airbnb data for Comps. Explore detailed analytics beyond this report to refine your investment strategy, optimize pricing, and maximize your vacation rental profits.
Explore Advanced MetricsComps Short-Term Rental Market Composition (2025): Property & Room Types
Room Type Distribution
Property Type Distribution
Market Composition Insights for Comps
- The Comps Airbnb market composition is heavily skewed towards Entire Home/Apt listings, which make up 81% of the 21 active rentals. This indicates strong guest preference for privacy and space.
- Looking at the property type distribution in Comps, House properties are the most common (71.4%), reflecting the local real estate landscape.
- Houses represent a significant 71.4% portion, catering likely to families or larger groups.
- The presence of 14.3% Hotel/Boutique listings indicates integration with traditional hospitality.
Comps Airbnb Room Capacity Analysis (2025): Bedroom Distribution
Distribution of Listings by Number of Bedrooms
Room Capacity Insights for Comps
- The dominant room capacity in Comps is 3 bedrooms listings, making up 33.3% of the market. This suggests a strong demand for properties suitable for families or small groups.
- Together, 3 bedrooms and 1 bedroom properties represent 61.9% of the active Airbnb listings in Comps, indicating a high concentration in these sizes.
- A significant 47.6% of listings offer 3+ bedrooms, catering to larger groups and families seeking more space in Comps.
Comps Vacation Rental Guest Capacity Trends (2025)
Distribution of Listings by Guest Capacity
Guest Capacity Insights for Comps
- The most common guest capacity trend in Comps vacation rentals is listings accommodating 6 guests (28.6%). This suggests the primary traveler segment is likely larger groups.
- Properties designed for 6 guests and 8+ guests dominate the Comps STR market, accounting for 42.9% of listings.
- 42.9% of properties accommodate 6+ guests, serving the market segment for larger families or group travel in Comps.
- On average, properties in Comps are equipped to host 4.3 guests.
Comps Airbnb Booking Patterns (2025): Available vs. Booked Days
Available Days Distribution
Booked Days Distribution
Booking Pattern Insights for Comps
- The most common availability pattern in Comps falls within the 271-366 days range, representing 81% of listings. This suggests many properties have significant open periods on their calendars.
- Approximately 100.0% of listings show high availability (181+ days open annually), indicating potential for increased bookings or specific owner usage patterns.
- For booked days, the 31-90 days range is most frequent in Comps (47.6%), reflecting common guest stay durations or potential owner blocking patterns.
Comps Airbnb Minimum Stay Requirements Analysis
Distribution of Listings by Minimum Night Requirement
1 Night
5 listings
23.8% of total
2 Nights
5 listings
23.8% of total
3 Nights
3 listings
14.3% of total
4-6 Nights
4 listings
19% of total
7-29 Nights
3 listings
14.3% of total
30+ Nights
1 listings
4.8% of total
Key Insights
- The most prevalent minimum stay requirement in Comps is 1 Night, adopted by 23.8% of listings. This highlights the market's preference for shorter, flexible bookings.
Recommendations
- Align with the market by considering a 1 Night minimum stay, as 23.8% of Comps hosts use this setting.
- If feasible, allowing 1-night stays, especially midweek or during low season, could capture last-minute bookings, as only 23.8% currently do.
- Adjust minimum nights based on seasonality – potentially shorter during low season and longer during peak demand periods in Comps.
Comps Airbnb Cancellation Policy Trends Analysis (2025)
Flexible
5 listings
29.4% of total
Moderate
4 listings
23.5% of total
Firm
4 listings
23.5% of total
Strict
4 listings
23.5% of total
Cancellation Policy Insights for Comps
- The prevailing Airbnb cancellation policy trend in Comps is Flexible, used by 29.4% of listings.
- There's a relatively balanced mix between guest-friendly (52.9%) and stricter (47.0%) policies, offering choices for different guest needs.
Recommendations for Hosts
- Consider adopting a Flexible policy to align with the 29.4% market standard in Comps.
- Regularly review your cancellation policy against competitors and market demand shifts in Comps.
Comps STR Booking Lead Time Analysis (2025)
Average Booking Lead Time by Month
Booking Lead Time Insights for Comps
- The overall average booking lead time for vacation rentals in Comps is 67 days.
- Guests book furthest in advance for stays during November (average 121 days), likely coinciding with peak travel demand or local events.
- The shortest booking windows occur for stays in February (average 0 days), indicating more last-minute travel plans during this time.
- Seasonally, Fall (88 days avg.) sees the longest lead times, while Winter (12 days avg.) has the shortest, reflecting typical travel planning cycles.
Recommendations for Hosts
- Use the overall average lead time (67 days) as a baseline for your pricing and availability strategy in Comps.
- For November stays, consider implementing length-of-stay discounts or slightly higher rates for bookings made less than 121 days out to capitalize on advance planning.
- During February, focus on last-minute booking availability and promotions, as guests book with very short notice (0 days avg.).
- Target marketing efforts for the Fall season well in advance (at least 88 days) to capture early planners.
- Monitor your own booking lead times against these Comps averages to identify opportunities for dynamic pricing adjustments.
Popular & Essential Airbnb Amenities in Comps (2025)
Amenity Prevalence
Amenity Insights for Comps
- Essential amenities in Comps that guests expect include: Kitchen, Wifi, TV, Heating, Free parking on premises. Lacking these (any) could significantly impact bookings.
- Popular amenities like Dishes and silverware, Hot water, Cooking basics are common but not universal. Offering these can provide a competitive edge.
Recommendations for Hosts
- Ensure your listing includes all essential amenities for Comps: Kitchen, Wifi, TV, Heating, Free parking on premises.
- Prioritize adding missing essentials: Wifi, TV, Heating, Free parking on premises.
- Consider adding popular differentiators like Dishes and silverware or Hot water to increase appeal.
- Highlight unique or less common amenities you offer (e.g., hot tub, dedicated workspace, EV charger) in your listing description and photos.
- Regularly check competitor amenities in Comps to stay competitive.
Comps Airbnb Guest Demographics & Profile Analysis (2025)
Guest Profile Summary for Comps
- The typical guest profile for Airbnb in Comps consists of a mix of domestic (55%) and international guests, often arriving from nearby Paris, typically belonging to the Post-2000s (Gen Z/Alpha) group (50%), primarily speaking French or English.
- Domestic travelers account for 54.8% of guests.
- Key international markets include France (54.8%) and Germany (14.3%).
- Top languages spoken are French (34.3%) followed by English (34.3%).
- A significant demographic segment is the Post-2000s (Gen Z/Alpha) group, representing 50% of guests.
Recommendations for Hosts
- Balance marketing efforts between domestic and international channels based on the guest mix.
- Tailor amenities and listing descriptions to appeal to the dominant Post-2000s (Gen Z/Alpha) demographic (e.g., highlight fast WiFi, smart home features, local guides).
- Highlight unique local experiences or amenities relevant to the primary guest profile.
- Consider seasonal promotions aligned with peak travel times for key origin markets.
Nearby Short-Term Rental Market Comparison
How does the Comps Airbnb market stack up against its neighbors? Compare key performance metrics like average monthly revenue, ADR, and occupancy rates in surrounding areas to understand the broader regional STR landscape.
| Market | Active Properties | Monthly Revenue | Daily Rate | Avg. Occupancy |
|---|---|---|---|---|
| Villeneuvette | 13 | $4,150 | $337.56 | 44% |
| Divajeu | 19 | $3,941 | $410.65 | 42% |
| Chantepérier | 20 | $3,057 | $281.60 | 37% |
| Rupià | 11 | $3,046 | $386.95 | 40% |
| Gordes | 225 | $2,913 | $366.32 | 43% |
| Redessan | 19 | $2,834 | $334.82 | 34% |
| Fontarèches | 11 | $2,802 | $525.31 | 34% |
| Ménerbes | 97 | $2,800 | $453.86 | 41% |
| La Bruguière | 14 | $2,732 | $277.64 | 50% |
| Soyans | 12 | $2,721 | $193.55 | 45% |