Compeyre Airbnb Market Analysis 2025: Short Term Rental Data & Vacation Rental Statistics in Occitania, France
Is Airbnb profitable in Compeyre in 2025? Explore comprehensive Airbnb analytics for Compeyre, Occitania, France to uncover income potential. This 2025 STR market report for Compeyre, based on AirROI data from April 2024 to March 2025, reveals key trends in the niche market of 18 active listings.
Whether you're considering an Airbnb investment in Compeyre, optimizing your existing vacation rental, or exploring rental arbitrage opportunities, understanding the Compeyre Airbnb data is crucial. Understanding the local regulations is key to maximizing your short term rental income potential. Let's dive into the specifics.
Key Compeyre Airbnb Performance Metrics Overview
Monthly Airbnb Revenue Variations & Income Potential in Compeyre (2025)
Understanding the monthly revenue variations for Airbnb listings in Compeyre is key to maximizing your short term rental income potential. Seasonality significantly impacts earnings. Our analysis, based on data from the past 12 months, shows that the peak revenue month for STRs in Compeyre is typically August, while February often presents the lowest earnings, highlighting opportunities for strategic pricing adjustments during shoulder and low seasons. Explore the typical Airbnb income in Compeyre across different performance tiers:
- Best-in-class properties (Top 10%) achieve $3,714+ monthly, often utilizing dynamic pricing and superior guest experiences.
- Strong performing properties (Top 25%) earn $1,542 or more, indicating effective management and desirable locations/amenities.
- Typical properties (Median) generate around $643 per month, representing the average market performance.
- Entry-level properties (Bottom 25%) see earnings around $388, often with potential for optimization.
Average Monthly Airbnb Earnings Trend in Compeyre
Compeyre Airbnb Occupancy Rate Trends (2025)
Maximize your bookings by understanding the Compeyre STR occupancy trends. Seasonal demand shifts significantly influence how often properties are booked. Typically, Augustsees the highest demand (peak season occupancy), while February experiences the lowest (low season). Effective strategies, like adjusting minimum stays or offering promotions, can boost occupancy during slower periods. Here's how different property tiers perform in Compeyre:
- Best-in-class properties (Top 10%) achieve 49%+ occupancy, indicating high desirability and potentially optimized availability.
- Strong performing properties (Top 25%) maintain 39% or higher occupancy, suggesting good market fit and guest satisfaction.
- Typical properties (Median) have an occupancy rate around 25%.
- Entry-level properties (Bottom 25%) average 14% occupancy, potentially facing higher vacancy.
Average Monthly Occupancy Rate Trend in Compeyre
Average Daily Rate (ADR) Airbnb Trends in Compeyre (2025)
Effective short term rental pricing strategy in Compeyre involves understanding monthly ADR fluctuations. The Average Daily Rate (ADR) for Airbnb in Compeyre typically peaks in January and dips lowest during March. Leveraging Airbnb dynamic pricing tools or strategies based on this seasonality can significantly boost revenue. Here's a look at the typical nightly rates achieved:
- Best-in-class properties (Top 10%) command rates of $235+ per night, often due to premium features or locations.
- Strong performing properties (Top 25%) achieve nightly rates of $181 or more.
- Typical properties (Median) charge around $98 per night.
- Entry-level properties (Bottom 25%) earn around $67 per night.
Average Daily Rate (ADR) Trend by Month in Compeyre
Get Live Compeyre Market Intelligence 👇

Explore Real-time Analytics
Airbnb Seasonality Analysis & Trends in Compeyre (2025)
Peak Season (August, December, January)
- Revenue averages $1,947 per month
- Occupancy rates average 36.1%
- Daily rates average $134
Shoulder Season
- Revenue averages $1,437 per month
- Occupancy maintains around 29.2%
- Daily rates hold near $129
Low Season (February, March, June)
- Revenue drops to average $654 per month
- Occupancy decreases to average 17.9%
- Daily rates adjust to average $126
Seasonality Insights for Compeyre
- The Airbnb seasonality in Compeyre shows highly seasonal trends requiring careful strategy. While the sections above show seasonal averages, it's also insightful to look at the extremes:
- During the high season, the absolute peak month showcases Compeyre's highest earning potential, with monthly revenues capable of climbing to $2,214, occupancy reaching a high of 59.3%, and ADRs peaking at $142.
- Conversely, the slowest single month of the year, typically falling within the low season, marks the market's lowest point. In this month, revenue might dip to $418, occupancy could drop to 12.9%, and ADRs may adjust down to $124.
- Understanding both the seasonal averages and these monthly peaks and troughs in revenue, occupancy, and ADR is crucial for maximizing your Airbnb profit potential in Compeyre.
Seasonal Strategies for Maximizing Profit
- Peak Season: Maximize revenue through premium pricing and potentially longer minimum stays. Ensure high availability.
- Low Season: Offer competitive pricing, special promotions (e.g., extended stay discounts), and flexible cancellation policies. Target off-season travelers like remote workers or budget-conscious guests.
- Shoulder Seasons: Implement dynamic pricing that balances peak and low rates. Target weekend travelers or specific events. Offer slightly more flexible terms than peak season.
- Regularly analyze your own performance against these Compeyre seasonality benchmarks and adjust your pricing and availability strategy accordingly.
Best Areas for Airbnb Investment in Compeyre (2025)
Exploring the top neighborhoods for short-term rentals in Compeyre? This section highlights key areas, outlining why they are attractive for hosts and guests, along with notable local attractions. Consider these locations based on your target guest profile and investment strategy.
| Neighborhood / Area | Why Host Here? (Target Guests & Appeal) | Key Attractions & Landmarks |
|---|---|---|
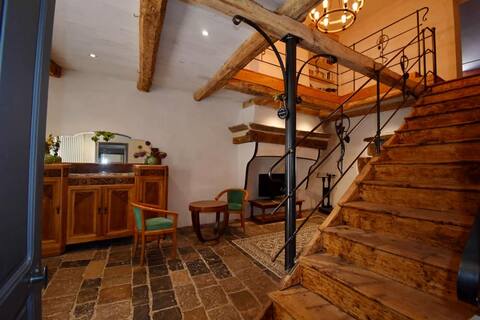
| Compeyre Village Center | Charming village ambiance with close access to local markets and restaurants. Ideal for travelers looking for a quaint village experience and local culture. | Local markets, Historic churches, Scenic walking trails, Cafes and bistros |
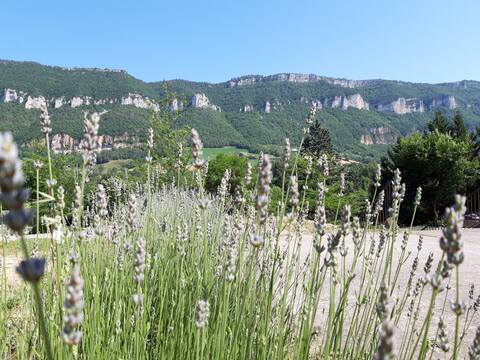
| Millau Viaduct View Point | Stunning views of the iconic Millau Viaduct, attracting tourists interested in architecture and nature. A unique spot for nature lovers and photographers. | Millau Viaduct, Parc Naturel Régional des Grands Causses, hiking trails, picnic areas |
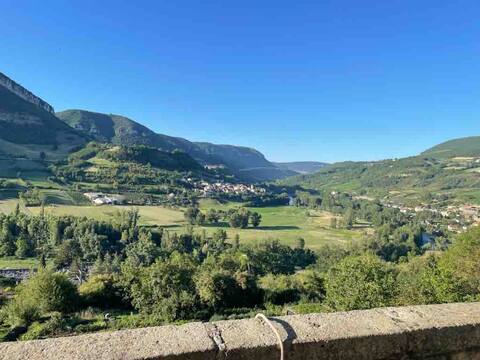
| Gorges du Tarn | Breathtaking natural scenery and outdoor activities make this area a perfect retreat for adventure seekers and nature lovers. | Kayaking and canoeing, Hiking trails, Caves of the Tarn, Climbing spots |
| Viaduc de Millau Area | Proximity to various outdoor activities and picturesque landscapes, ideal for families and adventure enthusiasts. | Mountain biking trails, Guided tours, Camping sites, Scenic drives |
| Caves of Roquefort | Famous for its Roquefort cheese caves, attracting food lovers and tourists interested in local culinary heritage. | Cave tours, Tasting sessions, Roquefort village |
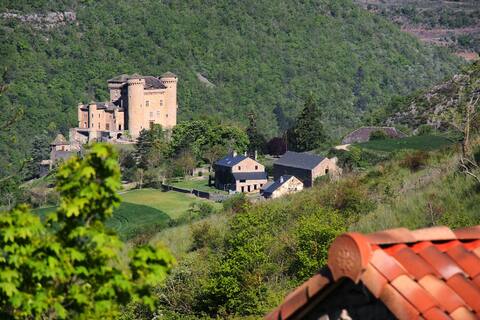
| Saint Affrique | A nearby town with rich history and local culture, offering a good alternative for accommodations while exploring the region. | Medieval architecture, Local festivals, Museums |
| Larzac Plateau | Known for its unique landscapes and historical significance, perfect for hiking and history enthusiasts. | Hiking routes, Historic sites, Local farms and artisan shops |
| Cévennes National Park | A UNESCO-listed site with diverse ecosystems and scenic beauty, attracting tourists interested in nature and biodiversity. | Nature reserves, Hiking paths, Flora and fauna diversity |
Understanding Airbnb License Requirements & STR Laws in Compeyre (2025)
With 11% of listings showing registration in 2025, understanding potential Airbnb license requirements is crucial in Compeyre. Always verify the latest short term rental regulations and Airbnb license requirements directly with local government authorities for Compeyre to ensure full compliance before hosting.
(Source: AirROI data, 2025, based on 11% licensed listings)
Top Performing Airbnb Properties in Compeyre (2025)
Benchmark your potential! Explore examples of top-performing Airbnb properties in Compeyrebased on Trailing Twelve Month (TTM) revenue. Analyze their characteristics, revenue, occupancy rate, and ADR to understand what drives success in this market.

Family home with a pretty park
Entire Place • 5 bedrooms
Maison du Vigneron - Aux Portes des gorges du Tarn
Entire Place • 7 bedrooms
Spacious house with breathtaking views
Entire Place • 3 bedrooms
Gite - Vallée du Tarn en Aveyron (12 seats)
Entire Place • 4 bedrooms
Le Grand Gîte de Cabrières
Entire Place �• 6 bedrooms

Gîte Chez Marie in Compeyre
Entire Place • 1 bedroom
Note: Performance varies based on location, size, amenities, seasonality, and management quality. Data reflects the past 12 months.
Top Performing Airbnb Hosts in Compeyre (2025)
Learn from the best! This table showcases top-performing Airbnb hosts in Compeyre based on the number of properties managed and estimated total revenue over the past year. Analyze their scale and performance metrics.
| Host Name | Properties | Grossing Revenue | Stay Reviews | Avg Rating |
|---|---|---|---|---|
| Marie Françoise Magali | 1 | $59,251 | 20 | 4.85/5.0 |
| Alice | 1 | $29,848 | 7 | 5.00/5.0 |
| Alain | 2 | $24,777 | 98 | 4.71/5.0 |
| Karine Et Brice | 1 | $20,538 | 33 | 4.76/5.0 |
| Ruth | 2 | $14,022 | 16 | 5.00/5.0 |
| Marie | 2 | $13,818 | 28 | 4.81/5.0 |
| Aimé | 2 | $11,301 | 171 | 4.88/5.0 |
| Host #125478732 | 2 | $7,559 | 0 | 0.00/5.0 |
| Nicole | 1 | $5,842 | 19 | 4.74/5.0 |
| Andrée | 1 | $5,645 | 81 | 4.86/5.0 |
Analyzing the strategies of top hosts, such as their property selection, pricing, and guest communication, can offer valuable lessons for optimizing your own Airbnb operations in Compeyre.
Dive Deeper: Advanced Compeyre STR Market Data (2025)
Ready to unlock more insights? AirROI provides access to advanced metrics and comprehensive Airbnb data for Compeyre. Explore detailed analytics beyond this report to refine your investment strategy, optimize pricing, and maximize your vacation rental profits.
Explore Advanced MetricsCompeyre Short-Term Rental Market Composition (2025): Property & Room Types
Room Type Distribution
Property Type Distribution
Market Composition Insights for Compeyre
- The Compeyre Airbnb market composition is heavily skewed towards Entire Home/Apt listings, which make up 77.8% of the 18 active rentals. This indicates strong guest preference for privacy and space.
- Looking at the property type distribution in Compeyre, House properties are the most common (61.1%), reflecting the local real estate landscape.
- Houses represent a significant 61.1% portion, catering likely to families or larger groups.
- The presence of 27.8% Hotel/Boutique listings indicates integration with traditional hospitality.
Compeyre Airbnb Room Capacity Analysis (2025): Bedroom Distribution
Distribution of Listings by Number of Bedrooms
Room Capacity Insights for Compeyre
- The dominant room capacity in Compeyre is 1 bedroom listings, making up 38.9% of the market. This suggests a strong demand for properties suitable for couples or solo travelers.
- Together, 1 bedroom and 5+ bedrooms properties represent 55.6% of the active Airbnb listings in Compeyre, indicating a high concentration in these sizes.
- A significant 27.9% of listings offer 3+ bedrooms, catering to larger groups and families seeking more space in Compeyre.
Compeyre Vacation Rental Guest Capacity Trends (2025)
Distribution of Listings by Guest Capacity
Guest Capacity Insights for Compeyre
- The most common guest capacity trend in Compeyre vacation rentals is listings accommodating 2 guests (44.4%). This suggests the primary traveler segment is likely couples or solo travelers.
- Properties designed for 2 guests and 8+ guests dominate the Compeyre STR market, accounting for 66.6% of listings.
- A significant 44.4% of listings cater specifically to 1-2 guests, highlighting strong demand from couples and solo travelers in Compeyre.
- 33.3% of properties accommodate 6+ guests, serving the market segment for larger families or group travel in Compeyre.
- On average, properties in Compeyre are equipped to host 4.0 guests.
Compeyre Airbnb Booking Patterns (2025): Available vs. Booked Days
Available Days Distribution
Booked Days Distribution
Booking Pattern Insights for Compeyre
- The most common availability pattern in Compeyre falls within the 271-366 days range, representing 72.2% of listings. This suggests many properties have significant open periods on their calendars.
- Approximately 94.4% of listings show high availability (181+ days open annually), indicating potential for increased bookings or specific owner usage patterns.
- For booked days, the 31-90 days range is most frequent in Compeyre (50%), reflecting common guest stay durations or potential owner blocking patterns.
- A notable 5.6% of properties secure long booking periods (181+ days booked per year), highlighting successful long-term rental strategies or significant owner usage.
Compeyre Airbnb Minimum Stay Requirements Analysis
Distribution of Listings by Minimum Night Requirement
1 Night
1 listings
6.3% of total
2 Nights
10 listings
62.5% of total
3 Nights
2 listings
12.5% of total
4-6 Nights
1 listings
6.3% of total
7-29 Nights
1 listings
6.3% of total
30+ Nights
1 listings
6.3% of total
Key Insights
- The most prevalent minimum stay requirement in Compeyre is 2 Nights, adopted by 62.5% of listings. This highlights the market's preference for shorter, flexible bookings.
- A strong majority (68.8%) of the Compeyre Airbnb data shows acceptance of very short stays (1-2 nights), indicating a dynamic, high-turnover market.
Recommendations
- Align with the market by considering a 2 Nights minimum stay, as 62.5% of Compeyre hosts use this setting.
- If feasible, allowing 1-night stays, especially midweek or during low season, could capture last-minute bookings, as only 6.3% currently do.
- A 2-night minimum appears standard (62.5%). Consider this for weekends or peak periods.
- Explore offering discounts for stays of 30+ nights to attract the 6.3% of the market seeking extended stays.
- Adjust minimum nights based on seasonality – potentially shorter during low season and longer during peak demand periods in Compeyre.
Compeyre Airbnb Cancellation Policy Trends Analysis (2025)
Flexible
6 listings
37.5% of total
Moderate
2 listings
12.5% of total
Firm
3 listings
18.8% of total
Strict
5 listings
31.3% of total
Cancellation Policy Insights for Compeyre
- The prevailing Airbnb cancellation policy trend in Compeyre is Flexible, used by 37.5% of listings.
- A majority (50.1%) of hosts in Compeyre utilize Firm or Strict policies, indicating a market where hosts prioritize booking security.
Recommendations for Hosts
- Consider adopting a Flexible policy to align with the 37.5% market standard in Compeyre.
- With 31.3% using Strict terms, this is a viable option in Compeyre, particularly for high-value properties or during peak demand periods.
- Regularly review your cancellation policy against competitors and market demand shifts in Compeyre.
Compeyre STR Booking Lead Time Analysis (2025)
Average Booking Lead Time by Month
Booking Lead Time Insights for Compeyre
- The overall average booking lead time for vacation rentals in Compeyre is 82 days.
- Guests book furthest in advance for stays during October (average 140 days), likely coinciding with peak travel demand or local events.
- The shortest booking windows occur for stays in November (average 12 days), indicating more last-minute travel plans during this time.
- Seasonally, Fall (75 days avg.) sees the longest lead times, while Winter (47 days avg.) has the shortest, reflecting typical travel planning cycles.
Recommendations for Hosts
- Use the overall average lead time (82 days) as a baseline for your pricing and availability strategy in Compeyre.
- For October stays, consider implementing length-of-stay discounts or slightly higher rates for bookings made less than 140 days out to capitalize on advance planning.
- During November, focus on last-minute booking availability and promotions, as guests book with very short notice (12 days avg.).
- Target marketing efforts for the Fall season well in advance (at least 75 days) to capture early planners.
- Monitor your own booking lead times against these Compeyre averages to identify opportunities for dynamic pricing adjustments.
Popular & Essential Airbnb Amenities in Compeyre (2025)
Amenity Prevalence
Amenity Insights for Compeyre
- Popular amenities like Heating, Kitchen, Hangers are common but not universal. Offering these can provide a competitive edge.
Recommendations for Hosts
- Consider adding popular differentiators like Heating or Kitchen to increase appeal.
- Highlight unique or less common amenities you offer (e.g., hot tub, dedicated workspace, EV charger) in your listing description and photos.
- Regularly check competitor amenities in Compeyre to stay competitive.
Compeyre Airbnb Guest Demographics & Profile Analysis (2025)
Guest Profile Summary for Compeyre
- The typical guest profile for Airbnb in Compeyre consists of primarily domestic travelers (93%), often arriving from nearby Montpellier, typically belonging to the Post-2000s (Gen Z/Alpha) group (50%), primarily speaking French or English.
- Domestic travelers account for 92.5% of guests.
- Key international markets include France (92.5%) and Netherlands (3.8%).
- Top languages spoken are French (51.1%) followed by English (29.8%).
- A significant demographic segment is the Post-2000s (Gen Z/Alpha) group, representing 50% of guests.
Recommendations for Hosts
- Target domestic marketing efforts towards travelers from Montpellier and Marseille.
- Tailor amenities and listing descriptions to appeal to the dominant Post-2000s (Gen Z/Alpha) demographic (e.g., highlight fast WiFi, smart home features, local guides).
- Highlight unique local experiences or amenities relevant to the primary guest profile.
- Consider seasonal promotions aligned with peak travel times for key origin markets.
Nearby Short-Term Rental Market Comparison
How does the Compeyre Airbnb market stack up against its neighbors? Compare key performance metrics like average monthly revenue, ADR, and occupancy rates in surrounding areas to understand the broader regional STR landscape.
| Market | Active Properties | Monthly Revenue | Daily Rate | Avg. Occupancy |
|---|---|---|---|---|
| Villeneuvette | 13 | $4,150 | $337.56 | 44% |
| Divajeu | 19 | $3,941 | $410.65 | 42% |
| Saint-Germain-au-Mont-d'Or | 10 | $3,928 | $316.02 | 40% |
| Dommartin | 11 | $3,905 | $327.00 | 36% |
| Courzieu | 11 | $3,267 | $287.83 | 52% |
| Vanosc | 13 | $3,072 | $224.52 | 44% |
| Redessan | 19 | $2,834 | $334.82 | 34% |
| Fontarèches | 11 | $2,802 | $525.31 | 34% |
| La Bruguière | 14 | $2,732 | $277.64 | 50% |
| Verquières | 13 | $2,688 | $424.97 | 49% |