Catus Airbnb Market Analysis 2025: Short Term Rental Data & Vacation Rental Statistics in Occitania, France
Is Airbnb profitable in Catus in 2025? Explore comprehensive Airbnb analytics for Catus, Occitania, France to uncover income potential. This 2025 STR market report for Catus, based on AirROI data from April 2024 to March 2025, reveals key trends in the niche market of 20 active listings.
Whether you're considering an Airbnb investment in Catus, optimizing your existing vacation rental, or exploring rental arbitrage opportunities, understanding the Catus Airbnb data is crucial. Leveraging the low regulation environment is key to maximizing your short term rental income potential. Let's dive into the specifics.
Key Catus Airbnb Performance Metrics Overview
Monthly Airbnb Revenue Variations & Income Potential in Catus (2025)
Understanding the monthly revenue variations for Airbnb listings in Catus is key to maximizing your short term rental income potential. Seasonality significantly impacts earnings. Our analysis, based on data from the past 12 months, shows that the peak revenue month for STRs in Catus is typically July, while January often presents the lowest earnings, highlighting opportunities for strategic pricing adjustments during shoulder and low seasons. Explore the typical Airbnb income in Catus across different performance tiers:
- Best-in-class properties (Top 10%) achieve $2,497+ monthly, often utilizing dynamic pricing and superior guest experiences.
- Strong performing properties (Top 25%) earn $1,355 or more, indicating effective management and desirable locations/amenities.
- Typical properties (Median) generate around $829 per month, representing the average market performance.
- Entry-level properties (Bottom 25%) see earnings around $446, often with potential for optimization.
Average Monthly Airbnb Earnings Trend in Catus
Catus Airbnb Occupancy Rate Trends (2025)
Maximize your bookings by understanding the Catus STR occupancy trends. Seasonal demand shifts significantly influence how often properties are booked. Typically, Augustsees the highest demand (peak season occupancy), while April experiences the lowest (low season). Effective strategies, like adjusting minimum stays or offering promotions, can boost occupancy during slower periods. Here's how different property tiers perform in Catus:
- Best-in-class properties (Top 10%) achieve 57%+ occupancy, indicating high desirability and potentially optimized availability.
- Strong performing properties (Top 25%) maintain 37% or higher occupancy, suggesting good market fit and guest satisfaction.
- Typical properties (Median) have an occupancy rate around 27%.
- Entry-level properties (Bottom 25%) average 15% occupancy, potentially facing higher vacancy.
Average Monthly Occupancy Rate Trend in Catus
Average Daily Rate (ADR) Airbnb Trends in Catus (2025)
Effective short term rental pricing strategy in Catus involves understanding monthly ADR fluctuations. The Average Daily Rate (ADR) for Airbnb in Catus typically peaks in August and dips lowest during April. Leveraging Airbnb dynamic pricing tools or strategies based on this seasonality can significantly boost revenue. Here's a look at the typical nightly rates achieved:
- Best-in-class properties (Top 10%) command rates of $179+ per night, often due to premium features or locations.
- Strong performing properties (Top 25%) achieve nightly rates of $163 or more.
- Typical properties (Median) charge around $100 per night.
- Entry-level properties (Bottom 25%) earn around $67 per night.
Average Daily Rate (ADR) Trend by Month in Catus
Get Live Catus Market Intelligence 👇

Explore Real-time Analytics
Airbnb Seasonality Analysis & Trends in Catus (2025)
Peak Season (July, August, June)
- Revenue averages $2,683 per month
- Occupancy rates average 42.9%
- Daily rates average $163
Shoulder Season
- Revenue averages $973 per month
- Occupancy maintains around 27.5%
- Daily rates hold near $154
Low Season (January, February, November)
- Revenue drops to average $571 per month
- Occupancy decreases to average 21.5%
- Daily rates adjust to average $162
Seasonality Insights for Catus
- The Airbnb seasonality in Catus shows highly seasonal trends requiring careful strategy. While the sections above show seasonal averages, it's also insightful to look at the extremes:
- During the high season, the absolute peak month showcases Catus's highest earning potential, with monthly revenues capable of climbing to $3,264, occupancy reaching a high of 54.6%, and ADRs peaking at $170.
- Conversely, the slowest single month of the year, typically falling within the low season, marks the market's lowest point. In this month, revenue might dip to $497, occupancy could drop to 17.6%, and ADRs may adjust down to $147.
- Understanding both the seasonal averages and these monthly peaks and troughs in revenue, occupancy, and ADR is crucial for maximizing your Airbnb profit potential in Catus.
Seasonal Strategies for Maximizing Profit
- Peak Season: Maximize revenue through premium pricing and potentially longer minimum stays. Ensure high availability.
- Low Season: Offer competitive pricing, special promotions (e.g., extended stay discounts), and flexible cancellation policies. Target off-season travelers like remote workers or budget-conscious guests.
- Shoulder Seasons: Implement dynamic pricing that balances peak and low rates. Target weekend travelers or specific events. Offer slightly more flexible terms than peak season.
- Regularly analyze your own performance against these Catus seasonality benchmarks and adjust your pricing and availability strategy accordingly.
Best Areas for Airbnb Investment in Catus (2025)
Exploring the top neighborhoods for short-term rentals in Catus? This section highlights key areas, outlining why they are attractive for hosts and guests, along with notable local attractions. Consider these locations based on your target guest profile and investment strategy.
| Neighborhood / Area | Why Host Here? (Target Guests & Appeal) | Key Attractions & Landmarks |
|---|---|---|
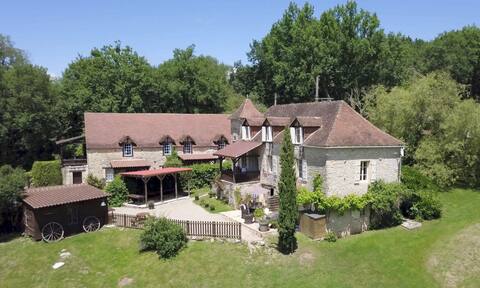
| Catus Village Center | Charming village with traditional French architecture and a close-knit community feel. Ideal for tourists seeking an authentic French countryside experience, with local shops and dining options. | Local Markets, Village square, Nearby vineyards, Cultural festivals, Scenic nature walks |
| Lac de Catus | Beautiful lake area perfect for outdoor activities such as hiking, fishing, and picnicking. Attracts families and nature lovers looking for recreational opportunities. | Lakeside trails, Fishing spots, Boat rentals, Picnic areas, Scenic viewpoints |
| Célé Valley | Stunning valley known for its natural beauty and outdoor adventures. Popular with tourists interested in hiking, cycling, and exploring picturesque landscapes. | Célé River, Hiking trails, Scenic viewpoints, Wildlife watching, Cultural heritage sites |
| Nearby Cahors | Historic city famous for its wine and medieval architecture. A great day trip option for Catus visitors, offering rich cultural experiences and wine tasting. | Cahors Vineyards, Pont Valentré, Saint-Étienne Cathedral, Cahors Market, Historic city center |
| Gourdon | A nearby medieval town offering stunning panoramic views and a rich history. Attracts visitors looking for charming streets and historical sites. | Château de Gourdon, Historic old town, Panoramic viewpoints, Local eateries, Artisan shops |
| Lot River | The picturesque river area that offers multiple opportunities for boating and exploring charming riverside towns. Great for tourists who enjoy water activities. | Boat rentals, Riverside walks, Quaint villages, Fishing spots, Relaxing picnic areas |
| Saint-Cirq-Lapopie | A stunning cliffside village, named one of the most beautiful in France. It's a magnet for art lovers and history buffs. | Historic architecture, Art galleries, Scenic viewpoints, Local crafts, River excursions |
| Market Days in Catus | Regular local markets occurring weekly, attracting visitors interested in local produce and crafts, making it a vibrant hub for both locals and tourists. | Local produce stalls, Craft vendors, Food tastings, Cultural performances, Community gatherings |
Understanding Airbnb License Requirements & STR Laws in Catus (2025)
While Catus, Occitania, France currently shows low STR regulations, specific Airbnb license requirements might still exist or change. Always verify the latest short term rental regulations and Airbnb license requirements directly with local government authorities for Catus to ensure full compliance before hosting.
(Source: AirROI data, 2025, based on 5% licensed listings)
Top Performing Airbnb Properties in Catus (2025)
Benchmark your potential! Explore examples of top-performing Airbnb properties in Catusbased on Trailing Twelve Month (TTM) revenue. Analyze their characteristics, revenue, occupancy rate, and ADR to understand what drives success in this market.
Hamlet of gites sleeps 40
Entire Place • 16 bedrooms
Renovated dovecote with garden in Catus
Entire Place • 3 bedrooms
Heated pool lodge, large garden, playgrounds
Entire Place • 3 bedrooms
Totally private house and pool, wifi leisure
Entire Place • 2 bedrooms
Heated pool cottage, extensive playground garden
Entire Place • 3 bedrooms

Furnished tent, spacious garden and heated pool
Entire Place • 3 bedrooms
Note: Performance varies based on location, size, amenities, seasonality, and management quality. Data reflects the past 12 months.
Top Performing Airbnb Hosts in Catus (2025)
Learn from the best! This table showcases top-performing Airbnb hosts in Catus based on the number of properties managed and estimated total revenue over the past year. Analyze their scale and performance metrics.
| Host Name | Properties | Grossing Revenue | Stay Reviews | Avg Rating |
|---|---|---|---|---|
| Geraldine Et Cyril | 8 | $131,595 | 57 | 4.97/5.0 |
| Sabrina | 1 | $21,641 | 15 | 4.33/5.0 |
| Sophie | 1 | $12,039 | 27 | 4.85/5.0 |
| Rt | 1 | $9,503 | 86 | 4.77/5.0 |
| Stéphanie | 2 | $8,374 | 36 | 2.47/5.0 |
| Rémi | 2 | $7,728 | 4 | 2.50/5.0 |
| Diane | 1 | $5,089 | 21 | 4.67/5.0 |
| Stéphanie & Stéphane | 1 | $4,989 | 59 | 4.90/5.0 |
| Maïté | 1 | $4,950 | 50 | 4.86/5.0 |
| Eddie | 1 | $3,835 | 16 | 5.00/5.0 |
Analyzing the strategies of top hosts, such as their property selection, pricing, and guest communication, can offer valuable lessons for optimizing your own Airbnb operations in Catus.
Dive Deeper: Advanced Catus STR Market Data (2025)
Ready to unlock more insights? AirROI provides access to advanced metrics and comprehensive Airbnb data for Catus. Explore detailed analytics beyond this report to refine your investment strategy, optimize pricing, and maximize your vacation rental profits.
Explore Advanced MetricsCatus Short-Term Rental Market Composition (2025): Property & Room Types
Room Type Distribution
Property Type Distribution
Market Composition Insights for Catus
- The Catus Airbnb market composition is heavily skewed towards Entire Home/Apt listings, which make up 80% of the 20 active rentals. This indicates strong guest preference for privacy and space.
- Looking at the property type distribution in Catus, House properties are the most common (75%), reflecting the local real estate landscape.
- Houses represent a significant 75% portion, catering likely to families or larger groups.
- The presence of 15% Hotel/Boutique listings indicates integration with traditional hospitality.
Catus Airbnb Room Capacity Analysis (2025): Bedroom Distribution
Distribution of Listings by Number of Bedrooms
Room Capacity Insights for Catus
- The dominant room capacity in Catus is 3 bedrooms listings, making up 40% of the market. This suggests a strong demand for properties suitable for families or small groups.
- Together, 3 bedrooms and 2 bedrooms properties represent 70.0% of the active Airbnb listings in Catus, indicating a high concentration in these sizes.
- A significant 45.0% of listings offer 3+ bedrooms, catering to larger groups and families seeking more space in Catus.
Catus Vacation Rental Guest Capacity Trends (2025)
Distribution of Listings by Guest Capacity
Guest Capacity Insights for Catus
- The most common guest capacity trend in Catus vacation rentals is listings accommodating 4 guests (35%). This suggests the primary traveler segment is likely small families or groups.
- Properties designed for 4 guests and 5 guests dominate the Catus STR market, accounting for 65.0% of listings.
- 15.0% of properties accommodate 6+ guests, serving the market segment for larger families or group travel in Catus.
- On average, properties in Catus are equipped to host 4.0 guests.
Catus Airbnb Booking Patterns (2025): Available vs. Booked Days
Available Days Distribution
Booked Days Distribution
Booking Pattern Insights for Catus
- The most common availability pattern in Catus falls within the 271-366 days range, representing 85% of listings. This suggests many properties have significant open periods on their calendars.
- Approximately 95.0% of listings show high availability (181+ days open annually), indicating potential for increased bookings or specific owner usage patterns.
- For booked days, the 31-90 days range is most frequent in Catus (70%), reflecting common guest stay durations or potential owner blocking patterns.
- A notable 5.0% of properties secure long booking periods (181+ days booked per year), highlighting successful long-term rental strategies or significant owner usage.
Catus Airbnb Minimum Stay Requirements Analysis
Distribution of Listings by Minimum Night Requirement
1 Night
8 listings
42.1% of total
2 Nights
6 listings
31.6% of total
3 Nights
3 listings
15.8% of total
4-6 Nights
1 listings
5.3% of total
7-29 Nights
1 listings
5.3% of total
Key Insights
- The most prevalent minimum stay requirement in Catus is 1 Night, adopted by 42.1% of listings. This highlights the market's preference for shorter, flexible bookings.
- A strong majority (73.7%) of the Catus Airbnb data shows acceptance of very short stays (1-2 nights), indicating a dynamic, high-turnover market.
Recommendations
- Align with the market by considering a 1 Night minimum stay, as 42.1% of Catus hosts use this setting.
- Adjust minimum nights based on seasonality – potentially shorter during low season and longer during peak demand periods in Catus.
Catus Airbnb Cancellation Policy Trends Analysis (2025)
Flexible
5 listings
27.8% of total
Moderate
2 listings
11.1% of total
Firm
8 listings
44.4% of total
Strict
3 listings
16.7% of total
Cancellation Policy Insights for Catus
- The prevailing Airbnb cancellation policy trend in Catus is Firm, used by 44.4% of listings.
- A majority (61.1%) of hosts in Catus utilize Firm or Strict policies, indicating a market where hosts prioritize booking security.
Recommendations for Hosts
- Consider adopting a Firm policy to align with the 44.4% market standard in Catus.
- Regularly review your cancellation policy against competitors and market demand shifts in Catus.
Catus STR Booking Lead Time Analysis (2025)
Average Booking Lead Time by Month
Booking Lead Time Insights for Catus
- The overall average booking lead time for vacation rentals in Catus is 91 days.
- Guests book furthest in advance for stays during May (average 136 days), likely coinciding with peak travel demand or local events.
- The shortest booking windows occur for stays in December (average 6 days), indicating more last-minute travel plans during this time.
- Seasonally, Summer (128 days avg.) sees the longest lead times, while Winter (21 days avg.) has the shortest, reflecting typical travel planning cycles.
Recommendations for Hosts
- Use the overall average lead time (91 days) as a baseline for your pricing and availability strategy in Catus.
- For May stays, consider implementing length-of-stay discounts or slightly higher rates for bookings made less than 136 days out to capitalize on advance planning.
- During December, focus on last-minute booking availability and promotions, as guests book with very short notice (6 days avg.).
- Target marketing efforts for the Summer season well in advance (at least 128 days) to capture early planners.
- Monitor your own booking lead times against these Catus averages to identify opportunities for dynamic pricing adjustments.
Popular & Essential Airbnb Amenities in Catus (2025)
Amenity Prevalence
Amenity Insights for Catus
- Essential amenities in Catus that guests expect include: Free parking on premises, Heating, Smoke alarm. Lacking these (any) could significantly impact bookings.
- Popular amenities like Kitchen, Refrigerator, Coffee maker are common but not universal. Offering these can provide a competitive edge.
Recommendations for Hosts
- Ensure your listing includes all essential amenities for Catus: Free parking on premises, Heating, Smoke alarm.
- Prioritize adding missing essentials: Smoke alarm.
- Consider adding popular differentiators like Kitchen or Refrigerator to increase appeal.
- Highlight unique or less common amenities you offer (e.g., hot tub, dedicated workspace, EV charger) in your listing description and photos.
- Regularly check competitor amenities in Catus to stay competitive.
Catus Airbnb Guest Demographics & Profile Analysis (2025)
Guest Profile Summary for Catus
- The typical guest profile for Airbnb in Catus consists of primarily domestic travelers (97%), often arriving from nearby Paris, typically belonging to the Post-2000s (Gen Z/Alpha) group (50%), primarily speaking French or English.
- Domestic travelers account for 97.4% of guests.
- Key international markets include France (97.4%) and Netherlands (2.6%).
- Top languages spoken are French (46.9%) followed by English (34.4%).
- A significant demographic segment is the Post-2000s (Gen Z/Alpha) group, representing 50% of guests.
Recommendations for Hosts
- Target domestic marketing efforts towards travelers from Paris and Toulouse.
- Tailor amenities and listing descriptions to appeal to the dominant Post-2000s (Gen Z/Alpha) demographic (e.g., highlight fast WiFi, smart home features, local guides).
- Highlight unique local experiences or amenities relevant to the primary guest profile.
- Consider seasonal promotions aligned with peak travel times for key origin markets.
Nearby Short-Term Rental Market Comparison
How does the Catus Airbnb market stack up against its neighbors? Compare key performance metrics like average monthly revenue, ADR, and occupancy rates in surrounding areas to understand the broader regional STR landscape.
| Market | Active Properties | Monthly Revenue | Daily Rate | Avg. Occupancy |
|---|---|---|---|---|
| Astaffort | 10 | $3,393 | $314.20 | 35% |
| Saint-Pierre-Roche | 11 | $2,627 | $166.21 | 48% |
| Eynesse | 14 | $2,564 | $282.87 | 36% |
| Bourrou | 10 | $2,475 | $247.57 | 36% |
| Saint-Jean-d'Alcapiès | 10 | $2,429 | $169.43 | 43% |
| Jayac | 11 | $2,388 | $202.75 | 40% |
| La Magdelaine-sur-Tarn | 10 | $2,383 | $243.17 | 32% |
| Lanta | 14 | $2,306 | $270.81 | 44% |
| Pont-de-Larn | 17 | $2,254 | $239.90 | 32% |
| Gout-Rossignol | 11 | $2,212 | $251.86 | 38% |