Cabrières Airbnb Market Analysis 2025: Short Term Rental Data & Vacation Rental Statistics in Occitania, France
Is Airbnb profitable in Cabrières in 2025? Explore comprehensive Airbnb analytics for Cabrières, Occitania, France to uncover income potential. This 2025 STR market report for Cabrières, based on AirROI data from April 2024 to March 2025, reveals key trends in the niche market of 29 active listings.
Whether you're considering an Airbnb investment in Cabrières, optimizing your existing vacation rental, or exploring rental arbitrage opportunities, understanding the Cabrières Airbnb data is crucial. Leveraging the low regulation environment is key to maximizing your short term rental income potential. Let's dive into the specifics.
Key Cabrières Airbnb Performance Metrics Overview
Monthly Airbnb Revenue Variations & Income Potential in Cabrières (2025)
Understanding the monthly revenue variations for Airbnb listings in Cabrières is key to maximizing your short term rental income potential. Seasonality significantly impacts earnings. Our analysis, based on data from the past 12 months, shows that the peak revenue month for STRs in Cabrières is typically August, while January often presents the lowest earnings, highlighting opportunities for strategic pricing adjustments during shoulder and low seasons. Explore the typical Airbnb income in Cabrières across different performance tiers:
- Best-in-class properties (Top 10%) achieve $3,532+ monthly, often utilizing dynamic pricing and superior guest experiences.
- Strong performing properties (Top 25%) earn $2,207 or more, indicating effective management and desirable locations/amenities.
- Typical properties (Median) generate around $1,178 per month, representing the average market performance.
- Entry-level properties (Bottom 25%) see earnings around $583, often with potential for optimization.
Average Monthly Airbnb Earnings Trend in Cabrières
Cabrières Airbnb Occupancy Rate Trends (2025)
Maximize your bookings by understanding the Cabrières STR occupancy trends. Seasonal demand shifts significantly influence how often properties are booked. Typically, Augustsees the highest demand (peak season occupancy), while January experiences the lowest (low season). Effective strategies, like adjusting minimum stays or offering promotions, can boost occupancy during slower periods. Here's how different property tiers perform in Cabrières:
- Best-in-class properties (Top 10%) achieve 70%+ occupancy, indicating high desirability and potentially optimized availability.
- Strong performing properties (Top 25%) maintain 60% or higher occupancy, suggesting good market fit and guest satisfaction.
- Typical properties (Median) have an occupancy rate around 42%.
- Entry-level properties (Bottom 25%) average 21% occupancy, potentially facing higher vacancy.
Average Monthly Occupancy Rate Trend in Cabrières
Average Daily Rate (ADR) Airbnb Trends in Cabrières (2025)
Effective short term rental pricing strategy in Cabrières involves understanding monthly ADR fluctuations. The Average Daily Rate (ADR) for Airbnb in Cabrières typically peaks in August and dips lowest during March. Leveraging Airbnb dynamic pricing tools or strategies based on this seasonality can significantly boost revenue. Here's a look at the typical nightly rates achieved:
- Best-in-class properties (Top 10%) command rates of $334+ per night, often due to premium features or locations.
- Strong performing properties (Top 25%) achieve nightly rates of $202 or more.
- Typical properties (Median) charge around $106 per night.
- Entry-level properties (Bottom 25%) earn around $65 per night.
Average Daily Rate (ADR) Trend by Month in Cabrières
Get Live Cabrières Market Intelligence 👇

Explore Real-time Analytics
Airbnb Seasonality Analysis & Trends in Cabrières (2025)
Peak Season (August, July, September)
- Revenue averages $3,344 per month
- Occupancy rates average 59.9%
- Daily rates average $176
Shoulder Season
- Revenue averages $1,270 per month
- Occupancy maintains around 38.5%
- Daily rates hold near $163
Low Season (January, February, November)
- Revenue drops to average $719 per month
- Occupancy decreases to average 28.3%
- Daily rates adjust to average $154
Seasonality Insights for Cabrières
- The Airbnb seasonality in Cabrières shows highly seasonal trends requiring careful strategy. While the sections above show seasonal averages, it's also insightful to look at the extremes:
- During the high season, the absolute peak month showcases Cabrières's highest earning potential, with monthly revenues capable of climbing to $4,463, occupancy reaching a high of 71.1%, and ADRs peaking at $179.
- Conversely, the slowest single month of the year, typically falling within the low season, marks the market's lowest point. In this month, revenue might dip to $681, occupancy could drop to 20.2%, and ADRs may adjust down to $152.
- Understanding both the seasonal averages and these monthly peaks and troughs in revenue, occupancy, and ADR is crucial for maximizing your Airbnb profit potential in Cabrières.
Seasonal Strategies for Maximizing Profit
- Peak Season: Maximize revenue through premium pricing and potentially longer minimum stays. Ensure high availability.
- Low Season: Offer competitive pricing, special promotions (e.g., extended stay discounts), and flexible cancellation policies. Target off-season travelers like remote workers or budget-conscious guests.
- Shoulder Seasons: Implement dynamic pricing that balances peak and low rates. Target weekend travelers or specific events. Offer slightly more flexible terms than peak season.
- Regularly analyze your own performance against these Cabrières seasonality benchmarks and adjust your pricing and availability strategy accordingly.
Best Areas for Airbnb Investment in Cabrières (2025)
Exploring the top neighborhoods for short-term rentals in Cabrières? This section highlights key areas, outlining why they are attractive for hosts and guests, along with notable local attractions. Consider these locations based on your target guest profile and investment strategy.
| Neighborhood / Area | Why Host Here? (Target Guests & Appeal) | Key Attractions & Landmarks |
|---|---|---|
| Cabrières Village | Charming village with historic significance, perfect for guests seeking an authentic French countryside experience. Proximity to vineyards attracts wine enthusiasts and tourists looking for relaxation. | Château de Cabrières, Vineyards and wine tasting tours, Local markets, Nature trails, Road cycling routes, Picturesque village squares |
| Pezenas | Nearby town known for its historical architecture and vibrant arts scene. A great destination for those interested in culture and history, enhancing guest experiences. | Historic Centre of Pézenas, Molière Museum, Artisan shops, Weekly markets, Eglise Saint-Jean, Cafés and restaurants |
| Agde | Coastal city with beautiful beaches, making it attractive for sun-seekers and families. The Mediterranean climate adds to its appeal for vacation rentals. | Plage de la Pinède, Cap d'Agde naturist village, Agde Cathedral, Aqualand, Canal du Midi, Water sports activities |
| Sete | Vibrant port city known for its seafood and canals, great for guests looking for an authentic French seaside experience. The cultural attractions draw in tourists. | Mont Saint-Clair, Canals of Sète, Theatre de la Mer, Fishermen's Village, Beaches, Seafood restaurants |
| Béziers | A historically rich city with a variety of cultural and historical sites. Offers a mix of urban life and proximity to nature, appealing to diverse travelers. | St. Nazaire Cathedral, Pont Canal, Plateau des Poètes, Les Allées Paul Riquet, Festivals, Wine tours |
| Mèze | Small fishing village with a laid-back atmosphere and stunning waterfront views, perfect for relaxing vacations. Known for seafood and local culture. | L'étang de Thau, Historical town center, Beaches, Local seafood restaurants, Marine activities, La Taverne du Lac |
| Saint-Guilhem-le-Désert | Picturesque medieval village and UNESCO World Heritage site. Attracts visitors interested in history, architecture, and beautiful landscapes. | Abbey of Gellone, Pont du Diable, Medieval streets, Hiking trails, Local artisan shops, Cultural events |
| Cergall | A lesser-known gem offering tranquility and natural beauty, ideal for those wanting to escape the tourist crowds and enjoy a nature retreat. | Lakes and forests, Nature hikes, Countryside trails, Local wildlife, Peaceful surroundings, Farm visits |
Understanding Airbnb License Requirements & STR Laws in Cabrières (2025)
While Cabrières, Occitania, France currently shows low STR regulations, specific Airbnb license requirements might still exist or change. Always verify the latest short term rental regulations and Airbnb license requirements directly with local government authorities for Cabrières to ensure full compliance before hosting.
(Source: AirROI data, 2025, finding no licensed listings among those analyzed)
Top Performing Airbnb Properties in Cabrières (2025)
Benchmark your potential! Explore examples of top-performing Airbnb properties in Cabrièresbased on Trailing Twelve Month (TTM) revenue. Analyze their characteristics, revenue, occupancy rate, and ADR to understand what drives success in this market.

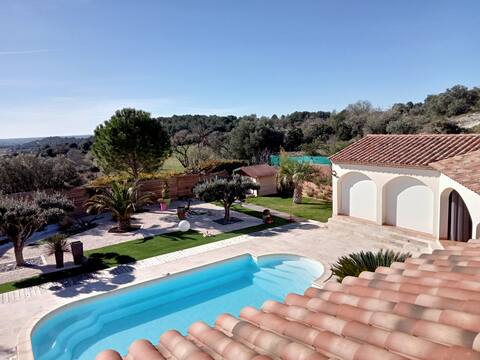
Large and beautiful villa between Uzes, Nimes and Avignon
Entire Place • 4 bedrooms

Vaulted home with private courtyard in Cabrières
Entire Place • 2 bedrooms
Garrigue villa between Nîmes and the Pont du Gard
Entire Place • 3 bedrooms

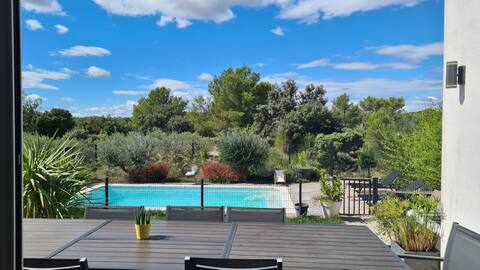
Pool villa with beautiful view
Entire Place • 4 bedrooms
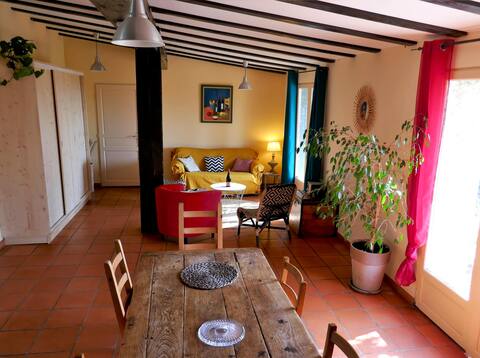
The large country house of Clos Romain.
Entire Place • 2 bedrooms
Villa en bordure de Garrigue
Entire Place • 4 bedrooms
Note: Performance varies based on location, size, amenities, seasonality, and management quality. Data reflects the past 12 months.
Top Performing Airbnb Hosts in Cabrières (2025)
Learn from the best! This table showcases top-performing Airbnb hosts in Cabrières based on the number of properties managed and estimated total revenue over the past year. Analyze their scale and performance metrics.
| Host Name | Properties | Grossing Revenue | Stay Reviews | Avg Rating |
|---|---|---|---|---|
| Julien | 1 | $49,779 | 27 | 4.70/5.0 |
| Romain | 2 | $41,597 | 153 | 4.99/5.0 |
| Sébastien | 1 | $32,197 | 58 | 4.97/5.0 |
| Celine | 2 | $31,074 | 244 | 4.96/5.0 |
| Magali | 1 | $29,671 | 12 | 4.67/5.0 |
| Christine Et Maxime | 1 | $29,279 | 87 | 4.80/5.0 |
| Host #387620215 | 1 | $22,118 | 1 | 0.00/5.0 |
| Fanny | 2 | $20,145 | 80 | 4.98/5.0 |
| Sylvie | 1 | $18,095 | 5 | 5.00/5.0 |
| Host #190571902 | 1 | $16,999 | 0 | 0.00/5.0 |
Analyzing the strategies of top hosts, such as their property selection, pricing, and guest communication, can offer valuable lessons for optimizing your own Airbnb operations in Cabrières.
Dive Deeper: Advanced Cabrières STR Market Data (2025)
Ready to unlock more insights? AirROI provides access to advanced metrics and comprehensive Airbnb data for Cabrières. Explore detailed analytics beyond this report to refine your investment strategy, optimize pricing, and maximize your vacation rental profits.
Explore Advanced MetricsCabrières Short-Term Rental Market Composition (2025): Property & Room Types
Room Type Distribution
Property Type Distribution
Market Composition Insights for Cabrières
- The Cabrières Airbnb market composition is heavily skewed towards Entire Home/Apt listings, which make up 93.1% of the 29 active rentals. This indicates strong guest preference for privacy and space.
- Looking at the property type distribution in Cabrières, House properties are the most common (58.6%), reflecting the local real estate landscape.
- Houses represent a significant 58.6% portion, catering likely to families or larger groups.
- The presence of 10.3% Hotel/Boutique listings indicates integration with traditional hospitality.
Cabrières Airbnb Room Capacity Analysis (2025): Bedroom Distribution
Distribution of Listings by Number of Bedrooms
Room Capacity Insights for Cabrières
- The dominant room capacity in Cabrières is 1 bedroom listings, making up 41.4% of the market. This suggests a strong demand for properties suitable for couples or solo travelers.
- Together, 1 bedroom and 3 bedrooms properties represent 58.6% of the active Airbnb listings in Cabrières, indicating a high concentration in these sizes.
- A significant 34.4% of listings offer 3+ bedrooms, catering to larger groups and families seeking more space in Cabrières.
Cabrières Vacation Rental Guest Capacity Trends (2025)
Distribution of Listings by Guest Capacity
Guest Capacity Insights for Cabrières
- The most common guest capacity trend in Cabrières vacation rentals is listings accommodating 2 guests (31%). This suggests the primary traveler segment is likely couples or solo travelers.
- Properties designed for 2 guests and 4 guests dominate the Cabrières STR market, accounting for 58.6% of listings.
- 34.5% of properties accommodate 6+ guests, serving the market segment for larger families or group travel in Cabrières.
- On average, properties in Cabrières are equipped to host 4.4 guests.
Cabrières Airbnb Booking Patterns (2025): Available vs. Booked Days
Available Days Distribution
Booked Days Distribution
Booking Pattern Insights for Cabrières
- The most common availability pattern in Cabrières falls within the 271-366 days range, representing 44.8% of listings. This suggests many properties have significant open periods on their calendars.
- Approximately 79.3% of listings show high availability (181+ days open annually), indicating potential for increased bookings or specific owner usage patterns.
- For booked days, the 91-180 days range is most frequent in Cabrières (41.4%), reflecting common guest stay durations or potential owner blocking patterns.
- A notable 20.7% of properties secure long booking periods (181+ days booked per year), highlighting successful long-term rental strategies or significant owner usage.
Cabrières Airbnb Minimum Stay Requirements Analysis
Distribution of Listings by Minimum Night Requirement
1 Night
7 listings
26.9% of total
2 Nights
10 listings
38.5% of total
3 Nights
2 listings
7.7% of total
4-6 Nights
4 listings
15.4% of total
7-29 Nights
3 listings
11.5% of total
Key Insights
- The most prevalent minimum stay requirement in Cabrières is 2 Nights, adopted by 38.5% of listings. This highlights the market's preference for shorter, flexible bookings.
- A strong majority (65.4%) of the Cabrières Airbnb data shows acceptance of very short stays (1-2 nights), indicating a dynamic, high-turnover market.
Recommendations
- Align with the market by considering a 2 Nights minimum stay, as 38.5% of Cabrières hosts use this setting.
- If feasible, allowing 1-night stays, especially midweek or during low season, could capture last-minute bookings, as only 26.9% currently do.
- Adjust minimum nights based on seasonality – potentially shorter during low season and longer during peak demand periods in Cabrières.
Cabrières Airbnb Cancellation Policy Trends Analysis (2025)
Flexible
7 listings
30.4% of total
Moderate
4 listings
17.4% of total
Firm
9 listings
39.1% of total
Strict
3 listings
13% of total
Cancellation Policy Insights for Cabrières
- The prevailing Airbnb cancellation policy trend in Cabrières is Firm, used by 39.1% of listings.
- A majority (52.1%) of hosts in Cabrières utilize Firm or Strict policies, indicating a market where hosts prioritize booking security.
Recommendations for Hosts
- Consider adopting a Firm policy to align with the 39.1% market standard in Cabrières.
- Using a Strict policy might deter some guests, as only 13% of listings use it. Evaluate if potential revenue protection outweighs possible lower booking rates.
- Regularly review your cancellation policy against competitors and market demand shifts in Cabrières.
Cabrières STR Booking Lead Time Analysis (2025)
Average Booking Lead Time by Month
Booking Lead Time Insights for Cabrières
- The overall average booking lead time for vacation rentals in Cabrières is 47 days.
- Guests book furthest in advance for stays during July (average 87 days), likely coinciding with peak travel demand or local events.
- The shortest booking windows occur for stays in November (average 20 days), indicating more last-minute travel plans during this time.
- Seasonally, Summer (73 days avg.) sees the longest lead times, while Winter (30 days avg.) has the shortest, reflecting typical travel planning cycles.
Recommendations for Hosts
- Use the overall average lead time (47 days) as a baseline for your pricing and availability strategy in Cabrières.
- For July stays, consider implementing length-of-stay discounts or slightly higher rates for bookings made less than 87 days out to capitalize on advance planning.
- Target marketing efforts for the Summer season well in advance (at least 73 days) to capture early planners.
- Monitor your own booking lead times against these Cabrières averages to identify opportunities for dynamic pricing adjustments.
Popular & Essential Airbnb Amenities in Cabrières (2025)
Amenity Prevalence
Amenity Insights for Cabrières
- Essential amenities in Cabrières that guests expect include: Heating, Hot water, Kitchen. Lacking these (any) could significantly impact bookings.
- Popular amenities like TV, Smoke alarm, Essentials are common but not universal. Offering these can provide a competitive edge.
- Warning: Wifi is not universally provided but is considered essential globally. Ensure reliable Wifi is offered.
Recommendations for Hosts
- Ensure your listing includes all essential amenities for Cabrières: Heating, Hot water, Kitchen.
- Prioritize adding missing essentials: Heating, Hot water, Kitchen.
- Consider adding popular differentiators like TV or Smoke alarm to increase appeal.
- Highlight unique or less common amenities you offer (e.g., hot tub, dedicated workspace, EV charger) in your listing description and photos.
- Regularly check competitor amenities in Cabrières to stay competitive.
Cabrières Airbnb Guest Demographics & Profile Analysis (2025)
Guest Profile Summary for Cabrières
- The typical guest profile for Airbnb in Cabrières consists of primarily domestic travelers (80%), often arriving from nearby Paris, typically belonging to the Post-2000s (Gen Z/Alpha) group (50%), primarily speaking French or English.
- Domestic travelers account for 79.5% of guests.
- Key international markets include France (79.5%) and Germany (4.9%).
- Top languages spoken are French (37.7%) followed by English (34.4%).
- A significant demographic segment is the Post-2000s (Gen Z/Alpha) group, representing 50% of guests.
Recommendations for Hosts
- Target domestic marketing efforts towards travelers from Paris and Lyon.
- Tailor amenities and listing descriptions to appeal to the dominant Post-2000s (Gen Z/Alpha) demographic (e.g., highlight fast WiFi, smart home features, local guides).
- Highlight unique local experiences or amenities relevant to the primary guest profile.
- Consider seasonal promotions aligned with peak travel times for key origin markets.
Nearby Short-Term Rental Market Comparison
How does the Cabrières Airbnb market stack up against its neighbors? Compare key performance metrics like average monthly revenue, ADR, and occupancy rates in surrounding areas to understand the broader regional STR landscape.
| Market | Active Properties | Monthly Revenue | Daily Rate | Avg. Occupancy |
|---|---|---|---|---|
| Villeneuvette | 13 | $4,150 | $337.56 | 44% |
| Divajeu | 19 | $3,941 | $410.65 | 42% |
| Chantepérier | 20 | $3,057 | $281.60 | 37% |
| Rupià | 11 | $3,046 | $386.95 | 40% |
| Gordes | 225 | $2,913 | $366.32 | 43% |
| Redessan | 19 | $2,834 | $334.82 | 34% |
| Fontarèches | 11 | $2,802 | $525.31 | 34% |
| Ménerbes | 97 | $2,800 | $453.86 | 41% |
| La Bruguière | 14 | $2,732 | $277.64 | 50% |
| Soyans | 12 | $2,721 | $193.55 | 45% |