Cabestany Airbnb Market Analysis 2025: Short Term Rental Data & Vacation Rental Statistics in Occitania, France
Is Airbnb profitable in Cabestany in 2025? Explore comprehensive Airbnb analytics for Cabestany, Occitania, France to uncover income potential. This 2025 STR market report for Cabestany, based on AirROI data from April 2024 to March 2025, reveals key trends in the niche market of 48 active listings.
Whether you're considering an Airbnb investment in Cabestany, optimizing your existing vacation rental, or exploring rental arbitrage opportunities, understanding the Cabestany Airbnb data is crucial. Understanding the local regulations is key to maximizing your short term rental income potential. Let's dive into the specifics.
Key Cabestany Airbnb Performance Metrics Overview
Monthly Airbnb Revenue Variations & Income Potential in Cabestany (2025)
Understanding the monthly revenue variations for Airbnb listings in Cabestany is key to maximizing your short term rental income potential. Seasonality significantly impacts earnings. Our analysis, based on data from the past 12 months, shows that the peak revenue month for STRs in Cabestany is typically August, while February often presents the lowest earnings, highlighting opportunities for strategic pricing adjustments during shoulder and low seasons. Explore the typical Airbnb income in Cabestany across different performance tiers:
- Best-in-class properties (Top 10%) achieve $3,195+ monthly, often utilizing dynamic pricing and superior guest experiences.
- Strong performing properties (Top 25%) earn $2,003 or more, indicating effective management and desirable locations/amenities.
- Typical properties (Median) generate around $986 per month, representing the average market performance.
- Entry-level properties (Bottom 25%) see earnings around $413, often with potential for optimization.
Average Monthly Airbnb Earnings Trend in Cabestany
Cabestany Airbnb Occupancy Rate Trends (2025)
Maximize your bookings by understanding the Cabestany STR occupancy trends. Seasonal demand shifts significantly influence how often properties are booked. Typically, Augustsees the highest demand (peak season occupancy), while January experiences the lowest (low season). Effective strategies, like adjusting minimum stays or offering promotions, can boost occupancy during slower periods. Here's how different property tiers perform in Cabestany:
- Best-in-class properties (Top 10%) achieve 75%+ occupancy, indicating high desirability and potentially optimized availability.
- Strong performing properties (Top 25%) maintain 55% or higher occupancy, suggesting good market fit and guest satisfaction.
- Typical properties (Median) have an occupancy rate around 30%.
- Entry-level properties (Bottom 25%) average 14% occupancy, potentially facing higher vacancy.
Average Monthly Occupancy Rate Trend in Cabestany
Average Daily Rate (ADR) Airbnb Trends in Cabestany (2025)
Effective short term rental pricing strategy in Cabestany involves understanding monthly ADR fluctuations. The Average Daily Rate (ADR) for Airbnb in Cabestany typically peaks in July and dips lowest during February. Leveraging Airbnb dynamic pricing tools or strategies based on this seasonality can significantly boost revenue. Here's a look at the typical nightly rates achieved:
- Best-in-class properties (Top 10%) command rates of $253+ per night, often due to premium features or locations.
- Strong performing properties (Top 25%) achieve nightly rates of $179 or more.
- Typical properties (Median) charge around $98 per night.
- Entry-level properties (Bottom 25%) earn around $58 per night.
Average Daily Rate (ADR) Trend by Month in Cabestany
Get Live Cabestany Market Intelligence 👇

Explore Real-time Analytics
Airbnb Seasonality Analysis & Trends in Cabestany (2025)
Peak Season (August, July, September)
- Revenue averages $2,477 per month
- Occupancy rates average 52.5%
- Daily rates average $136
Shoulder Season
- Revenue averages $1,302 per month
- Occupancy maintains around 31.3%
- Daily rates hold near $127
Low Season (January, February, March)
- Revenue drops to average $825 per month
- Occupancy decreases to average 30.2%
- Daily rates adjust to average $114
Seasonality Insights for Cabestany
- The Airbnb seasonality in Cabestany shows highly seasonal trends requiring careful strategy. While the sections above show seasonal averages, it's also insightful to look at the extremes:
- During the high season, the absolute peak month showcases Cabestany's highest earning potential, with monthly revenues capable of climbing to $3,025, occupancy reaching a high of 61.1%, and ADRs peaking at $137.
- Conversely, the slowest single month of the year, typically falling within the low season, marks the market's lowest point. In this month, revenue might dip to $651, occupancy could drop to 24.6%, and ADRs may adjust down to $113.
- Understanding both the seasonal averages and these monthly peaks and troughs in revenue, occupancy, and ADR is crucial for maximizing your Airbnb profit potential in Cabestany.
Seasonal Strategies for Maximizing Profit
- Peak Season: Maximize revenue through premium pricing and potentially longer minimum stays. Ensure high availability.
- Low Season: Offer competitive pricing, special promotions (e.g., extended stay discounts), and flexible cancellation policies. Target off-season travelers like remote workers or budget-conscious guests.
- Shoulder Seasons: Implement dynamic pricing that balances peak and low rates. Target weekend travelers or specific events. Offer slightly more flexible terms than peak season.
- Regularly analyze your own performance against these Cabestany seasonality benchmarks and adjust your pricing and availability strategy accordingly.
Best Areas for Airbnb Investment in Cabestany (2025)
Exploring the top neighborhoods for short-term rentals in Cabestany? This section highlights key areas, outlining why they are attractive for hosts and guests, along with notable local attractions. Consider these locations based on your target guest profile and investment strategy.
| Neighborhood / Area | Why Host Here? (Target Guests & Appeal) | Key Attractions & Landmarks |
|---|---|---|
| Centre-ville de Cabestany | This area features a blend of local culture and accessibility, making it appealing for visitors looking to experience authentic French life. It's close to amenities and local markets. | Cabestany Market, Église Saint-Jean-Baptiste, Parc de la Mairie, local cafes and shops |
| Côte Vermeille | Close to the Mediterranean coast, this area attracts beach lovers and offers beautiful coastal views. Ideal for families and tourists seeking sun and sand. | Plage de Saint-Cyprien, Collioure Village, Côte Vermeille beaches, water sports activities |
| Perpignan Centre | The vibrant city life of Perpignan is just a short drive away. Known for its historic sites and vibrant atmosphere, it's perfect for those wanting city convenience. | Palais des Rois de Majorque, Le Castillet, Casa de la Generalitat, local restaurants and nightlife |
| Saint-Cyprien | Another coastal town, known for its beautiful beaches and golf courses, making it a great spot for tourists looking for leisure and recreation. | Saint-Cyprien Golf Course, Les Capellans Beach, water sports centers, cultural events |
| Argelès-sur-Mer | Popular holiday destination with a picturesque beach and charming town center, ideal for tourists looking for a seaside vacation. | Argelès Beach, Port Argeles, nature parks, local festivals |
| Collioure | Famous for its artistic heritage and stunning harbor, this charming village is a favorite among tourists, especially in summer. | Collioure Beach, Château Royal de Collioure, Art galleries, local wine tasting |
| Le Barcarès | Known for its family-friendly activities and events, it offers a range of attractions that appeal to both adults and children. | Le Barcarès Beach, Lac de Salses, local markets, water parks |
| Canet-en-Roussillon | A bustling coastal town that blends a lively atmosphere with beautiful beaches, making it a great spot for summer tourism. | Canet Beach, Marina de Canet, local entertainment and bars, water activities |
Understanding Airbnb License Requirements & STR Laws in Cabestany (2025)
With 10% of listings showing registration in 2025, understanding potential Airbnb license requirements is crucial in Cabestany. Always verify the latest short term rental regulations and Airbnb license requirements directly with local government authorities for Cabestany to ensure full compliance before hosting.
(Source: AirROI data, 2025, based on 10% licensed listings)
Top Performing Airbnb Properties in Cabestany (2025)
Benchmark your potential! Explore examples of top-performing Airbnb properties in Cabestanybased on Trailing Twelve Month (TTM) revenue. Analyze their characteristics, revenue, occupancy rate, and ADR to understand what drives success in this market.

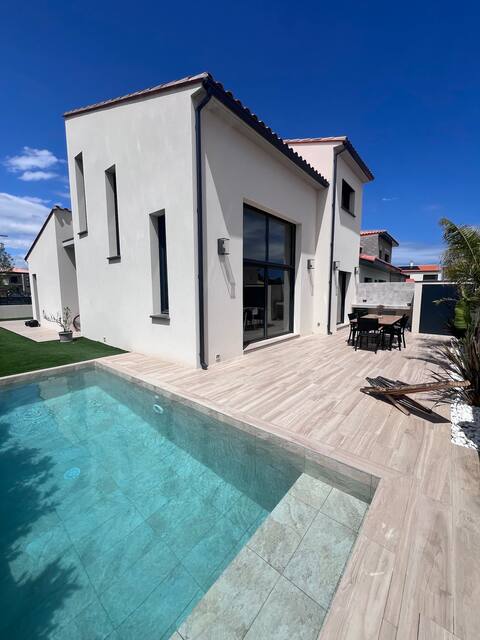
Large villa between Sea and Mountain
Entire Place • 4 bedrooms
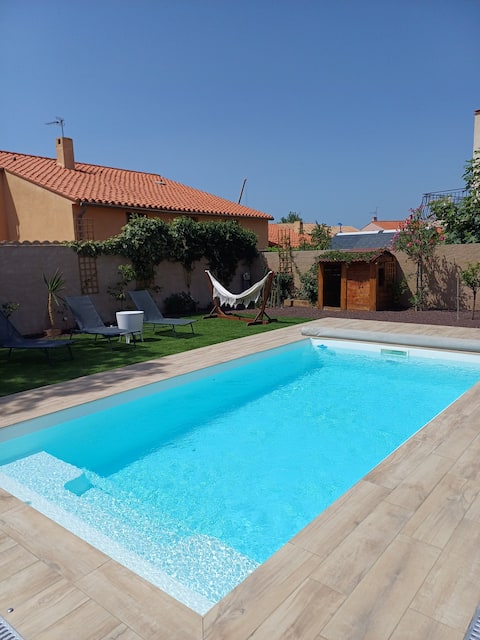
5 km from the new villa beaches with pool
Entire Place • 3 bedrooms
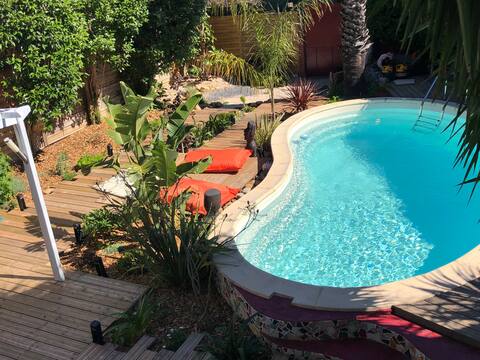
Villa with pool and pétanque court
Entire Place • 3 bedrooms
Belle Maison de village
Entire Place • 2 bedrooms

Single holiday home
Entire Place • 3 bedrooms

La Casa del Chic
Entire Place • 1 bedroom
Note: Performance varies based on location, size, amenities, seasonality, and management quality. Data reflects the past 12 months.
Top Performing Airbnb Hosts in Cabestany (2025)
Learn from the best! This table showcases top-performing Airbnb hosts in Cabestany based on the number of properties managed and estimated total revenue over the past year. Analyze their scale and performance metrics.
| Host Name | Properties | Grossing Revenue | Stay Reviews | Avg Rating |
|---|---|---|---|---|
| Geoffrey | 1 | $56,806 | 7 | 5.00/5.0 |
| Arnaud Et Nathalie | 1 | $32,030 | 7 | 4.71/5.0 |
| Caroline | 1 | $21,737 | 7 | 5.00/5.0 |
| Host #83771295 | 1 | $20,834 | 1 | 0.00/5.0 |
| Munoz | 1 | $19,451 | 28 | 4.86/5.0 |
| Julie | 1 | $19,316 | 29 | 4.97/5.0 |
| Guilllaume | 1 | $19,033 | 3 | 5.00/5.0 |
| René | 1 | $17,434 | 33 | 4.79/5.0 |
| Chloe | 1 | $16,681 | 10 | 4.30/5.0 |
| Host #105483162 | 1 | $16,304 | 0 | 0.00/5.0 |
Analyzing the strategies of top hosts, such as their property selection, pricing, and guest communication, can offer valuable lessons for optimizing your own Airbnb operations in Cabestany.
Dive Deeper: Advanced Cabestany STR Market Data (2025)
Ready to unlock more insights? AirROI provides access to advanced metrics and comprehensive Airbnb data for Cabestany. Explore detailed analytics beyond this report to refine your investment strategy, optimize pricing, and maximize your vacation rental profits.
Explore Advanced MetricsCabestany Short-Term Rental Market Composition (2025): Property & Room Types
Room Type Distribution
Property Type Distribution
Market Composition Insights for Cabestany
- The Cabestany Airbnb market composition is heavily skewed towards Entire Home/Apt listings, which make up 79.2% of the 48 active rentals. This indicates strong guest preference for privacy and space.
- Looking at the property type distribution in Cabestany, House properties are the most common (64.6%), reflecting the local real estate landscape.
- Houses represent a significant 64.6% portion, catering likely to families or larger groups.
- The presence of 8.3% Hotel/Boutique listings indicates integration with traditional hospitality.
- Smaller segments like others (combined 2.1%) offer potential for unique stay experiences.
Cabestany Airbnb Room Capacity Analysis (2025): Bedroom Distribution
Distribution of Listings by Number of Bedrooms
Room Capacity Insights for Cabestany
- The dominant room capacity in Cabestany is 3 bedrooms listings, making up 29.2% of the market. This suggests a strong demand for properties suitable for families or small groups.
- Together, 3 bedrooms and 1 bedroom properties represent 58.4% of the active Airbnb listings in Cabestany, indicating a high concentration in these sizes.
- A significant 37.6% of listings offer 3+ bedrooms, catering to larger groups and families seeking more space in Cabestany.
Cabestany Vacation Rental Guest Capacity Trends (2025)
Distribution of Listings by Guest Capacity
Guest Capacity Insights for Cabestany
- The most common guest capacity trend in Cabestany vacation rentals is listings accommodating 4 guests (27.1%). This suggests the primary traveler segment is likely small families or groups.
- Properties designed for 4 guests and 2 guests dominate the Cabestany STR market, accounting for 50.0% of listings.
- 22.9% of properties accommodate 6+ guests, serving the market segment for larger families or group travel in Cabestany.
- On average, properties in Cabestany are equipped to host 3.6 guests.
Cabestany Airbnb Booking Patterns (2025): Available vs. Booked Days
Available Days Distribution
Booked Days Distribution
Booking Pattern Insights for Cabestany
- The most common availability pattern in Cabestany falls within the 271-366 days range, representing 56.3% of listings. This suggests many properties have significant open periods on their calendars.
- Approximately 87.6% of listings show high availability (181+ days open annually), indicating potential for increased bookings or specific owner usage patterns.
- For booked days, the 1-30 days range is most frequent in Cabestany (35.4%), reflecting common guest stay durations or potential owner blocking patterns.
- A notable 12.5% of properties secure long booking periods (181+ days booked per year), highlighting successful long-term rental strategies or significant owner usage.
Cabestany Airbnb Minimum Stay Requirements Analysis
Distribution of Listings by Minimum Night Requirement
1 Night
9 listings
20% of total
2 Nights
16 listings
35.6% of total
3 Nights
6 listings
13.3% of total
4-6 Nights
6 listings
13.3% of total
7-29 Nights
5 listings
11.1% of total
30+ Nights
3 listings
6.7% of total
Key Insights
- The most prevalent minimum stay requirement in Cabestany is 2 Nights, adopted by 35.6% of listings. This highlights the market's preference for shorter, flexible bookings.
Recommendations
- Align with the market by considering a 2 Nights minimum stay, as 35.6% of Cabestany hosts use this setting.
- If feasible, allowing 1-night stays, especially midweek or during low season, could capture last-minute bookings, as only 20% currently do.
- Explore offering discounts for stays of 30+ nights to attract the 6.7% of the market seeking extended stays.
- Adjust minimum nights based on seasonality – potentially shorter during low season and longer during peak demand periods in Cabestany.
Cabestany Airbnb Cancellation Policy Trends Analysis (2025)
Flexible
12 listings
30.8% of total
Moderate
12 listings
30.8% of total
Firm
8 listings
20.5% of total
Strict
7 listings
17.9% of total
Cancellation Policy Insights for Cabestany
- The prevailing Airbnb cancellation policy trend in Cabestany is Flexible, used by 30.8% of listings.
- There's a relatively balanced mix between guest-friendly (61.6%) and stricter (38.4%) policies, offering choices for different guest needs.
Recommendations for Hosts
- Consider adopting a Flexible policy to align with the 30.8% market standard in Cabestany.
- Regularly review your cancellation policy against competitors and market demand shifts in Cabestany.
Cabestany STR Booking Lead Time Analysis (2025)
Average Booking Lead Time by Month
Booking Lead Time Insights for Cabestany
- The overall average booking lead time for vacation rentals in Cabestany is 41 days.
- Guests book furthest in advance for stays during June (average 79 days), likely coinciding with peak travel demand or local events.
- The shortest booking windows occur for stays in February (average 12 days), indicating more last-minute travel plans during this time.
- Seasonally, Summer (71 days avg.) sees the longest lead times, while Spring (36 days avg.) has the shortest, reflecting typical travel planning cycles.
Recommendations for Hosts
- Use the overall average lead time (41 days) as a baseline for your pricing and availability strategy in Cabestany.
- For June stays, consider implementing length-of-stay discounts or slightly higher rates for bookings made less than 79 days out to capitalize on advance planning.
- During February, focus on last-minute booking availability and promotions, as guests book with very short notice (12 days avg.).
- Target marketing efforts for the Summer season well in advance (at least 71 days) to capture early planners.
- Monitor your own booking lead times against these Cabestany averages to identify opportunities for dynamic pricing adjustments.
Popular & Essential Airbnb Amenities in Cabestany (2025)
Amenity Prevalence
Amenity Insights for Cabestany
- Essential amenities in Cabestany that guests expect include: Wifi. Lacking these (this) could significantly impact bookings.
- Popular amenities like Heating, Hot water, TV are common but not universal. Offering these can provide a competitive edge.
Recommendations for Hosts
- Ensure your listing includes all essential amenities for Cabestany: Wifi.
- Prioritize adding missing essentials: Wifi.
- Consider adding popular differentiators like Heating or Hot water to increase appeal.
- Highlight unique or less common amenities you offer (e.g., hot tub, dedicated workspace, EV charger) in your listing description and photos.
- Regularly check competitor amenities in Cabestany to stay competitive.
Cabestany Airbnb Guest Demographics & Profile Analysis (2025)
Guest Profile Summary for Cabestany
- The typical guest profile for Airbnb in Cabestany consists of primarily domestic travelers (81%), often arriving from nearby Perpignan, typically belonging to the Post-2000s (Gen Z/Alpha) group (50%), primarily speaking French or English.
- Domestic travelers account for 81.2% of guests.
- Key international markets include France (81.2%) and Spain (4.6%).
- Top languages spoken are French (43%) followed by English (30.2%).
- A significant demographic segment is the Post-2000s (Gen Z/Alpha) group, representing 50% of guests.
Recommendations for Hosts
- Target domestic marketing efforts towards travelers from Perpignan and Barcelona.
- Tailor amenities and listing descriptions to appeal to the dominant Post-2000s (Gen Z/Alpha) demographic (e.g., highlight fast WiFi, smart home features, local guides).
- Highlight unique local experiences or amenities relevant to the primary guest profile.
- Consider seasonal promotions aligned with peak travel times for key origin markets.
Nearby Short-Term Rental Market Comparison
How does the Cabestany Airbnb market stack up against its neighbors? Compare key performance metrics like average monthly revenue, ADR, and occupancy rates in surrounding areas to understand the broader regional STR landscape.
| Market | Active Properties | Monthly Revenue | Daily Rate | Avg. Occupancy |
|---|---|---|---|---|
| Vall-llobrega | 15 | $10,261 | $798.88 | 44% |
| Canyelles | 49 | $5,958 | $1023.94 | 37% |
| Arenys de Munt | 28 | $5,100 | $514.27 | 41% |
| Teià | 25 | $5,027 | $348.45 | 45% |
| Cornellà del Terri | 17 | $4,960 | $460.96 | 41% |
| Tiana | 12 | $4,955 | $299.97 | 48% |
| Amer | 10 | $4,848 | $397.58 | 40% |
| Bescanó | 11 | $4,761 | $445.38 | 41% |
| Porqueres | 12 | $4,714 | $469.05 | 36% |
| Premià de Dalt | 28 | $4,630 | $345.43 | 49% |