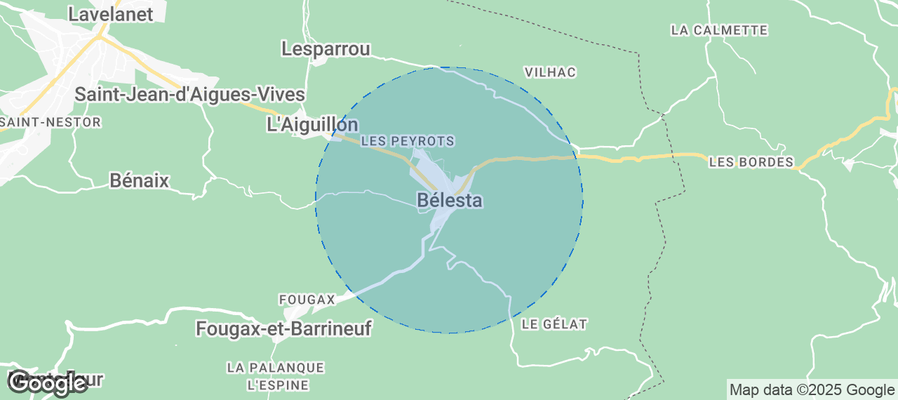
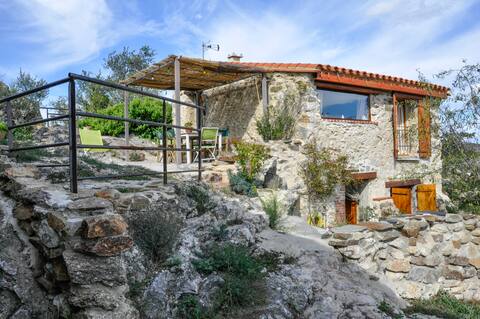
Bélesta Airbnb Market Analysis 2025: Short Term Rental Data & Vacation Rental Statistics in Occitania, France
Is Airbnb profitable in Bélesta in 2025? Explore comprehensive Airbnb analytics for Bélesta, Occitania, France to uncover income potential. This 2025 STR market report for Bélesta, based on AirROI data from April 2024 to March 2025, reveals key trends in the niche market of 31 active listings.
Whether you're considering an Airbnb investment in Bélesta, optimizing your existing vacation rental, or exploring rental arbitrage opportunities, understanding the Bélesta Airbnb data is crucial. Leveraging the low regulation environment is key to maximizing your short term rental income potential. Let's dive into the specifics.
Key Bélesta Airbnb Performance Metrics Overview
Monthly Airbnb Revenue Variations & Income Potential in Bélesta (2025)
Understanding the monthly revenue variations for Airbnb listings in Bélesta is key to maximizing your short term rental income potential. Seasonality significantly impacts earnings. Our analysis, based on data from the past 12 months, shows that the peak revenue month for STRs in Bélesta is typically August, while January often presents the lowest earnings, highlighting opportunities for strategic pricing adjustments during shoulder and low seasons. Explore the typical Airbnb income in Bélesta across different performance tiers:
- Best-in-class properties (Top 10%) achieve $2,612+ monthly, often utilizing dynamic pricing and superior guest experiences.
- Strong performing properties (Top 25%) earn $1,564 or more, indicating effective management and desirable locations/amenities.
- Typical properties (Median) generate around $900 per month, representing the average market performance.
- Entry-level properties (Bottom 25%) see earnings around $390, often with potential for optimization.
Average Monthly Airbnb Earnings Trend in Bélesta
Bélesta Airbnb Occupancy Rate Trends (2025)
Maximize your bookings by understanding the Bélesta STR occupancy trends. Seasonal demand shifts significantly influence how often properties are booked. Typically, Augustsees the highest demand (peak season occupancy), while June experiences the lowest (low season). Effective strategies, like adjusting minimum stays or offering promotions, can boost occupancy during slower periods. Here's how different property tiers perform in Bélesta:
- Best-in-class properties (Top 10%) achieve 76%+ occupancy, indicating high desirability and potentially optimized availability.
- Strong performing properties (Top 25%) maintain 48% or higher occupancy, suggesting good market fit and guest satisfaction.
- Typical properties (Median) have an occupancy rate around 24%.
- Entry-level properties (Bottom 25%) average 11% occupancy, potentially facing higher vacancy.
Average Monthly Occupancy Rate Trend in Bélesta
Average Daily Rate (ADR) Airbnb Trends in Bélesta (2025)
Effective short term rental pricing strategy in Bélesta involves understanding monthly ADR fluctuations. The Average Daily Rate (ADR) for Airbnb in Bélesta typically peaks in August and dips lowest during March. Leveraging Airbnb dynamic pricing tools or strategies based on this seasonality can significantly boost revenue. Here's a look at the typical nightly rates achieved:
- Best-in-class properties (Top 10%) command rates of $285+ per night, often due to premium features or locations.
- Strong performing properties (Top 25%) achieve nightly rates of $129 or more.
- Typical properties (Median) charge around $85 per night.
- Entry-level properties (Bottom 25%) earn around $64 per night.
Average Daily Rate (ADR) Trend by Month in Bélesta
Get Live Bélesta Market Intelligence 👇
Explore Real-time Analytics
Airbnb Seasonality Analysis & Trends in Bélesta (2025)
Peak Season (August, July, May)
- Revenue averages $1,682 per month
- Occupancy rates average 41.7%
- Daily rates average $143
Shoulder Season
- Revenue averages $1,115 per month
- Occupancy maintains around 30.6%
- Daily rates hold near $121
Low Season (January, March, December)
- Revenue drops to average $603 per month
- Occupancy decreases to average 27.7%
- Daily rates adjust to average $86
Seasonality Insights for Bélesta
- The Airbnb seasonality in Bélesta shows highly seasonal trends requiring careful strategy. While the sections above show seasonal averages, it's also insightful to look at the extremes:
- During the high season, the absolute peak month showcases Bélesta's highest earning potential, with monthly revenues capable of climbing to $1,834, occupancy reaching a high of 53.2%, and ADRs peaking at $144.
- Conversely, the slowest single month of the year, typically falling within the low season, marks the market's lowest point. In this month, revenue might dip to $558, occupancy could drop to 23.1%, and ADRs may adjust down to $86.
- Understanding both the seasonal averages and these monthly peaks and troughs in revenue, occupancy, and ADR is crucial for maximizing your Airbnb profit potential in Bélesta.
Seasonal Strategies for Maximizing Profit
- Peak Season: Maximize revenue through premium pricing and potentially longer minimum stays. Ensure high availability.
- Low Season: Offer competitive pricing, special promotions (e.g., extended stay discounts), and flexible cancellation policies. Target off-season travelers like remote workers or budget-conscious guests.
- Shoulder Seasons: Implement dynamic pricing that balances peak and low rates. Target weekend travelers or specific events. Offer slightly more flexible terms than peak season.
- Regularly analyze your own performance against these Bélesta seasonality benchmarks and adjust your pricing and availability strategy accordingly.
Best Areas for Airbnb Investment in Bélesta (2025)
Exploring the top neighborhoods for short-term rentals in Bélesta? This section highlights key areas, outlining why they are attractive for hosts and guests, along with notable local attractions. Consider these locations based on your target guest profile and investment strategy.
| Neighborhood / Area | Why Host Here? (Target Guests & Appeal) | Key Attractions & Landmarks |
|---|---|---|
| Bélesta Village Center | Charming village with authentic French culture and proximity to local attractions. Ideal for guests seeking a peaceful retreat in the heart of Occitania. | Bélesta Church, Local Markets, Vineyards nearby, Walking Trails, Scenic Views of the Pyrenees |
| Lake Montbel | Beautiful natural area perfect for outdoor activities such as hiking, swimming, and picnicking. Attracts nature lovers and families looking for outdoor adventures. | Montbel Lake, Hiking Trails, Picnic Areas, Fishing Spots, Water Sports Opportunities |
| Foix | Historic town with a medieval castle and rich history. Great for tourists interested in culture, history, and exploring the surrounding countryside. | Foix Castle, Arthur's Cave, Old Town, Local Restaurants, Outdoor Festivals |
| Carcassonne | Famous for its medieval fortress and UNESCO World Heritage status. A major tourist destination providing plenty of sightseeing opportunities. | Cité de Carcassonne, Castle and Ramparts, Canal du Midi, Local Wine Tasting, Historical Tours |
| Peyrepertuse Castle | An impressive medieval castle offering stunning views of the surrounding landscape. Attracts history buffs and hikers. | Peyrepertuse Castle, Guided Tours, Hiking Paths, Archaeological Sites, Breathtaking Scenery |
| Limoux | Known for its sparkling wine and vibrant atmosphere. Great for wine enthusiasts and those looking to explore the local gastronomy. | Limoux Wine Cellars, Local Festivals, Historical Sites, Cafes and Bistros, Outdoor Markets |
| Château de Montségur | Historic site linked to the Cathar history, offering cultural and educational experiences. Attracts visitors interested in history and hiking. | Montségur Castle, Hiking Trails to the Castle, Cultural Tours, Scenic Views, Historical Significance |
| Ax-les-Thermes | A well-known ski resort and thermal spa destination, popular for winter sports and relaxation. Appeals to both winter sports enthusiasts and spa-goers. | Ski Resorts, Thermal Baths, Hiking Opportunities, Local Restaurants, Winter Festivals |
Understanding Airbnb License Requirements & STR Laws in Bélesta (2025)
While Bélesta, Occitania, France currently shows low STR regulations, specific Airbnb license requirements might still exist or change. Always verify the latest short term rental regulations and Airbnb license requirements directly with local government authorities for Bélesta to ensure full compliance before hosting.
(Source: AirROI data, 2025, based on 3% licensed listings)
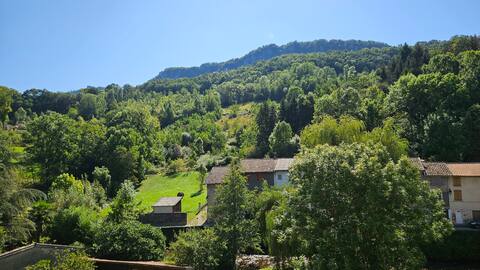
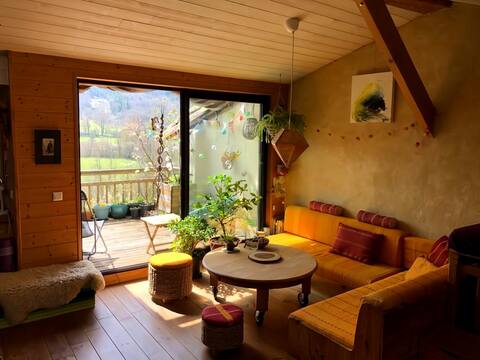
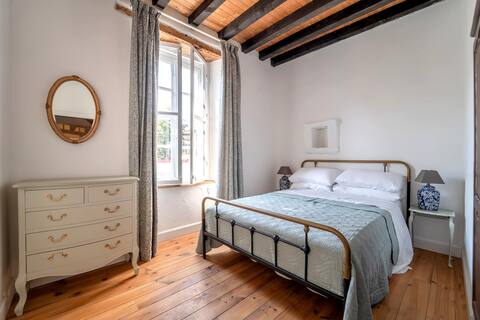
Top Performing Airbnb Properties in Bélesta (2025)
Benchmark your potential! Explore examples of top-performing Airbnb properties in Bélestabased on Trailing Twelve Month (TTM) revenue. Analyze their characteristics, revenue, occupancy rate, and ADR to understand what drives success in this market.
Casa Isaura, home classified 3*
Entire Place • 2 bedrooms
A small haven of peace in Cathar country
Entire Place • 2 bedrooms
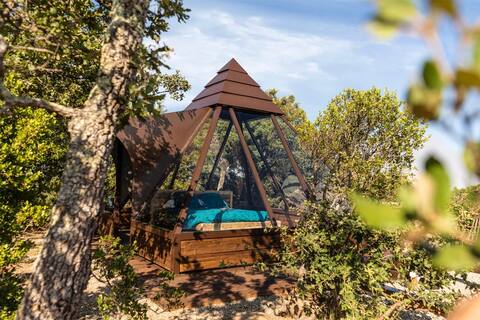
Pyramid in the heart of scrubland-mas berrugues
Entire Place • 1 bedroom
Wilderness character french cottage
Entire Place • 2 bedrooms
Light and airy 4 bedroom village house.
Entire Place • 4 bedrooms

House in the heart of a village, mountain views
Entire Place • 2 bedrooms
Note: Performance varies based on location, size, amenities, seasonality, and management quality. Data reflects the past 12 months.
Top Performing Airbnb Hosts in Bélesta (2025)
Learn from the best! This table showcases top-performing Airbnb hosts in Bélesta based on the number of properties managed and estimated total revenue over the past year. Analyze their scale and performance metrics.
| Host Name | Properties | Grossing Revenue | Stay Reviews | Avg Rating |
|---|---|---|---|---|
| Karine | 2 | $30,928 | 74 | 4.93/5.0 |
| Henri Et Delphine | 1 | $21,324 | 18 | 4.94/5.0 |
| Natacha | 1 | $20,612 | 165 | 4.99/5.0 |
| M&Mme Bekheira | 1 | $18,424 | 100 | 4.89/5.0 |
| Hannah | 1 | $15,712 | 19 | 5.00/5.0 |
| Patrice | 2 | $14,333 | 84 | 4.47/5.0 |
| Rémy | 1 | $13,828 | 11 | 5.00/5.0 |
| Maison Du Château | 1 | $13,574 | 11 | 4.73/5.0 |
| Raymond Et Brigitte | 2 | $12,840 | 15 | 5.00/5.0 |
| Host #131342190 | 1 | $12,778 | 0 | 0.00/5.0 |
Analyzing the strategies of top hosts, such as their property selection, pricing, and guest communication, can offer valuable lessons for optimizing your own Airbnb operations in Bélesta.
Dive Deeper: Advanced Bélesta STR Market Data (2025)
Ready to unlock more insights? AirROI provides access to advanced metrics and comprehensive Airbnb data for Bélesta. Explore detailed analytics beyond this report to refine your investment strategy, optimize pricing, and maximize your vacation rental profits.
Explore Advanced MetricsBélesta Short-Term Rental Market Composition (2025): Property & Room Types
Room Type Distribution
Property Type Distribution
Market Composition Insights for Bélesta
- The Bélesta Airbnb market composition is heavily skewed towards Entire Home/Apt listings, which make up 96.8% of the 31 active rentals. This indicates strong guest preference for privacy and space.
- Looking at the property type distribution in Bélesta, House properties are the most common (58.1%), reflecting the local real estate landscape.
- Houses represent a significant 58.1% portion, catering likely to families or larger groups.
- Smaller segments like hotel/boutique, others (combined 6.4%) offer potential for unique stay experiences.
Bélesta Airbnb Room Capacity Analysis (2025): Bedroom Distribution
Distribution of Listings by Number of Bedrooms
Room Capacity Insights for Bélesta
- The dominant room capacity in Bélesta is 2 bedrooms listings, making up 51.6% of the market. This suggests a strong demand for properties suitable for couples or solo travelers.
- Together, 2 bedrooms and 1 bedroom properties represent 77.4% of the active Airbnb listings in Bélesta, indicating a high concentration in these sizes.
Bélesta Vacation Rental Guest Capacity Trends (2025)
Distribution of Listings by Guest Capacity
Guest Capacity Insights for Bélesta
- The most common guest capacity trend in Bélesta vacation rentals is listings accommodating 4 guests (25.8%). This suggests the primary traveler segment is likely small families or groups.
- Properties designed for 4 guests and 2 guests dominate the Bélesta STR market, accounting for 51.6% of listings.
- 35.5% of properties accommodate 6+ guests, serving the market segment for larger families or group travel in Bélesta.
- On average, properties in Bélesta are equipped to host 4.5 guests.
Bélesta Airbnb Booking Patterns (2025): Available vs. Booked Days
Available Days Distribution
Booked Days Distribution
Booking Pattern Insights for Bélesta
- The most common availability pattern in Bélesta falls within the 271-366 days range, representing 61.3% of listings. This suggests many properties have significant open periods on their calendars.
- Approximately 90.3% of listings show high availability (181+ days open annually), indicating potential for increased bookings or specific owner usage patterns.
- For booked days, the 31-90 days range is most frequent in Bélesta (41.9%), reflecting common guest stay durations or potential owner blocking patterns.
- A notable 9.7% of properties secure long booking periods (181+ days booked per year), highlighting successful long-term rental strategies or significant owner usage.
Bélesta Airbnb Minimum Stay Requirements Analysis
Distribution of Listings by Minimum Night Requirement
1 Night
7 listings
24.1% of total
2 Nights
12 listings
41.4% of total
3 Nights
5 listings
17.2% of total
4-6 Nights
5 listings
17.2% of total
Key Insights
- The most prevalent minimum stay requirement in Bélesta is 2 Nights, adopted by 41.4% of listings. This highlights the market's preference for shorter, flexible bookings.
- A strong majority (65.5%) of the Bélesta Airbnb data shows acceptance of very short stays (1-2 nights), indicating a dynamic, high-turnover market.
Recommendations
- Align with the market by considering a 2 Nights minimum stay, as 41.4% of Bélesta hosts use this setting.
- If feasible, allowing 1-night stays, especially midweek or during low season, could capture last-minute bookings, as only 24.1% currently do.
- Adjust minimum nights based on seasonality – potentially shorter during low season and longer during peak demand periods in Bélesta.
Bélesta Airbnb Cancellation Policy Trends Analysis (2025)
Flexible
6 listings
23.1% of total
Moderate
6 listings
23.1% of total
Firm
7 listings
26.9% of total
Strict
7 listings
26.9% of total
Cancellation Policy Insights for Bélesta
- The prevailing Airbnb cancellation policy trend in Bélesta is Firm, used by 26.9% of listings.
- A majority (53.8%) of hosts in Bélesta utilize Firm or Strict policies, indicating a market where hosts prioritize booking security.
Recommendations for Hosts
- Consider adopting a Firm policy to align with the 26.9% market standard in Bélesta.
- Regularly review your cancellation policy against competitors and market demand shifts in Bélesta.
Bélesta STR Booking Lead Time Analysis (2025)
Average Booking Lead Time by Month
Booking Lead Time Insights for Bélesta
- The overall average booking lead time for vacation rentals in Bélesta is 50 days.
- Guests book furthest in advance for stays during May (average 89 days), likely coinciding with peak travel demand or local events.
- The shortest booking windows occur for stays in February (average 23 days), indicating more last-minute travel plans during this time.
- Seasonally, Summer (72 days avg.) sees the longest lead times, while Winter (34 days avg.) has the shortest, reflecting typical travel planning cycles.
Recommendations for Hosts
- Use the overall average lead time (50 days) as a baseline for your pricing and availability strategy in Bélesta.
- For May stays, consider implementing length-of-stay discounts or slightly higher rates for bookings made less than 89 days out to capitalize on advance planning.
- Target marketing efforts for the Summer season well in advance (at least 72 days) to capture early planners.
- Monitor your own booking lead times against these Bélesta averages to identify opportunities for dynamic pricing adjustments.
Popular & Essential Airbnb Amenities in Bélesta (2025)
Amenity Prevalence
Amenity Insights for Bélesta
- Popular amenities like Hot water, Heating, Kitchen are common but not universal. Offering these can provide a competitive edge.
- Warning: Wifi is not universally provided but is considered essential globally. Ensure reliable Wifi is offered.
Recommendations for Hosts
- Consider adding popular differentiators like Hot water or Heating to increase appeal.
- Highlight unique or less common amenities you offer (e.g., hot tub, dedicated workspace, EV charger) in your listing description and photos.
- Regularly check competitor amenities in Bélesta to stay competitive.
Bélesta Airbnb Guest Demographics & Profile Analysis (2025)
Guest Profile Summary for Bélesta
- The typical guest profile for Airbnb in Bélesta consists of primarily domestic travelers (68%), often arriving from nearby Toulouse, typically belonging to the Post-2000s (Gen Z/Alpha) group (50%), primarily speaking English or French.
- Domestic travelers account for 68.4% of guests.
- Key international markets include France (68.4%) and Spain (7.5%).
- Top languages spoken are English (37.4%) followed by French (33.1%).
- A significant demographic segment is the Post-2000s (Gen Z/Alpha) group, representing 50% of guests.
Recommendations for Hosts
- Target domestic marketing efforts towards travelers from Toulouse and Barcelona.
- Tailor amenities and listing descriptions to appeal to the dominant Post-2000s (Gen Z/Alpha) demographic (e.g., highlight fast WiFi, smart home features, local guides).
- Highlight unique local experiences or amenities relevant to the primary guest profile.
- Consider seasonal promotions aligned with peak travel times for key origin markets.
Nearby Short-Term Rental Market Comparison
How does the Bélesta Airbnb market stack up against its neighbors? Compare key performance metrics like average monthly revenue, ADR, and occupancy rates in surrounding areas to understand the broader regional STR landscape.
| Market | Active Properties | Monthly Revenue | Daily Rate | Avg. Occupancy |
|---|---|---|---|---|
| Vall-llobrega | 15 | $10,261 | $798.88 | 44% |
| Canyelles | 49 | $5,958 | $1023.94 | 37% |
| Arenys de Munt | 28 | $5,100 | $514.27 | 41% |
| Teià | 25 | $5,027 | $348.45 | 45% |
| Cornellà del Terri | 17 | $4,960 | $460.96 | 41% |
| Tiana | 12 | $4,955 | $299.97 | 48% |
| Amer | 10 | $4,848 | $397.58 | 40% |
| Bescanó | 11 | $4,761 | $445.38 | 41% |
| Porqueres | 12 | $4,714 | $469.05 | 36% |
| Premià de Dalt | 28 | $4,630 | $345.43 | 49% |