Bourisp Airbnb Market Analysis 2025: Short Term Rental Data & Vacation Rental Statistics in Occitania, France
Is Airbnb profitable in Bourisp in 2025? Explore comprehensive Airbnb analytics for Bourisp, Occitania, France to uncover income potential. This 2025 STR market report for Bourisp, based on AirROI data from April 2024 to March 2025, reveals key trends in the niche market of 24 active listings.
Whether you're considering an Airbnb investment in Bourisp, optimizing your existing vacation rental, or exploring rental arbitrage opportunities, understanding the Bourisp Airbnb data is crucial. Leveraging the low regulation environment is key to maximizing your short term rental income potential. Let's dive into the specifics.
Key Bourisp Airbnb Performance Metrics Overview
Monthly Airbnb Revenue Variations & Income Potential in Bourisp (2025)
Understanding the monthly revenue variations for Airbnb listings in Bourisp is key to maximizing your short term rental income potential. Seasonality significantly impacts earnings. Our analysis, based on data from the past 12 months, shows that the peak revenue month for STRs in Bourisp is typically February, while September often presents the lowest earnings, highlighting opportunities for strategic pricing adjustments during shoulder and low seasons. Explore the typical Airbnb income in Bourisp across different performance tiers:
- Best-in-class properties (Top 10%) achieve $4,775+ monthly, often utilizing dynamic pricing and superior guest experiences.
- Strong performing properties (Top 25%) earn $2,112 or more, indicating effective management and desirable locations/amenities.
- Typical properties (Median) generate around $957 per month, representing the average market performance.
- Entry-level properties (Bottom 25%) see earnings around $521, often with potential for optimization.
Average Monthly Airbnb Earnings Trend in Bourisp
Bourisp Airbnb Occupancy Rate Trends (2025)
Maximize your bookings by understanding the Bourisp STR occupancy trends. Seasonal demand shifts significantly influence how often properties are booked. Typically, Februarysees the highest demand (peak season occupancy), while June experiences the lowest (low season). Effective strategies, like adjusting minimum stays or offering promotions, can boost occupancy during slower periods. Here's how different property tiers perform in Bourisp:
- Best-in-class properties (Top 10%) achieve 61%+ occupancy, indicating high desirability and potentially optimized availability.
- Strong performing properties (Top 25%) maintain 41% or higher occupancy, suggesting good market fit and guest satisfaction.
- Typical properties (Median) have an occupancy rate around 25%.
- Entry-level properties (Bottom 25%) average 13% occupancy, potentially facing higher vacancy.
Average Monthly Occupancy Rate Trend in Bourisp
Average Daily Rate (ADR) Airbnb Trends in Bourisp (2025)
Effective short term rental pricing strategy in Bourisp involves understanding monthly ADR fluctuations. The Average Daily Rate (ADR) for Airbnb in Bourisp typically peaks in February and dips lowest during June. Leveraging Airbnb dynamic pricing tools or strategies based on this seasonality can significantly boost revenue. Here's a look at the typical nightly rates achieved:
- Best-in-class properties (Top 10%) command rates of $353+ per night, often due to premium features or locations.
- Strong performing properties (Top 25%) achieve nightly rates of $200 or more.
- Typical properties (Median) charge around $137 per night.
- Entry-level properties (Bottom 25%) earn around $91 per night.
Average Daily Rate (ADR) Trend by Month in Bourisp
Get Live Bourisp Market Intelligence 👇

Explore Real-time Analytics
Airbnb Seasonality Analysis & Trends in Bourisp (2025)
Peak Season (February, December, August)
- Revenue averages $2,889 per month
- Occupancy rates average 44.0%
- Daily rates average $199
Shoulder Season
- Revenue averages $1,817 per month
- Occupancy maintains around 28.3%
- Daily rates hold near $180
Low Season (May, June, September)
- Revenue drops to average $1,282 per month
- Occupancy decreases to average 21.3%
- Daily rates adjust to average $155
Seasonality Insights for Bourisp
- The Airbnb seasonality in Bourisp shows highly seasonal trends requiring careful strategy. While the sections above show seasonal averages, it's also insightful to look at the extremes:
- During the high season, the absolute peak month showcases Bourisp's highest earning potential, with monthly revenues capable of climbing to $3,611, occupancy reaching a high of 52.7%, and ADRs peaking at $223.
- Conversely, the slowest single month of the year, typically falling within the low season, marks the market's lowest point. In this month, revenue might dip to $1,169, occupancy could drop to 17.7%, and ADRs may adjust down to $154.
- Understanding both the seasonal averages and these monthly peaks and troughs in revenue, occupancy, and ADR is crucial for maximizing your Airbnb profit potential in Bourisp.
Seasonal Strategies for Maximizing Profit
- Peak Season: Maximize revenue through premium pricing and potentially longer minimum stays. Ensure high availability.
- Low Season: Offer competitive pricing, special promotions (e.g., extended stay discounts), and flexible cancellation policies. Target off-season travelers like remote workers or budget-conscious guests.
- Shoulder Seasons: Implement dynamic pricing that balances peak and low rates. Target weekend travelers or specific events. Offer slightly more flexible terms than peak season.
- Regularly analyze your own performance against these Bourisp seasonality benchmarks and adjust your pricing and availability strategy accordingly.
Best Areas for Airbnb Investment in Bourisp (2025)
Exploring the top neighborhoods for short-term rentals in Bourisp? This section highlights key areas, outlining why they are attractive for hosts and guests, along with notable local attractions. Consider these locations based on your target guest profile and investment strategy.
| Neighborhood / Area | Why Host Here? (Target Guests & Appeal) | Key Attractions & Landmarks |
|---|---|---|
| Bourisp Village | Charming village located in the Pyrenees, offering a peaceful atmosphere and close proximity to nature. Ideal for travelers looking for relaxation and outdoor activities. | Skiing in Saint-Lary-Soulan, Hiking trails in the Pyrenees, Lakes of Aure, Local restaurants and gastronomy, Historical architecture |
| Saint-Lary-Soulan | Popular ski resort nearby with a vibrant après-ski scene. Attracts winter sports enthusiasts and families looking for fun in the snow. | Peyragudes Ski Resort, Thermal baths, Cable car to the slopes, Shops and local markets, Winter sports activities |
| Lourdes | Famous pilgrimage site attracting millions of visitors each year. Offers spiritual experiences and rich history, making it a favorable investment for Airbnb hosting. | Sanctuary of Our Lady of Lourdes, Basilica of Puy-du-Fou, Lourdes Castle, Natural parks, Lakes and rivers |
| Arreau | Scenic small town at the crossroads of several popular hiking and cycling routes. Perfect for eco-tourism and nature lovers. | Col d'Aubisque, Château de Fréjus, Hiking trails, Local markets, Countryside views |
| Baronnies | Known for its natural beauty and rural charm, this area is perfect for those seeking a tranquil retreat close to nature. | The Col de Val Louron, Natural parks, Cycling routes, Local flora and fauna, Scenic picnic spots |
| Aure Valley | A picturesque valley that offers stunning mountain scenery, outdoor activities, and charming villages. A great spot for nature lovers and adventurers. | Tour de France routes, Breathtaking landscapes, Cultural heritage sites, Fishing and hiking opportunities, Outdoor sports |
| Bagnères-de-Luchon | Spa town known for its thermal waters and beautiful landscapes. Attracts both wellness tourists and adventure seekers all year round. | Thermal spas, Hiking and skiing nearby, Botanical gardens, Local cuisine, Art and culture festivals |
| Cauterets | Famous for its ski resorts and thermal baths, attracting both winter and summer tourists. Offers a great base for various mountain activities. | Cauterets ski area, Hot springs, Nature reserve, Cable cars, Mountain biking trails |
Understanding Airbnb License Requirements & STR Laws in Bourisp (2025)
While Bourisp, Occitania, France currently shows low STR regulations, specific Airbnb license requirements might still exist or change. Always verify the latest short term rental regulations and Airbnb license requirements directly with local government authorities for Bourisp to ensure full compliance before hosting.
(Source: AirROI data, 2025, finding no licensed listings among those analyzed)
Top Performing Airbnb Properties in Bourisp (2025)
Benchmark your potential! Explore examples of top-performing Airbnb properties in Bourispbased on Trailing Twelve Month (TTM) revenue. Analyze their characteristics, revenue, occupancy rate, and ADR to understand what drives success in this market.
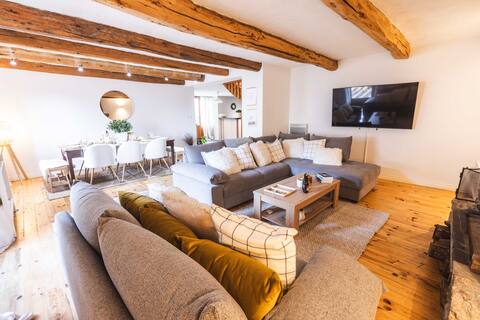
Chalet Pyrenea Vacation 5* Spa, Nature & Relaxation
Entire Place • 3 bedrooms
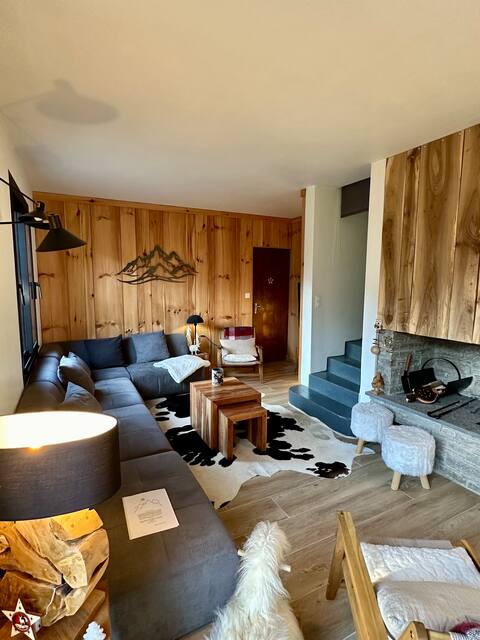
Chalet Saint-lary-soulan - Les Cabanes - 10 pers
Entire Place • 5 bedrooms
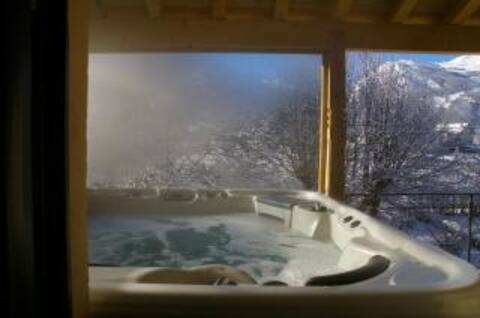
Fully equipped cozy T2 with mountain views
Entire Place • 1 bedroom
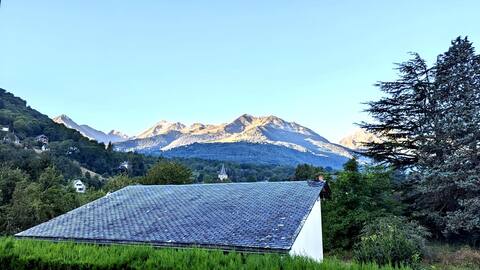
Villa Lustou / Great house with mountain view
Entire Place • 6 bedrooms
Charmante maison à l'entrée de Saint-Lary-Soulan
Entire Place • 4 bedrooms
comfortable barn 6/8 pers
Entire Place • 3 bedrooms
Note: Performance varies based on location, size, amenities, seasonality, and management quality. Data reflects the past 12 months.
Top Performing Airbnb Hosts in Bourisp (2025)
Learn from the best! This table showcases top-performing Airbnb hosts in Bourisp based on the number of properties managed and estimated total revenue over the past year. Analyze their scale and performance metrics.
| Host Name | Properties | Grossing Revenue | Stay Reviews | Avg Rating |
|---|---|---|---|---|
| Terra Pyrenea | 1 | $81,144 | 19 | 4.89/5.0 |
| Marie | 1 | $77,201 | 6 | 4.83/5.0 |
| Sven | 1 | $28,444 | 49 | 4.92/5.0 |
| Isabelle | 1 | $28,213 | 11 | 4.55/5.0 |
| Host #41072493 | 1 | $23,946 | 1 | 0.00/5.0 |
| Joris | 1 | $18,860 | 199 | 4.57/5.0 |
| Les Loups Piau | 1 | $16,271 | 5 | 4.60/5.0 |
| Damien | 1 | $14,840 | 46 | 4.87/5.0 |
| Marie-Claire | 1 | $13,018 | 9 | 5.00/5.0 |
| Anaïs | 2 | $12,712 | 28 | 4.72/5.0 |
Analyzing the strategies of top hosts, such as their property selection, pricing, and guest communication, can offer valuable lessons for optimizing your own Airbnb operations in Bourisp.
Dive Deeper: Advanced Bourisp STR Market Data (2025)
Ready to unlock more insights? AirROI provides access to advanced metrics and comprehensive Airbnb data for Bourisp. Explore detailed analytics beyond this report to refine your investment strategy, optimize pricing, and maximize your vacation rental profits.
Explore Advanced MetricsBourisp Short-Term Rental Market Composition (2025): Property & Room Types
Room Type Distribution
Property Type Distribution
Market Composition Insights for Bourisp
- The Bourisp Airbnb market composition is heavily skewed towards Entire Home/Apt listings, which make up 91.7% of the 24 active rentals. This indicates strong guest preference for privacy and space.
- Looking at the property type distribution in Bourisp, House properties are the most common (45.8%), reflecting the local real estate landscape.
- Houses represent a significant 45.8% portion, catering likely to families or larger groups.
- The presence of 8.3% Hotel/Boutique listings indicates integration with traditional hospitality.
Bourisp Airbnb Room Capacity Analysis (2025): Bedroom Distribution
Distribution of Listings by Number of Bedrooms
Room Capacity Insights for Bourisp
- The dominant room capacity in Bourisp is 2 bedrooms listings, making up 33.3% of the market. This suggests a strong demand for properties suitable for couples or solo travelers.
- Together, 2 bedrooms and 3 bedrooms properties represent 54.1% of the active Airbnb listings in Bourisp, indicating a high concentration in these sizes.
- A significant 41.6% of listings offer 3+ bedrooms, catering to larger groups and families seeking more space in Bourisp.
Bourisp Vacation Rental Guest Capacity Trends (2025)
Distribution of Listings by Guest Capacity
Guest Capacity Insights for Bourisp
- The most common guest capacity trend in Bourisp vacation rentals is listings accommodating 8+ guests (37.5%). This suggests the primary traveler segment is likely larger groups.
- Properties designed for 8+ guests and 4 guests dominate the Bourisp STR market, accounting for 66.7% of listings.
- 54.2% of properties accommodate 6+ guests, serving the market segment for larger families or group travel in Bourisp.
- On average, properties in Bourisp are equipped to host 5.6 guests.
Bourisp Airbnb Booking Patterns (2025): Available vs. Booked Days
Available Days Distribution
Booked Days Distribution
Booking Pattern Insights for Bourisp
- The most common availability pattern in Bourisp falls within the 271-366 days range, representing 62.5% of listings. This suggests many properties have significant open periods on their calendars.
- Approximately 87.5% of listings show high availability (181+ days open annually), indicating potential for increased bookings or specific owner usage patterns.
- For booked days, the 31-90 days range is most frequent in Bourisp (41.7%), reflecting common guest stay durations or potential owner blocking patterns.
- A notable 12.5% of properties secure long booking periods (181+ days booked per year), highlighting successful long-term rental strategies or significant owner usage.
Bourisp Airbnb Minimum Stay Requirements Analysis
Distribution of Listings by Minimum Night Requirement
1 Night
4 listings
17.4% of total
2 Nights
7 listings
30.4% of total
4-6 Nights
3 listings
13% of total
7-29 Nights
3 listings
13% of total
30+ Nights
6 listings
26.1% of total
Key Insights
- The most prevalent minimum stay requirement in Bourisp is 2 Nights, adopted by 30.4% of listings. This highlights the market's preference for shorter, flexible bookings.
- A significant segment (26.1%) caters to monthly stays (30+ nights) in Bourisp, pointing to opportunities in the extended-stay market.
Recommendations
- Align with the market by considering a 2 Nights minimum stay, as 30.4% of Bourisp hosts use this setting.
- If feasible, allowing 1-night stays, especially midweek or during low season, could capture last-minute bookings, as only 17.4% currently do.
- A 2-night minimum appears standard (30.4%). Consider this for weekends or peak periods.
- Explore offering discounts for stays of 30+ nights to attract the 26.1% of the market seeking extended stays.
- Adjust minimum nights based on seasonality – potentially shorter during low season and longer during peak demand periods in Bourisp.
Bourisp Airbnb Cancellation Policy Trends Analysis (2025)
Flexible
5 listings
23.8% of total
Moderate
6 listings
28.6% of total
Firm
3 listings
14.3% of total
Strict
7 listings
33.3% of total
Cancellation Policy Insights for Bourisp
- The prevailing Airbnb cancellation policy trend in Bourisp is Strict, used by 33.3% of listings.
- There's a relatively balanced mix between guest-friendly (52.4%) and stricter (47.6%) policies, offering choices for different guest needs.
Recommendations for Hosts
- Consider adopting a Strict policy to align with the 33.3% market standard in Bourisp.
- With 33.3% using Strict terms, this is a viable option in Bourisp, particularly for high-value properties or during peak demand periods.
- Regularly review your cancellation policy against competitors and market demand shifts in Bourisp.
Bourisp STR Booking Lead Time Analysis (2025)
Average Booking Lead Time by Month
Booking Lead Time Insights for Bourisp
- The overall average booking lead time for vacation rentals in Bourisp is 61 days.
- Guests book furthest in advance for stays during August (average 95 days), likely coinciding with peak travel demand or local events.
- The shortest booking windows occur for stays in October (average 38 days), indicating more last-minute travel plans during this time.
- Seasonally, Summer (81 days avg.) sees the longest lead times, while Winter (58 days avg.) has the shortest, reflecting typical travel planning cycles.
Recommendations for Hosts
- Use the overall average lead time (61 days) as a baseline for your pricing and availability strategy in Bourisp.
- For August stays, consider implementing length-of-stay discounts or slightly higher rates for bookings made less than 95 days out to capitalize on advance planning.
- Target marketing efforts for the Summer season well in advance (at least 81 days) to capture early planners.
- Monitor your own booking lead times against these Bourisp averages to identify opportunities for dynamic pricing adjustments.
Popular & Essential Airbnb Amenities in Bourisp (2025)
Amenity Prevalence
Amenity Insights for Bourisp
- Essential amenities in Bourisp that guests expect include: Heating. Lacking these (this) could significantly impact bookings.
- Popular amenities like Hot water, TV, Hangers are common but not universal. Offering these can provide a competitive edge.
Recommendations for Hosts
- Ensure your listing includes all essential amenities for Bourisp: Heating.
- Consider adding popular differentiators like Hot water or TV to increase appeal.
- Highlight unique or less common amenities you offer (e.g., hot tub, dedicated workspace, EV charger) in your listing description and photos.
- Regularly check competitor amenities in Bourisp to stay competitive.
Bourisp Airbnb Guest Demographics & Profile Analysis (2025)
Guest Profile Summary for Bourisp
- The typical guest profile for Airbnb in Bourisp consists of primarily domestic travelers (82%), often arriving from nearby Bordeaux, typically belonging to the Post-2000s (Gen Z/Alpha) group (50%), primarily speaking French or English.
- Domestic travelers account for 81.8% of guests.
- Key international markets include France (81.8%) and Spain (9.1%).
- Top languages spoken are French (43.2%) followed by English (32.2%).
- A significant demographic segment is the Post-2000s (Gen Z/Alpha) group, representing 50% of guests.
Recommendations for Hosts
- Target domestic marketing efforts towards travelers from Bordeaux and Toulouse.
- Tailor amenities and listing descriptions to appeal to the dominant Post-2000s (Gen Z/Alpha) demographic (e.g., highlight fast WiFi, smart home features, local guides).
- Highlight unique local experiences or amenities relevant to the primary guest profile.
- Consider seasonal promotions aligned with peak travel times for key origin markets.
Nearby Short-Term Rental Market Comparison
How does the Bourisp Airbnb market stack up against its neighbors? Compare key performance metrics like average monthly revenue, ADR, and occupancy rates in surrounding areas to understand the broader regional STR landscape.
| Market | Active Properties | Monthly Revenue | Daily Rate | Avg. Occupancy |
|---|---|---|---|---|
| Canyelles | 49 | $5,958 | $1023.94 | 37% |
| la Baronia de Rialb | 14 | $4,296 | $393.88 | 43% |
| Sant Martí Sarroca | 10 | $3,855 | $337.60 | 43% |
| Banyeres del Penedès | 12 | $3,474 | $373.99 | 37% |
| Mediona | 11 | $3,355 | $550.99 | 37% |
| Corbera de Llobregat | 14 | $3,275 | $304.33 | 52% |
| Riudoms | 10 | $3,270 | $363.84 | 36% |
| Olivella | 94 | $3,211 | $420.71 | 41% |
| Castellet i la Gornal | 15 | $3,167 | $465.42 | 39% |
| Aiguamúrcia | 11 | $3,008 | $223.61 | 47% |