Bolquère Airbnb Market Analysis 2025: Short Term Rental Data & Vacation Rental Statistics in Occitania, France
Is Airbnb profitable in Bolquère in 2025? Explore comprehensive Airbnb analytics for Bolquère, Occitania, France to uncover income potential. This 2025 STR market report for Bolquère, based on AirROI data from April 2024 to March 2025, reveals key trends in the market of 355 active listings.
Whether you're considering an Airbnb investment in Bolquère, optimizing your existing vacation rental, or exploring rental arbitrage opportunities, understanding the Bolquère Airbnb data is crucial. Understanding the local regulations is key to maximizing your short term rental income potential. Let's dive into the specifics.
Key Bolquère Airbnb Performance Metrics Overview
Monthly Airbnb Revenue Variations & Income Potential in Bolquère (2025)
Understanding the monthly revenue variations for Airbnb listings in Bolquère is key to maximizing your short term rental income potential. Seasonality significantly impacts earnings. Our analysis, based on data from the past 12 months, shows that the peak revenue month for STRs in Bolquère is typically February, while October often presents the lowest earnings, highlighting opportunities for strategic pricing adjustments during shoulder and low seasons. Explore the typical Airbnb income in Bolquère across different performance tiers:
- Best-in-class properties (Top 10%) achieve $3,743+ monthly, often utilizing dynamic pricing and superior guest experiences.
- Strong performing properties (Top 25%) earn $2,098 or more, indicating effective management and desirable locations/amenities.
- Typical properties (Median) generate around $1,080 per month, representing the average market performance.
- Entry-level properties (Bottom 25%) see earnings around $541, often with potential for optimization.
Average Monthly Airbnb Earnings Trend in Bolquère
Bolquère Airbnb Occupancy Rate Trends (2025)
Maximize your bookings by understanding the Bolquère STR occupancy trends. Seasonal demand shifts significantly influence how often properties are booked. Typically, Februarysees the highest demand (peak season occupancy), while October experiences the lowest (low season). Effective strategies, like adjusting minimum stays or offering promotions, can boost occupancy during slower periods. Here's how different property tiers perform in Bolquère:
- Best-in-class properties (Top 10%) achieve 70%+ occupancy, indicating high desirability and potentially optimized availability.
- Strong performing properties (Top 25%) maintain 50% or higher occupancy, suggesting good market fit and guest satisfaction.
- Typical properties (Median) have an occupancy rate around 31%.
- Entry-level properties (Bottom 25%) average 16% occupancy, potentially facing higher vacancy.
Average Monthly Occupancy Rate Trend in Bolquère
Average Daily Rate (ADR) Airbnb Trends in Bolquère (2025)
Effective short term rental pricing strategy in Bolquère involves understanding monthly ADR fluctuations. The Average Daily Rate (ADR) for Airbnb in Bolquère typically peaks in February and dips lowest during September. Leveraging Airbnb dynamic pricing tools or strategies based on this seasonality can significantly boost revenue. Here's a look at the typical nightly rates achieved:
- Best-in-class properties (Top 10%) command rates of $359+ per night, often due to premium features or locations.
- Strong performing properties (Top 25%) achieve nightly rates of $209 or more.
- Typical properties (Median) charge around $109 per night.
- Entry-level properties (Bottom 25%) earn around $74 per night.
Average Daily Rate (ADR) Trend by Month in Bolquère
Get Live Bolquère Market Intelligence 👇

Explore Real-time Analytics
Airbnb Seasonality Analysis & Trends in Bolquère (2025)
Peak Season (February, December, August)
- Revenue averages $2,536 per month
- Occupancy rates average 49.6%
- Daily rates average $185
Shoulder Season
- Revenue averages $1,551 per month
- Occupancy maintains around 31.5%
- Daily rates hold near $168
Low Season (May, September, October)
- Revenue drops to average $1,072 per month
- Occupancy decreases to average 26.0%
- Daily rates adjust to average $154
Seasonality Insights for Bolquère
- The Airbnb seasonality in Bolquère shows highly seasonal trends requiring careful strategy. While the sections above show seasonal averages, it's also insightful to look at the extremes:
- During the high season, the absolute peak month showcases Bolquère's highest earning potential, with monthly revenues capable of climbing to $3,190, occupancy reaching a high of 62.5%, and ADRs peaking at $205.
- Conversely, the slowest single month of the year, typically falling within the low season, marks the market's lowest point. In this month, revenue might dip to $1,014, occupancy could drop to 24.5%, and ADRs may adjust down to $151.
- Understanding both the seasonal averages and these monthly peaks and troughs in revenue, occupancy, and ADR is crucial for maximizing your Airbnb profit potential in Bolquère.
Seasonal Strategies for Maximizing Profit
- Peak Season: Maximize revenue through premium pricing and potentially longer minimum stays. Ensure high availability.
- Low Season: Offer competitive pricing, special promotions (e.g., extended stay discounts), and flexible cancellation policies. Target off-season travelers like remote workers or budget-conscious guests.
- Shoulder Seasons: Implement dynamic pricing that balances peak and low rates. Target weekend travelers or specific events. Offer slightly more flexible terms than peak season.
- Regularly analyze your own performance against these Bolquère seasonality benchmarks and adjust your pricing and availability strategy accordingly.
Best Areas for Airbnb Investment in Bolquère (2025)
Exploring the top neighborhoods for short-term rentals in Bolquère? This section highlights key areas, outlining why they are attractive for hosts and guests, along with notable local attractions. Consider these locations based on your target guest profile and investment strategy.
| Neighborhood / Area | Why Host Here? (Target Guests & Appeal) | Key Attractions & Landmarks |
|---|---|---|
| Les Aires | A tranquil area offering beautiful views of the mountains, ideal for those looking to escape the city hustle. It attracts nature lovers and hikers due to its proximity to the ski resorts and hiking trails. | Bolquère Pyrénées 2000 ski resort, Nature hiking trails, Lac de les Bouillouses, Pic du Carlit, Scenic mountain views |
| Bolquère Village | A charming village atmosphere with traditional French architecture and local shops. Perfect for families and tourists seeking an authentic experience in the French Pyrenees. | Local markets, Traditional French bistros, Historical landmarks, Cultural events, Scenic village squares |
| Pyrénées 2000 | A popular ski resort area with abundance of winter sports activities. Great for winter tourism and offers year-round outdoor activities, attracting both winter sports enthusiasts and summer hikers. | Ski slopes, Snowboard parks, Hiking trails, Mountain biking routes, Scenic lifts |
| Les Bouillouses | Known for its beautiful lake and natural scenery, this area offers a peaceful retreat. Ideal for tourists interested in nature walks, photography, and tranquility. | Lac des Bouillouses, Hiking paths, Wildlife observation, Picnic areas, Breathtaking panoramic views |
| Eyne | A picturesque mountain village close to Bolquère and perfect for outdoor activities. It draws visitors who appreciate serene landscapes and mountain adventures. | Moutain biking, Hiking trails, Cultural heritage, Natural parks, Spectacular viewpoints |
| Vernet-les-Bains | This thermal spa town offers relaxation and wellness tourism, with beautiful architecture and a mild climate. Attracts those seeking health and rejuvenation treatments. | Thermal baths, Cultural landmarks, Scenic walking paths, Gardens and parks, Spa services |
| Formiguères | A quaint village known for its rich Catalan culture and outdoor sports, attracts families and hikers who appreciate cultural experiences combined with adventure. | Catalan festivals, Hiking trails, Skiing, Cultural excursions, Local gastronomy |
| Capcir | A beautiful region known for its diverse landscapes combining lakes, mountains, and forests. A beacon for eco-tourists and adventure seekers year-round. | Lakes and rivers, Wildlife parks, Adventure sports, Cultural festivals, Hiking and biking trails |
Understanding Airbnb License Requirements & STR Laws in Bolquère (2025)
With 10% of listings showing registration in 2025, understanding potential Airbnb license requirements is crucial in Bolquère. Always verify the latest short term rental regulations and Airbnb license requirements directly with local government authorities for Bolquère to ensure full compliance before hosting.
(Source: AirROI data, 2025, based on 10% licensed listings)
Top Performing Airbnb Properties in Bolquère (2025)
Benchmark your potential! Explore examples of top-performing Airbnb properties in Bolquèrebased on Trailing Twelve Month (TTM) revenue. Analyze their characteristics, revenue, occupancy rate, and ADR to understand what drives success in this market.
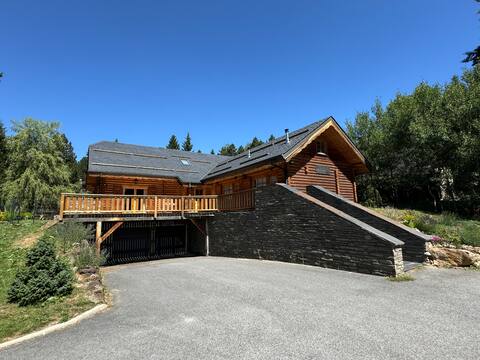
Chalet Boréal for 21 people, spa, 3 min from the slopes
Entire Place • 7 bedrooms

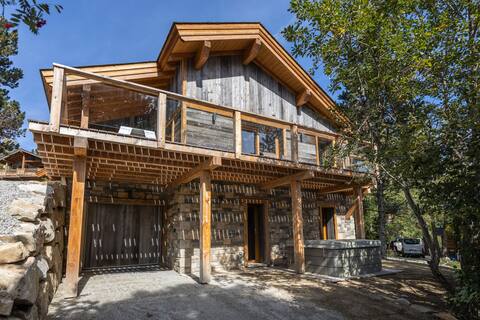
Ker Cerdagne Atout France-Chalet-Mountain view-Ens
Entire Place • 4 bedrooms
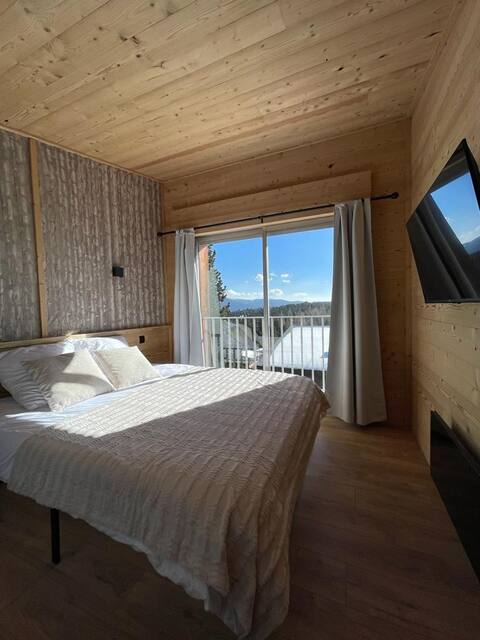
Chalet Ferroker - Luxury with Sauna and Jacuzzi
Entire Place • 4 bedrooms

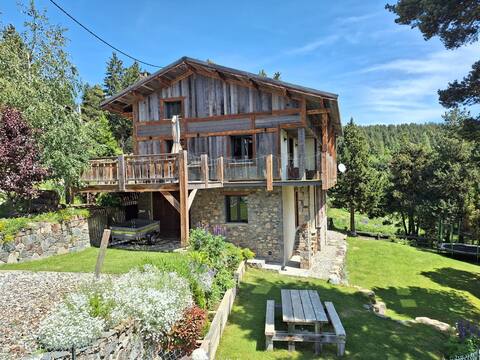
Cozy and family chalet Pyrenees
Entire Place • 6 bedrooms
Chalet Isard Pyrenees 2000 - 300m ski slopes
Entire Place • 4 bedrooms
Grand Chalet in Superbolquère
Entire Place • 4 bedrooms
Note: Performance varies based on location, size, amenities, seasonality, and management quality. Data reflects the past 12 months.
Top Performing Airbnb Hosts in Bolquère (2025)
Learn from the best! This table showcases top-performing Airbnb hosts in Bolquère based on the number of properties managed and estimated total revenue over the past year. Analyze their scale and performance metrics.
| Host Name | Properties | Grossing Revenue | Stay Reviews | Avg Rating |
|---|---|---|---|---|
| Host #17231559 | 20 | $333,807 | 1 | 0.00/5.0 |
| Monique | 6 | $203,889 | 80 | 3.11/5.0 |
| Thibaud | 7 | $182,439 | 19 | 2.80/5.0 |
| Guy | 1 | $110,740 | 64 | 4.91/5.0 |
| Isabelle | 1 | $73,528 | 20 | 4.90/5.0 |
| Terik | 1 | $72,108 | 4 | 5.00/5.0 |
| Ski-Lodge | 3 | $71,659 | 128 | 4.85/5.0 |
| Rémi | 1 | $71,175 | 35 | 4.97/5.0 |
| Dorothée | 1 | $69,593 | 27 | 4.96/5.0 |
| Tom | 1 | $63,549 | 5 | 4.80/5.0 |
Analyzing the strategies of top hosts, such as their property selection, pricing, and guest communication, can offer valuable lessons for optimizing your own Airbnb operations in Bolquère.
Dive Deeper: Advanced Bolquère STR Market Data (2025)
Ready to unlock more insights? AirROI provides access to advanced metrics and comprehensive Airbnb data for Bolquère. Explore detailed analytics beyond this report to refine your investment strategy, optimize pricing, and maximize your vacation rental profits.
Explore Advanced MetricsBolquère Short-Term Rental Market Composition (2025): Property & Room Types
Room Type Distribution
Property Type Distribution
Market Composition Insights for Bolquère
- The Bolquère Airbnb market composition is heavily skewed towards Entire Home/Apt listings, which make up 99.2% of the 355 active rentals. This indicates strong guest preference for privacy and space.
- Looking at the property type distribution in Bolquère, Apartment/Condo properties are the most common (53.8%), reflecting the local real estate landscape.
- Houses represent a significant 45.1% portion, catering likely to families or larger groups.
- Smaller segments like hotel/boutique, others (combined 1.1%) offer potential for unique stay experiences.
Bolquère Airbnb Room Capacity Analysis (2025): Bedroom Distribution
Distribution of Listings by Number of Bedrooms
Room Capacity Insights for Bolquère
- The dominant room capacity in Bolquère is 1 bedroom listings, making up 30.7% of the market. This suggests a strong demand for properties suitable for couples or solo travelers.
- Together, 1 bedroom and 2 bedrooms properties represent 53.5% of the active Airbnb listings in Bolquère, indicating a high concentration in these sizes.
- A significant 38.1% of listings offer 3+ bedrooms, catering to larger groups and families seeking more space in Bolquère.
Bolquère Vacation Rental Guest Capacity Trends (2025)
Distribution of Listings by Guest Capacity
Guest Capacity Insights for Bolquère
- The most common guest capacity trend in Bolquère vacation rentals is listings accommodating 4 guests (34.1%). This suggests the primary traveler segment is likely small families or groups.
- Properties designed for 4 guests and 8+ guests dominate the Bolquère STR market, accounting for 59.5% of listings.
- 49.9% of properties accommodate 6+ guests, serving the market segment for larger families or group travel in Bolquère.
- On average, properties in Bolquère are equipped to host 5.5 guests.
Bolquère Airbnb Booking Patterns (2025): Available vs. Booked Days
Available Days Distribution
Booked Days Distribution
Booking Pattern Insights for Bolquère
- The most common availability pattern in Bolquère falls within the 271-366 days range, representing 60.6% of listings. This suggests many properties have significant open periods on their calendars.
- Approximately 87.9% of listings show high availability (181+ days open annually), indicating potential for increased bookings or specific owner usage patterns.
- For booked days, the 31-90 days range is most frequent in Bolquère (40%), reflecting common guest stay durations or potential owner blocking patterns.
- A notable 12.1% of properties secure long booking periods (181+ days booked per year), highlighting successful long-term rental strategies or significant owner usage.
Bolquère Airbnb Minimum Stay Requirements Analysis
Distribution of Listings by Minimum Night Requirement
1 Night
12 listings
3.5% of total
2 Nights
67 listings
19.8% of total
3 Nights
31 listings
9.1% of total
4-6 Nights
94 listings
27.7% of total
7-29 Nights
50 listings
14.7% of total
30+ Nights
85 listings
25.1% of total
Key Insights
- The most prevalent minimum stay requirement in Bolquère is 4-6 Nights, adopted by 27.7% of listings. This highlights the market's preference for longer commitments.
- A significant segment (25.1%) caters to monthly stays (30+ nights) in Bolquère, pointing to opportunities in the extended-stay market.
Recommendations
- Align with the market by considering a 4-6 Nights minimum stay, as 27.7% of Bolquère hosts use this setting.
- If feasible, allowing 1-night stays, especially midweek or during low season, could capture last-minute bookings, as only 3.5% currently do.
- Explore offering discounts for stays of 30+ nights to attract the 25.1% of the market seeking extended stays.
- Adjust minimum nights based on seasonality – potentially shorter during low season and longer during peak demand periods in Bolquère.
Bolquère Airbnb Cancellation Policy Trends Analysis (2025)
Super Strict 60 Days
1 listings
0.3% of total
Flexible
58 listings
19.3% of total
Moderate
77 listings
25.6% of total
Firm
81 listings
26.9% of total
Strict
84 listings
27.9% of total
Cancellation Policy Insights for Bolquère
- The prevailing Airbnb cancellation policy trend in Bolquère is Strict, used by 27.9% of listings.
- A majority (54.8%) of hosts in Bolquère utilize Firm or Strict policies, indicating a market where hosts prioritize booking security.
Recommendations for Hosts
- Consider adopting a Strict policy to align with the 27.9% market standard in Bolquère.
- Regularly review your cancellation policy against competitors and market demand shifts in Bolquère.
Bolquère STR Booking Lead Time Analysis (2025)
Average Booking Lead Time by Month
Booking Lead Time Insights for Bolquère
- The overall average booking lead time for vacation rentals in Bolquère is 53 days.
- Guests book furthest in advance for stays during February (average 79 days), likely coinciding with peak travel demand or local events.
- The shortest booking windows occur for stays in October (average 32 days), indicating more last-minute travel plans during this time.
- Seasonally, Summer (64 days avg.) sees the longest lead times, while Fall (38 days avg.) has the shortest, reflecting typical travel planning cycles.
Recommendations for Hosts
- Use the overall average lead time (53 days) as a baseline for your pricing and availability strategy in Bolquère.
- For February stays, consider implementing length-of-stay discounts or slightly higher rates for bookings made less than 79 days out to capitalize on advance planning.
- Target marketing efforts for the Summer season well in advance (at least 64 days) to capture early planners.
- Monitor your own booking lead times against these Bolquère averages to identify opportunities for dynamic pricing adjustments.
Popular & Essential Airbnb Amenities in Bolquère (2025)
Amenity Prevalence
Amenity Insights for Bolquère
- Essential amenities in Bolquère that guests expect include: Kitchen, Heating, TV. Lacking these (any) could significantly impact bookings.
- Popular amenities like Coffee maker, Dishes and silverware, Free parking on premises are common but not universal. Offering these can provide a competitive edge.
Recommendations for Hosts
- Ensure your listing includes all essential amenities for Bolquère: Kitchen, Heating, TV.
- Prioritize adding missing essentials: Kitchen, Heating, TV.
- Consider adding popular differentiators like Coffee maker or Dishes and silverware to increase appeal.
- Highlight unique or less common amenities you offer (e.g., hot tub, dedicated workspace, EV charger) in your listing description and photos.
- Regularly check competitor amenities in Bolquère to stay competitive.
Bolquère Airbnb Guest Demographics & Profile Analysis (2025)
Guest Profile Summary for Bolquère
- The typical guest profile for Airbnb in Bolquère consists of primarily domestic travelers (77%), often arriving from nearby Barcelona, typically belonging to the Post-2000s (Gen Z/Alpha) group (50%), primarily speaking French or English.
- Domestic travelers account for 77.0% of guests.
- Key international markets include France (77%) and Spain (18.4%).
- Top languages spoken are French (34.8%) followed by English (31.8%).
- A significant demographic segment is the Post-2000s (Gen Z/Alpha) group, representing 50% of guests.
Recommendations for Hosts
- Target domestic marketing efforts towards travelers from Barcelona and Toulouse.
- Tailor amenities and listing descriptions to appeal to the dominant Post-2000s (Gen Z/Alpha) demographic (e.g., highlight fast WiFi, smart home features, local guides).
- Highlight unique local experiences or amenities relevant to the primary guest profile.
- Consider seasonal promotions aligned with peak travel times for key origin markets.
Nearby Short-Term Rental Market Comparison
How does the Bolquère Airbnb market stack up against its neighbors? Compare key performance metrics like average monthly revenue, ADR, and occupancy rates in surrounding areas to understand the broader regional STR landscape.
| Market | Active Properties | Monthly Revenue | Daily Rate | Avg. Occupancy |
|---|---|---|---|---|
| Vall-llobrega | 15 | $10,261 | $798.88 | 44% |
| Canyelles | 49 | $5,958 | $1023.94 | 37% |
| Arenys de Munt | 28 | $5,100 | $514.27 | 41% |
| Teià | 25 | $5,027 | $348.45 | 45% |
| Cornellà del Terri | 17 | $4,960 | $460.96 | 41% |
| Tiana | 12 | $4,955 | $299.97 | 48% |
| Amer | 10 | $4,848 | $397.58 | 40% |
| Bescanó | 11 | $4,761 | $445.38 | 41% |
| Porqueres | 12 | $4,714 | $469.05 | 36% |
| Premià de Dalt | 28 | $4,630 | $345.43 | 49% |