Blars Airbnb Market Analysis 2025: Short Term Rental Data & Vacation Rental Statistics in Occitania, France
Is Airbnb profitable in Blars in 2025? Explore comprehensive Airbnb analytics for Blars, Occitania, France to uncover income potential. This 2025 STR market report for Blars, based on AirROI data from April 2024 to March 2025, reveals key trends in the niche market of 17 active listings.
Whether you're considering an Airbnb investment in Blars, optimizing your existing vacation rental, or exploring rental arbitrage opportunities, understanding the Blars Airbnb data is crucial. Understanding the local regulations is key to maximizing your short term rental income potential. Let's dive into the specifics.
Key Blars Airbnb Performance Metrics Overview
Monthly Airbnb Revenue Variations & Income Potential in Blars (2025)
Understanding the monthly revenue variations for Airbnb listings in Blars is key to maximizing your short term rental income potential. Seasonality significantly impacts earnings. Our analysis, based on data from the past 12 months, shows that the peak revenue month for STRs in Blars is typically August, while January often presents the lowest earnings, highlighting opportunities for strategic pricing adjustments during shoulder and low seasons. Explore the typical Airbnb income in Blars across different performance tiers:
- Best-in-class properties (Top 10%) achieve $2,991+ monthly, often utilizing dynamic pricing and superior guest experiences.
- Strong performing properties (Top 25%) earn $1,324 or more, indicating effective management and desirable locations/amenities.
- Typical properties (Median) generate around $893 per month, representing the average market performance.
- Entry-level properties (Bottom 25%) see earnings around $622, often with potential for optimization.
Average Monthly Airbnb Earnings Trend in Blars
Blars Airbnb Occupancy Rate Trends (2025)
Maximize your bookings by understanding the Blars STR occupancy trends. Seasonal demand shifts significantly influence how often properties are booked. Typically, Augustsees the highest demand (peak season occupancy), while January experiences the lowest (low season). Effective strategies, like adjusting minimum stays or offering promotions, can boost occupancy during slower periods. Here's how different property tiers perform in Blars:
- Best-in-class properties (Top 10%) achieve 58%+ occupancy, indicating high desirability and potentially optimized availability.
- Strong performing properties (Top 25%) maintain 41% or higher occupancy, suggesting good market fit and guest satisfaction.
- Typical properties (Median) have an occupancy rate around 31%.
- Entry-level properties (Bottom 25%) average 22% occupancy, potentially facing higher vacancy.
Average Monthly Occupancy Rate Trend in Blars
Average Daily Rate (ADR) Airbnb Trends in Blars (2025)
Effective short term rental pricing strategy in Blars involves understanding monthly ADR fluctuations. The Average Daily Rate (ADR) for Airbnb in Blars typically peaks in August and dips lowest during February. Leveraging Airbnb dynamic pricing tools or strategies based on this seasonality can significantly boost revenue. Here's a look at the typical nightly rates achieved:
- Best-in-class properties (Top 10%) command rates of $262+ per night, often due to premium features or locations.
- Strong performing properties (Top 25%) achieve nightly rates of $102 or more.
- Typical properties (Median) charge around $80 per night.
- Entry-level properties (Bottom 25%) earn around $71 per night.
Average Daily Rate (ADR) Trend by Month in Blars
Get Live Blars Market Intelligence 👇

Explore Real-time Analytics
Airbnb Seasonality Analysis & Trends in Blars (2025)
Peak Season (August, July, May)
- Revenue averages $2,089 per month
- Occupancy rates average 53.8%
- Daily rates average $135
Shoulder Season
- Revenue averages $1,088 per month
- Occupancy maintains around 29.5%
- Daily rates hold near $121
Low Season (January, February, October)
- Revenue drops to average $792 per month
- Occupancy decreases to average 24.1%
- Daily rates adjust to average $118
Seasonality Insights for Blars
- The Airbnb seasonality in Blars shows highly seasonal trends requiring careful strategy. While the sections above show seasonal averages, it's also insightful to look at the extremes:
- During the high season, the absolute peak month showcases Blars's highest earning potential, with monthly revenues capable of climbing to $2,829, occupancy reaching a high of 79.6%, and ADRs peaking at $138.
- Conversely, the slowest single month of the year, typically falling within the low season, marks the market's lowest point. In this month, revenue might dip to $630, occupancy could drop to 17.7%, and ADRs may adjust down to $110.
- Understanding both the seasonal averages and these monthly peaks and troughs in revenue, occupancy, and ADR is crucial for maximizing your Airbnb profit potential in Blars.
Seasonal Strategies for Maximizing Profit
- Peak Season: Maximize revenue through premium pricing and potentially longer minimum stays. Ensure high availability.
- Low Season: Offer competitive pricing, special promotions (e.g., extended stay discounts), and flexible cancellation policies. Target off-season travelers like remote workers or budget-conscious guests.
- Shoulder Seasons: Implement dynamic pricing that balances peak and low rates. Target weekend travelers or specific events. Offer slightly more flexible terms than peak season.
- Regularly analyze your own performance against these Blars seasonality benchmarks and adjust your pricing and availability strategy accordingly.
Best Areas for Airbnb Investment in Blars (2025)
Exploring the top neighborhoods for short-term rentals in Blars? This section highlights key areas, outlining why they are attractive for hosts and guests, along with notable local attractions. Consider these locations based on your target guest profile and investment strategy.
| Neighborhood / Area | Why Host Here? (Target Guests & Appeal) | Key Attractions & Landmarks |
|---|---|---|
| Carcassonne | Renowned for its medieval fortress, Carcassonne attracts history enthusiasts and tourists alike, offering a unique perspective on the past. | Carcassonne Citadel, Basilica of Saints Nazarius and Celsus, Andrew's Tower, Canal du Midi, Cité de Carcassonne, Château Comtal |
| Toulouse | Known as la Ville Rose, Toulouse is a vibrant city with a rich cultural scene, making it ideal for tourists and business travelers. | Place du Capitole, Basilique Saint-Sernin, Cité de l'Espace, Musée des Augustins, Garonne River, Les Abattoirs |
| Narbonne | A charming town with a historical background, Narbonne offers a laid-back atmosphere with proximity to the Mediterranean coast. | Narbonne Cathedral, Palais des Archevêques, Canal de la Robine, Les Halles de Narbonne, Forteresse de Salses |
| Montpellier | A dynamic student city with a vibrant nightlife and cultural life, Montpellier is becoming increasingly popular for short-term rentals. | Place de la Comédie, Montpellier Cathedral, Musée Fabre, Antigone District, Parks and Gardens |
| Lourdes | A major pilgrimage destination, Lourdes sees a yearly influx of visitors seeking spiritual experiences, making it a solid choice for Airbnb hosting. | Sanctuary of Our Lady of Lourdes, Basilica of St. Pius X, Grotto of Massabielle, Six Senses Spa, Pic du Jer |
| Sète | This picturesque coastal town offers beautiful beaches and a vibrant fishing port atmosphere, making it perfect for summer tourism. | Mont Saint-Clair, Espace Georges Brassens, Canals of Sète, Beaches of Sète, Sète Marina |
| Albi | Famous for its stunning cathedral and rich history, Albi offers a quaint atmosphere combined with numerous artistic attractions. | Albi Cathedral, Toulouse-Lautrec Museum, Palais de la Berbie, Pont Vieux, Saint-Salvi Church |
| Agen | Known for its prune production and historic landmarks, Agen provides a unique rural charm with access to regional attractions. | Agen Bridge, St. John the Baptist Cathedral, Canoeing on the Lot River, Walibi Sud-Ouest Theme Park, Agen's parks and gardens |
Understanding Airbnb License Requirements & STR Laws in Blars (2025)
With 18% of listings showing registration in 2025, understanding potential Airbnb license requirements is crucial in Blars. Always verify the latest short term rental regulations and Airbnb license requirements directly with local government authorities for Blars to ensure full compliance before hosting.
(Source: AirROI data, 2025, based on 18% licensed listings)
Top Performing Airbnb Properties in Blars (2025)
Benchmark your potential! Explore examples of top-performing Airbnb properties in Blarsbased on Trailing Twelve Month (TTM) revenue. Analyze their characteristics, revenue, occupancy rate, and ADR to understand what drives success in this market.
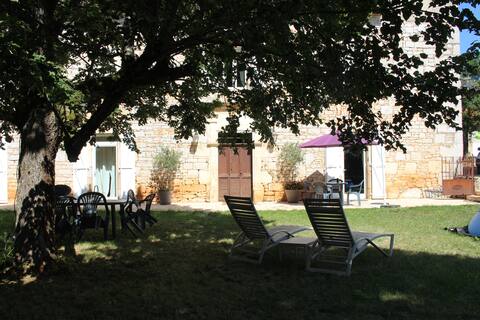
Le 1857 - Domaine de Pradié
Entire Place • 4 bedrooms
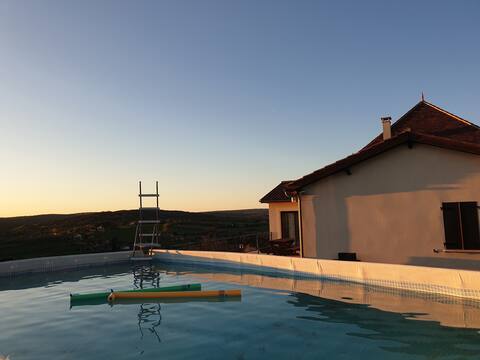
Beautiful villa viewpoint 160 m2 10 people.
Entire Place • 4 bedrooms

Villa apartment with beautiful viewpoint
Entire Place • 2 bedrooms

wilderness cottage
Entire Place • 1 bedroom
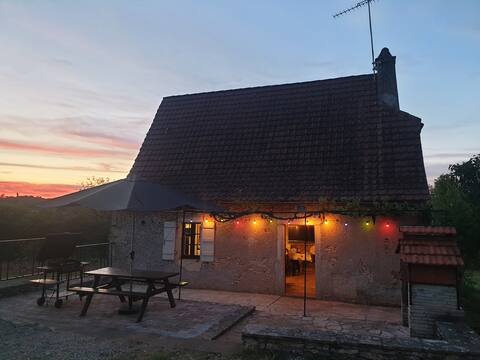
Coeur de Causse
Entire Place • 3 bedrooms
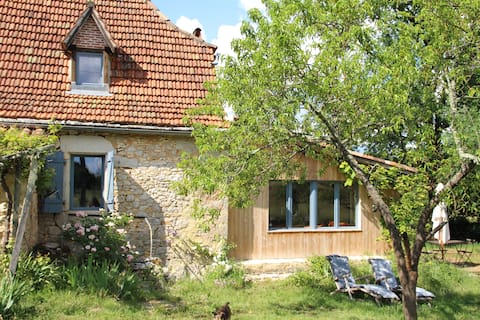
a nest in the heart of nature
Entire Place • 1 bedroom
Note: Performance varies based on location, size, amenities, seasonality, and management quality. Data reflects the past 12 months.
Top Performing Airbnb Hosts in Blars (2025)
Learn from the best! This table showcases top-performing Airbnb hosts in Blars based on the number of properties managed and estimated total revenue over the past year. Analyze their scale and performance metrics.
| Host Name | Properties | Grossing Revenue | Stay Reviews | Avg Rating |
|---|---|---|---|---|
| Jean | 5 | $68,246 | 213 | 4.59/5.0 |
| Sandrine | 1 | $38,772 | 11 | 4.91/5.0 |
| Flore | 5 | $29,538 | 45 | 4.89/5.0 |
| Arnaud | 2 | $26,099 | 316 | 4.96/5.0 |
| Pascale | 2 | $8,773 | 61 | 4.93/5.0 |
| Michel | 1 | $6,423 | 29 | 4.93/5.0 |
| Anne Et Louise | 1 | $5,233 | 8 | 4.75/5.0 |
Analyzing the strategies of top hosts, such as their property selection, pricing, and guest communication, can offer valuable lessons for optimizing your own Airbnb operations in Blars.
Dive Deeper: Advanced Blars STR Market Data (2025)
Ready to unlock more insights? AirROI provides access to advanced metrics and comprehensive Airbnb data for Blars. Explore detailed analytics beyond this report to refine your investment strategy, optimize pricing, and maximize your vacation rental profits.
Explore Advanced MetricsBlars Short-Term Rental Market Composition (2025): Property & Room Types
Room Type Distribution
Property Type Distribution
Market Composition Insights for Blars
- The Blars Airbnb market composition is heavily skewed towards Entire Home/Apt listings, which make up 82.4% of the 17 active rentals. This indicates strong guest preference for privacy and space.
- Looking at the property type distribution in Blars, House properties are the most common (58.8%), reflecting the local real estate landscape.
- Houses represent a significant 58.8% portion, catering likely to families or larger groups.
- The presence of 29.4% Hotel/Boutique listings indicates integration with traditional hospitality.
Blars Airbnb Room Capacity Analysis (2025): Bedroom Distribution
Distribution of Listings by Number of Bedrooms
Room Capacity Insights for Blars
- The dominant room capacity in Blars is 1 bedroom listings, making up 23.5% of the market. This suggests a strong demand for properties suitable for couples or solo travelers.
- Together, 1 bedroom and 3 bedrooms properties represent 41.1% of the active Airbnb listings in Blars, indicating a high concentration in these sizes.
- A significant 41.2% of listings offer 3+ bedrooms, catering to larger groups and families seeking more space in Blars.
Blars Vacation Rental Guest Capacity Trends (2025)
Distribution of Listings by Guest Capacity
Guest Capacity Insights for Blars
- The most common guest capacity trend in Blars vacation rentals is listings accommodating 6 guests (29.4%). This suggests the primary traveler segment is likely larger groups.
- Properties designed for 6 guests and 8+ guests dominate the Blars STR market, accounting for 52.9% of listings.
- 52.9% of properties accommodate 6+ guests, serving the market segment for larger families or group travel in Blars.
- On average, properties in Blars are equipped to host 4.6 guests.
Blars Airbnb Booking Patterns (2025): Available vs. Booked Days
Available Days Distribution
Booked Days Distribution
Booking Pattern Insights for Blars
- The most common availability pattern in Blars falls within the 271-366 days range, representing 52.9% of listings. This suggests many properties have significant open periods on their calendars.
- Approximately 88.2% of listings show high availability (181+ days open annually), indicating potential for increased bookings or specific owner usage patterns.
- For booked days, the 31-90 days range is most frequent in Blars (47.1%), reflecting common guest stay durations or potential owner blocking patterns.
- A notable 11.8% of properties secure long booking periods (181+ days booked per year), highlighting successful long-term rental strategies or significant owner usage.
Blars Airbnb Minimum Stay Requirements Analysis
Distribution of Listings by Minimum Night Requirement
1 Night
6 listings
35.3% of total
2 Nights
4 listings
23.5% of total
3 Nights
1 listings
5.9% of total
4-6 Nights
4 listings
23.5% of total
7-29 Nights
1 listings
5.9% of total
30+ Nights
1 listings
5.9% of total
Key Insights
- The most prevalent minimum stay requirement in Blars is 1 Night, adopted by 35.3% of listings. This highlights the market's preference for shorter, flexible bookings.
Recommendations
- Align with the market by considering a 1 Night minimum stay, as 35.3% of Blars hosts use this setting.
- Explore offering discounts for stays of 30+ nights to attract the 5.9% of the market seeking extended stays.
- Adjust minimum nights based on seasonality – potentially shorter during low season and longer during peak demand periods in Blars.
Blars Airbnb Cancellation Policy Trends Analysis (2025)
Super Strict 30 Days
2 listings
11.8% of total
Flexible
2 listings
11.8% of total
Moderate
4 listings
23.5% of total
Firm
5 listings
29.4% of total
Strict
4 listings
23.5% of total
Cancellation Policy Insights for Blars
- The prevailing Airbnb cancellation policy trend in Blars is Firm, used by 29.4% of listings.
- A majority (52.9%) of hosts in Blars utilize Firm or Strict policies, indicating a market where hosts prioritize booking security.
Recommendations for Hosts
- Consider adopting a Firm policy to align with the 29.4% market standard in Blars.
- Regularly review your cancellation policy against competitors and market demand shifts in Blars.
Blars STR Booking Lead Time Analysis (2025)
Average Booking Lead Time by Month
Booking Lead Time Insights for Blars
- The overall average booking lead time for vacation rentals in Blars is 76 days.
- Guests book furthest in advance for stays during May (average 116 days), likely coinciding with peak travel demand or local events.
- The shortest booking windows occur for stays in February (average 11 days), indicating more last-minute travel plans during this time.
- Seasonally, Summer (92 days avg.) sees the longest lead times, while Winter (24 days avg.) has the shortest, reflecting typical travel planning cycles.
Recommendations for Hosts
- Use the overall average lead time (76 days) as a baseline for your pricing and availability strategy in Blars.
- For May stays, consider implementing length-of-stay discounts or slightly higher rates for bookings made less than 116 days out to capitalize on advance planning.
- During February, focus on last-minute booking availability and promotions, as guests book with very short notice (11 days avg.).
- Target marketing efforts for the Summer season well in advance (at least 92 days) to capture early planners.
- Monitor your own booking lead times against these Blars averages to identify opportunities for dynamic pricing adjustments.
Popular & Essential Airbnb Amenities in Blars (2025)
Amenity Prevalence
Amenity Insights for Blars
- Essential amenities in Blars that guests expect include: TV, Smoke alarm, Hangers. Lacking these (any) could significantly impact bookings.
- Popular amenities like Hot water, Heating, Wifi are common but not universal. Offering these can provide a competitive edge.
- Warning: Wifi is not universally provided but is considered essential globally. Ensure reliable Wifi is offered.
Recommendations for Hosts
- Ensure your listing includes all essential amenities for Blars: TV, Smoke alarm, Hangers.
- Consider adding popular differentiators like Hot water or Heating to increase appeal.
- Highlight unique or less common amenities you offer (e.g., hot tub, dedicated workspace, EV charger) in your listing description and photos.
- Regularly check competitor amenities in Blars to stay competitive.
Blars Airbnb Guest Demographics & Profile Analysis (2025)
Guest Profile Summary for Blars
- The typical guest profile for Airbnb in Blars consists of primarily domestic travelers (96%), often arriving from nearby Toulouse, typically belonging to the Post-2000s (Gen Z/Alpha) group (50%), primarily speaking French or English.
- Domestic travelers account for 95.7% of guests.
- Key international markets include France (95.7%) and Germany (2.1%).
- Top languages spoken are French (58%) followed by English (27.5%).
- A significant demographic segment is the Post-2000s (Gen Z/Alpha) group, representing 50% of guests.
Recommendations for Hosts
- Target domestic marketing efforts towards travelers from Toulouse and Paris.
- Tailor amenities and listing descriptions to appeal to the dominant Post-2000s (Gen Z/Alpha) demographic (e.g., highlight fast WiFi, smart home features, local guides).
- Highlight unique local experiences or amenities relevant to the primary guest profile.
- Consider seasonal promotions aligned with peak travel times for key origin markets.
Nearby Short-Term Rental Market Comparison
How does the Blars Airbnb market stack up against its neighbors? Compare key performance metrics like average monthly revenue, ADR, and occupancy rates in surrounding areas to understand the broader regional STR landscape.
| Market | Active Properties | Monthly Revenue | Daily Rate | Avg. Occupancy |
|---|---|---|---|---|
| Astaffort | 10 | $3,393 | $314.20 | 35% |
| Saint-Pierre-Roche | 11 | $2,627 | $166.21 | 48% |
| Eynesse | 14 | $2,564 | $282.87 | 36% |
| Bourrou | 10 | $2,475 | $247.57 | 36% |
| Saint-Jean-d'Alcapiès | 10 | $2,429 | $169.43 | 43% |
| Jayac | 11 | $2,388 | $202.75 | 40% |
| La Magdelaine-sur-Tarn | 10 | $2,383 | $243.17 | 32% |
| Lanta | 14 | $2,306 | $270.81 | 44% |
| Pont-de-Larn | 17 | $2,254 | $239.90 | 32% |
| Gout-Rossignol | 11 | $2,212 | $251.86 | 38% |