Bernis Airbnb Market Analysis 2025: Short Term Rental Data & Vacation Rental Statistics in Occitania, France
Is Airbnb profitable in Bernis in 2025? Explore comprehensive Airbnb analytics for Bernis, Occitania, France to uncover income potential. This 2025 STR market report for Bernis, based on AirROI data from April 2024 to March 2025, reveals key trends in the niche market of 23 active listings.
Whether you're considering an Airbnb investment in Bernis, optimizing your existing vacation rental, or exploring rental arbitrage opportunities, understanding the Bernis Airbnb data is crucial. Leveraging the low regulation environment is key to maximizing your short term rental income potential. Let's dive into the specifics.
Key Bernis Airbnb Performance Metrics Overview
Monthly Airbnb Revenue Variations & Income Potential in Bernis (2025)
Understanding the monthly revenue variations for Airbnb listings in Bernis is key to maximizing your short term rental income potential. Seasonality significantly impacts earnings. Our analysis, based on data from the past 12 months, shows that the peak revenue month for STRs in Bernis is typically August, while January often presents the lowest earnings, highlighting opportunities for strategic pricing adjustments during shoulder and low seasons. Explore the typical Airbnb income in Bernis across different performance tiers:
- Best-in-class properties (Top 10%) achieve $6,404+ monthly, often utilizing dynamic pricing and superior guest experiences.
- Strong performing properties (Top 25%) earn $2,325 or more, indicating effective management and desirable locations/amenities.
- Typical properties (Median) generate around $1,244 per month, representing the average market performance.
- Entry-level properties (Bottom 25%) see earnings around $608, often with potential for optimization.
Average Monthly Airbnb Earnings Trend in Bernis
Bernis Airbnb Occupancy Rate Trends (2025)
Maximize your bookings by understanding the Bernis STR occupancy trends. Seasonal demand shifts significantly influence how often properties are booked. Typically, Augustsees the highest demand (peak season occupancy), while January experiences the lowest (low season). Effective strategies, like adjusting minimum stays or offering promotions, can boost occupancy during slower periods. Here's how different property tiers perform in Bernis:
- Best-in-class properties (Top 10%) achieve 67%+ occupancy, indicating high desirability and potentially optimized availability.
- Strong performing properties (Top 25%) maintain 53% or higher occupancy, suggesting good market fit and guest satisfaction.
- Typical properties (Median) have an occupancy rate around 35%.
- Entry-level properties (Bottom 25%) average 21% occupancy, potentially facing higher vacancy.
Average Monthly Occupancy Rate Trend in Bernis
Average Daily Rate (ADR) Airbnb Trends in Bernis (2025)
Effective short term rental pricing strategy in Bernis involves understanding monthly ADR fluctuations. The Average Daily Rate (ADR) for Airbnb in Bernis typically peaks in August and dips lowest during March. Leveraging Airbnb dynamic pricing tools or strategies based on this seasonality can significantly boost revenue. Here's a look at the typical nightly rates achieved:
- Best-in-class properties (Top 10%) command rates of $320+ per night, often due to premium features or locations.
- Strong performing properties (Top 25%) achieve nightly rates of $257 or more.
- Typical properties (Median) charge around $117 per night.
- Entry-level properties (Bottom 25%) earn around $83 per night.
Average Daily Rate (ADR) Trend by Month in Bernis
Get Live Bernis Market Intelligence 👇

Explore Real-time Analytics
Airbnb Seasonality Analysis & Trends in Bernis (2025)
Peak Season (August, April, May)
- Revenue averages $3,820 per month
- Occupancy rates average 50.5%
- Daily rates average $210
Shoulder Season
- Revenue averages $2,503 per month
- Occupancy maintains around 39.3%
- Daily rates hold near $206
Low Season (January, March, November)
- Revenue drops to average $1,734 per month
- Occupancy decreases to average 21.8%
- Daily rates adjust to average $197
Seasonality Insights for Bernis
- The Airbnb seasonality in Bernis shows highly seasonal trends requiring careful strategy. While the sections above show seasonal averages, it's also insightful to look at the extremes:
- During the high season, the absolute peak month showcases Bernis's highest earning potential, with monthly revenues capable of climbing to $4,015, occupancy reaching a high of 75.7%, and ADRs peaking at $216.
- Conversely, the slowest single month of the year, typically falling within the low season, marks the market's lowest point. In this month, revenue might dip to $1,449, occupancy could drop to 15.8%, and ADRs may adjust down to $193.
- Understanding both the seasonal averages and these monthly peaks and troughs in revenue, occupancy, and ADR is crucial for maximizing your Airbnb profit potential in Bernis.
Seasonal Strategies for Maximizing Profit
- Peak Season: Maximize revenue through premium pricing and potentially longer minimum stays. Ensure high availability.
- Low Season: Offer competitive pricing, special promotions (e.g., extended stay discounts), and flexible cancellation policies. Target off-season travelers like remote workers or budget-conscious guests.
- Shoulder Seasons: Implement dynamic pricing that balances peak and low rates. Target weekend travelers or specific events. Offer slightly more flexible terms than peak season.
- Regularly analyze your own performance against these Bernis seasonality benchmarks and adjust your pricing and availability strategy accordingly.
Best Areas for Airbnb Investment in Bernis (2025)
Exploring the top neighborhoods for short-term rentals in Bernis? This section highlights key areas, outlining why they are attractive for hosts and guests, along with notable local attractions. Consider these locations based on your target guest profile and investment strategy.
| Neighborhood / Area | Why Host Here? (Target Guests & Appeal) | Key Attractions & Landmarks |
|---|---|---|
| Bernis Village Center | Charming village atmosphere with local shops, cafes, and historic architecture. Ideal for guests seeking a peaceful retreat in the picturesque Occitanie region. | Church of Bernis, Place de l'Église, Local markets, Nearby vineyards, Proximity to Nîmes and Montpellier |
| Gardanne | A tranquil area that offers a slice of local life while being close to larger cities. Popular for its rural charm and access to nature. | Village of Gardanne, Scenic countryside, Walking trails, Local wineries, Cultural festivals |
| Nîmes | A historical city famous for its Roman architecture. Attracts tourists interested in history, culture, and gastronomy. | Arenes de Nîmes, Maison Carrée, Jardins de la Fontaine, Pont du Gard, Nîmes Museum |
| Montpellier | A vibrant university city known for its youthful energy and cultural offerings. Great for attracting students and travelers. | Place de la Comédie, Montpellier Cathedral, Fabre Museum, Le Jardin des Plantes, Cultural events |
| Aigues-Mortes | A medieval fortified town near the sea, renowned for its historical significance and beautiful architecture. Popular with history buffs and tourists alike. | The medieval walls, Constance Tower, Saint-Louis Gate, Local seafood restaurants, Nearby beaches |
| Saint-Gilles | A small town rich in history, close to both the Mediterranean and nature parks. Ideal for guests looking for a combination of relaxation and exploration. | Saint-Gilles Abbey, Local festivals, Cycling paths, Proximity to Camargue Natural Regional Park, Birdwatching |
| La Grande-Motte | A modern coastal resort town that attracts beach lovers and families. Great for summer rentals due to its sandy beaches and leisure activities. | Beaches of La Grande-Motte, Port area, Jean Baumé Park, Water sports, Seaside promenade |
| Uzès | A stunning medieval town with artisanal markets and historical charm. Appeals to tourists looking for local art and culture. | Uzès Market, Duché d'Uzès, Place aux Herbes, The Roman Aqueduct, Local vineyards |
Understanding Airbnb License Requirements & STR Laws in Bernis (2025)
While Bernis, Occitania, France currently shows low STR regulations, specific Airbnb license requirements might still exist or change. Always verify the latest short term rental regulations and Airbnb license requirements directly with local government authorities for Bernis to ensure full compliance before hosting.
(Source: AirROI data, 2025, finding no licensed listings among those analyzed)
Top Performing Airbnb Properties in Bernis (2025)
Benchmark your potential! Explore examples of top-performing Airbnb properties in Bernisbased on Trailing Twelve Month (TTM) revenue. Analyze their characteristics, revenue, occupancy rate, and ADR to understand what drives success in this market.
Le Moulin Bérénice in Bernis (25 people)
Entire Place • 7 bedrooms

Mas des 2 Pins: La Pomme de pin
Entire Place • 3 bedrooms
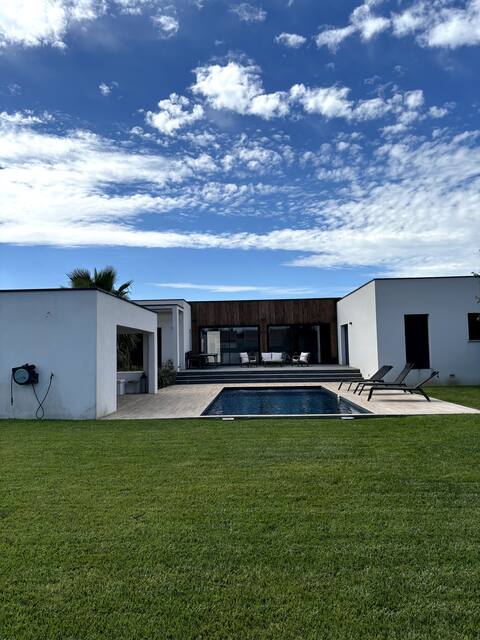
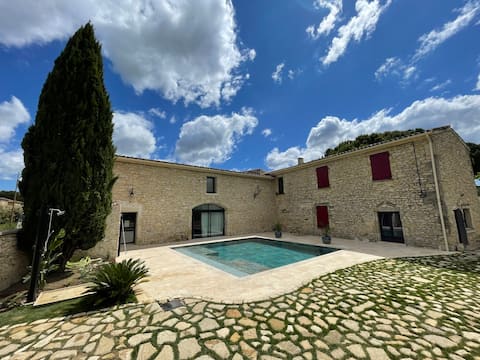
Contemporary villa with pool and large garden
Entire Place • 4 bedrooms
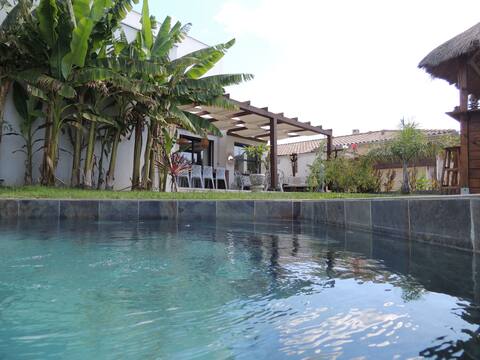
Bali trendy villa, Pool, 20 min from the beaches
Entire Place • 3 bedrooms

Elle Lui en Jacuzzi - Night with private hot tub
Entire Place • N/A
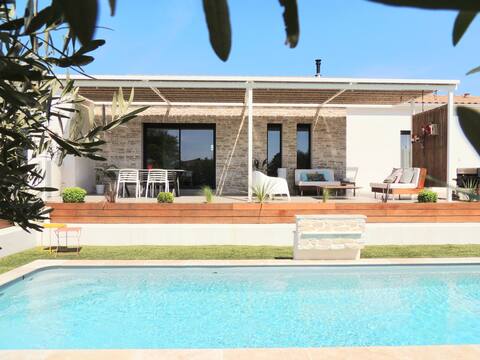
Pretty villa surrounded by olive trees
Entire Place • 3 bedrooms
Note: Performance varies based on location, size, amenities, seasonality, and management quality. Data reflects the past 12 months.
Top Performing Airbnb Hosts in Bernis (2025)
Learn from the best! This table showcases top-performing Airbnb hosts in Bernis based on the number of properties managed and estimated total revenue over the past year. Analyze their scale and performance metrics.
| Host Name | Properties | Grossing Revenue | Stay Reviews | Avg Rating |
|---|---|---|---|---|
| Fabrice | 1 | $171,425 | 4 | 5.00/5.0 |
| Seddir Et Frédérique | 1 | $40,646 | 24 | 5.00/5.0 |
| Lona | 1 | $32,454 | 14 | 4.50/5.0 |
| Audrey | 1 | $24,219 | 16 | 4.69/5.0 |
| Chris & Benoît | 1 | $18,888 | 487 | 4.81/5.0 |
| Fanny Adeline | 1 | $17,543 | 9 | 5.00/5.0 |
| Audrey Et Chedli | 1 | $17,420 | 7 | 4.86/5.0 |
| Chris | 1 | $15,463 | 14 | 4.86/5.0 |
| Host #389517285 | 1 | $15,248 | 0 | 0.00/5.0 |
| Host #152165797 | 1 | $14,901 | 0 | 0.00/5.0 |
Analyzing the strategies of top hosts, such as their property selection, pricing, and guest communication, can offer valuable lessons for optimizing your own Airbnb operations in Bernis.
Dive Deeper: Advanced Bernis STR Market Data (2025)
Ready to unlock more insights? AirROI provides access to advanced metrics and comprehensive Airbnb data for Bernis. Explore detailed analytics beyond this report to refine your investment strategy, optimize pricing, and maximize your vacation rental profits.
Explore Advanced MetricsBernis Short-Term Rental Market Composition (2025): Property & Room Types
Room Type Distribution
Property Type Distribution
Market Composition Insights for Bernis
- The Bernis Airbnb market composition is heavily skewed towards Entire Home/Apt listings, which make up 95.7% of the 23 active rentals. This indicates strong guest preference for privacy and space.
- Looking at the property type distribution in Bernis, House properties are the most common (65.2%), reflecting the local real estate landscape.
- Houses represent a significant 65.2% portion, catering likely to families or larger groups.
- Smaller segments like others (combined 4.3%) offer potential for unique stay experiences.
Bernis Airbnb Room Capacity Analysis (2025): Bedroom Distribution
Distribution of Listings by Number of Bedrooms
Room Capacity Insights for Bernis
- The dominant room capacity in Bernis is 3 bedrooms listings, making up 26.1% of the market. This suggests a strong demand for properties suitable for families or small groups.
- Together, 3 bedrooms and 1 bedroom properties represent 52.2% of the active Airbnb listings in Bernis, indicating a high concentration in these sizes.
- A significant 43.5% of listings offer 3+ bedrooms, catering to larger groups and families seeking more space in Bernis.
Bernis Vacation Rental Guest Capacity Trends (2025)
Distribution of Listings by Guest Capacity
Guest Capacity Insights for Bernis
- The most common guest capacity trend in Bernis vacation rentals is listings accommodating 4 guests (21.7%). This suggests the primary traveler segment is likely small families or groups.
- Properties designed for 4 guests and 6 guests dominate the Bernis STR market, accounting for 43.4% of listings.
- 52.1% of properties accommodate 6+ guests, serving the market segment for larger families or group travel in Bernis.
- On average, properties in Bernis are equipped to host 5.2 guests.
Bernis Airbnb Booking Patterns (2025): Available vs. Booked Days
Available Days Distribution
Booked Days Distribution
Booking Pattern Insights for Bernis
- The most common availability pattern in Bernis falls within the 271-366 days range, representing 56.5% of listings. This suggests many properties have significant open periods on their calendars.
- Approximately 86.9% of listings show high availability (181+ days open annually), indicating potential for increased bookings or specific owner usage patterns.
- For booked days, the 31-90 days range is most frequent in Bernis (43.5%), reflecting common guest stay durations or potential owner blocking patterns.
- A notable 13.0% of properties secure long booking periods (181+ days booked per year), highlighting successful long-term rental strategies or significant owner usage.
Bernis Airbnb Minimum Stay Requirements Analysis
Distribution of Listings by Minimum Night Requirement
1 Night
4 listings
18.2% of total
2 Nights
5 listings
22.7% of total
3 Nights
5 listings
22.7% of total
4-6 Nights
3 listings
13.6% of total
7-29 Nights
5 listings
22.7% of total
Key Insights
- The most prevalent minimum stay requirement in Bernis is 2 Nights, adopted by 22.7% of listings. This highlights the market's preference for shorter, flexible bookings.
Recommendations
- Align with the market by considering a 2 Nights minimum stay, as 22.7% of Bernis hosts use this setting.
- If feasible, allowing 1-night stays, especially midweek or during low season, could capture last-minute bookings, as only 18.2% currently do.
- Adjust minimum nights based on seasonality – potentially shorter during low season and longer during peak demand periods in Bernis.
Bernis Airbnb Cancellation Policy Trends Analysis (2025)
Flexible
4 listings
21.1% of total
Moderate
6 listings
31.6% of total
Firm
4 listings
21.1% of total
Strict
5 listings
26.3% of total
Cancellation Policy Insights for Bernis
- The prevailing Airbnb cancellation policy trend in Bernis is Moderate, used by 31.6% of listings.
- There's a relatively balanced mix between guest-friendly (52.7%) and stricter (47.4%) policies, offering choices for different guest needs.
Recommendations for Hosts
- Consider adopting a Moderate policy to align with the 31.6% market standard in Bernis.
- Regularly review your cancellation policy against competitors and market demand shifts in Bernis.
Bernis STR Booking Lead Time Analysis (2025)
Average Booking Lead Time by Month
Booking Lead Time Insights for Bernis
- The overall average booking lead time for vacation rentals in Bernis is 55 days.
- Guests book furthest in advance for stays during June (average 84 days), likely coinciding with peak travel demand or local events.
- The shortest booking windows occur for stays in February (average 15 days), indicating more last-minute travel plans during this time.
- Seasonally, Summer (77 days avg.) sees the longest lead times, while Winter (26 days avg.) has the shortest, reflecting typical travel planning cycles.
Recommendations for Hosts
- Use the overall average lead time (55 days) as a baseline for your pricing and availability strategy in Bernis.
- For June stays, consider implementing length-of-stay discounts or slightly higher rates for bookings made less than 84 days out to capitalize on advance planning.
- Target marketing efforts for the Summer season well in advance (at least 77 days) to capture early planners.
- Monitor your own booking lead times against these Bernis averages to identify opportunities for dynamic pricing adjustments.
Popular & Essential Airbnb Amenities in Bernis (2025)
Amenity Prevalence
Amenity Insights for Bernis
- Essential amenities in Bernis that guests expect include: Coffee maker, Heating, Wifi. Lacking these (any) could significantly impact bookings.
- Popular amenities like TV, Kitchen, Hot water are common but not universal. Offering these can provide a competitive edge.
Recommendations for Hosts
- Ensure your listing includes all essential amenities for Bernis: Coffee maker, Heating, Wifi.
- Prioritize adding missing essentials: Coffee maker, Heating, Wifi.
- Consider adding popular differentiators like TV or Kitchen to increase appeal.
- Highlight unique or less common amenities you offer (e.g., hot tub, dedicated workspace, EV charger) in your listing description and photos.
- Regularly check competitor amenities in Bernis to stay competitive.
Bernis Airbnb Guest Demographics & Profile Analysis (2025)
Guest Profile Summary for Bernis
- The typical guest profile for Airbnb in Bernis consists of primarily domestic travelers (86%), often arriving from nearby Marseille, typically belonging to the Post-2000s (Gen Z/Alpha) group (50%), primarily speaking French or English.
- Domestic travelers account for 86.3% of guests.
- Key international markets include France (86.3%) and United Kingdom (2.6%).
- Top languages spoken are French (49%) followed by English (31.4%).
- A significant demographic segment is the Post-2000s (Gen Z/Alpha) group, representing 50% of guests.
Recommendations for Hosts
- Target domestic marketing efforts towards travelers from Marseille and Nîmes.
- Tailor amenities and listing descriptions to appeal to the dominant Post-2000s (Gen Z/Alpha) demographic (e.g., highlight fast WiFi, smart home features, local guides).
- Highlight unique local experiences or amenities relevant to the primary guest profile.
- Consider seasonal promotions aligned with peak travel times for key origin markets.
Nearby Short-Term Rental Market Comparison
How does the Bernis Airbnb market stack up against its neighbors? Compare key performance metrics like average monthly revenue, ADR, and occupancy rates in surrounding areas to understand the broader regional STR landscape.
| Market | Active Properties | Monthly Revenue | Daily Rate | Avg. Occupancy |
|---|---|---|---|---|
| Villeneuvette | 13 | $4,150 | $337.56 | 44% |
| Divajeu | 19 | $3,941 | $410.65 | 42% |
| Chantepérier | 20 | $3,057 | $281.60 | 37% |
| Rupià | 11 | $3,046 | $386.95 | 40% |
| Gordes | 225 | $2,913 | $366.32 | 43% |
| Redessan | 19 | $2,834 | $334.82 | 34% |
| Fontarèches | 11 | $2,802 | $525.31 | 34% |
| Ménerbes | 97 | $2,800 | $453.86 | 41% |
| La Bruguière | 14 | $2,732 | $277.64 | 50% |
| Soyans | 12 | $2,721 | $193.55 | 45% |