Baillargues Airbnb Market Analysis 2025: Short Term Rental Data & Vacation Rental Statistics in Occitania, France
Is Airbnb profitable in Baillargues in 2025? Explore comprehensive Airbnb analytics for Baillargues, Occitania, France to uncover income potential. This 2025 STR market report for Baillargues, based on AirROI data from April 2024 to March 2025, reveals key trends in the niche market of 80 active listings.
Whether you're considering an Airbnb investment in Baillargues, optimizing your existing vacation rental, or exploring rental arbitrage opportunities, understanding the Baillargues Airbnb data is crucial. Leveraging the low regulation environment is key to maximizing your short term rental income potential. Let's dive into the specifics.
Key Baillargues Airbnb Performance Metrics Overview
Monthly Airbnb Revenue Variations & Income Potential in Baillargues (2025)
Understanding the monthly revenue variations for Airbnb listings in Baillargues is key to maximizing your short term rental income potential. Seasonality significantly impacts earnings. Our analysis, based on data from the past 12 months, shows that the peak revenue month for STRs in Baillargues is typically August, while March often presents the lowest earnings, highlighting opportunities for strategic pricing adjustments during shoulder and low seasons. Explore the typical Airbnb income in Baillargues across different performance tiers:
- Best-in-class properties (Top 10%) achieve $4,560+ monthly, often utilizing dynamic pricing and superior guest experiences.
- Strong performing properties (Top 25%) earn $2,355 or more, indicating effective management and desirable locations/amenities.
- Typical properties (Median) generate around $1,061 per month, representing the average market performance.
- Entry-level properties (Bottom 25%) see earnings around $522, often with potential for optimization.
Average Monthly Airbnb Earnings Trend in Baillargues
Baillargues Airbnb Occupancy Rate Trends (2025)
Maximize your bookings by understanding the Baillargues STR occupancy trends. Seasonal demand shifts significantly influence how often properties are booked. Typically, Augustsees the highest demand (peak season occupancy), while June experiences the lowest (low season). Effective strategies, like adjusting minimum stays or offering promotions, can boost occupancy during slower periods. Here's how different property tiers perform in Baillargues:
- Best-in-class properties (Top 10%) achieve 79%+ occupancy, indicating high desirability and potentially optimized availability.
- Strong performing properties (Top 25%) maintain 62% or higher occupancy, suggesting good market fit and guest satisfaction.
- Typical properties (Median) have an occupancy rate around 38%.
- Entry-level properties (Bottom 25%) average 16% occupancy, potentially facing higher vacancy.
Average Monthly Occupancy Rate Trend in Baillargues
Average Daily Rate (ADR) Airbnb Trends in Baillargues (2025)
Effective short term rental pricing strategy in Baillargues involves understanding monthly ADR fluctuations. The Average Daily Rate (ADR) for Airbnb in Baillargues typically peaks in August and dips lowest during March. Leveraging Airbnb dynamic pricing tools or strategies based on this seasonality can significantly boost revenue. Here's a look at the typical nightly rates achieved:
- Best-in-class properties (Top 10%) command rates of $387+ per night, often due to premium features or locations.
- Strong performing properties (Top 25%) achieve nightly rates of $232 or more.
- Typical properties (Median) charge around $108 per night.
- Entry-level properties (Bottom 25%) earn around $62 per night.
Average Daily Rate (ADR) Trend by Month in Baillargues
Get Live Baillargues Market Intelligence 👇

Explore Real-time Analytics
Airbnb Seasonality Analysis & Trends in Baillargues (2025)
Peak Season (August, July, September)
- Revenue averages $2,728 per month
- Occupancy rates average 52.7%
- Daily rates average $190
Shoulder Season
- Revenue averages $1,839 per month
- Occupancy maintains around 38.0%
- Daily rates hold near $177
Low Season (January, February, March)
- Revenue drops to average $1,019 per month
- Occupancy decreases to average 34.4%
- Daily rates adjust to average $151
Seasonality Insights for Baillargues
- The Airbnb seasonality in Baillargues shows highly seasonal trends requiring careful strategy. While the sections above show seasonal averages, it's also insightful to look at the extremes:
- During the high season, the absolute peak month showcases Baillargues's highest earning potential, with monthly revenues capable of climbing to $3,167, occupancy reaching a high of 58.9%, and ADRs peaking at $191.
- Conversely, the slowest single month of the year, typically falling within the low season, marks the market's lowest point. In this month, revenue might dip to $902, occupancy could drop to 30.7%, and ADRs may adjust down to $150.
- Understanding both the seasonal averages and these monthly peaks and troughs in revenue, occupancy, and ADR is crucial for maximizing your Airbnb profit potential in Baillargues.
Seasonal Strategies for Maximizing Profit
- Peak Season: Maximize revenue through premium pricing and potentially longer minimum stays. Ensure high availability.
- Low Season: Offer competitive pricing, special promotions (e.g., extended stay discounts), and flexible cancellation policies. Target off-season travelers like remote workers or budget-conscious guests.
- Shoulder Seasons: Implement dynamic pricing that balances peak and low rates. Target weekend travelers or specific events. Offer slightly more flexible terms than peak season.
- Regularly analyze your own performance against these Baillargues seasonality benchmarks and adjust your pricing and availability strategy accordingly.
Best Areas for Airbnb Investment in Baillargues (2025)
Exploring the top neighborhoods for short-term rentals in Baillargues? This section highlights key areas, outlining why they are attractive for hosts and guests, along with notable local attractions. Consider these locations based on your target guest profile and investment strategy.
| Neighborhood / Area | Why Host Here? (Target Guests & Appeal) | Key Attractions & Landmarks |
|---|---|---|
| Historic Center | Baillargues boasts a charming historic center with a rich history and traditional architecture. It's a great location for travelers interested in culture and local experiences. | Saint John the Baptist Church, Place de la République, quaint local shops, traditional cafés |
| Proximity to Montpellier | Located just a short drive from Montpellier, Baillargues offers easy access to a major city while providing a quieter, more relaxed atmosphere for visitors. | Montpellier city center, Place de la Comédie, Botanical Garden of Frontignan, Antigone District |
| Wine Routes | Baillargues is situated amidst several renowned wine regions, making it an attractive destination for wine enthusiasts and tourists looking to explore local vineyards. | Languedoc wine region, wine tasting tours, local vineyards, gourmet dining experiences |
| Nearby Beaches | With the Mediterranean coastline just a short drive away, Baillargues serves as a convenient base for beachgoers looking to enjoy the sun and sea. | Palavas-les-Flots, La Grande Motte, Carnon Beach, Montpellier Plage |
| Local Events | The town hosts various cultural and seasonal events that draw visitors throughout the year, providing unique local experiences. | Summer festivals, Christmas markets, local art exhibitions, music concerts |
| Sports Facilities | Baillargues features numerous sports facilities and is particularly known for horse riding and equestrian events, appealing to sports enthusiasts. | Local equestrian clubs, sports arenas, cycling paths, green parks |
| Quiet Residential Areas | The town offers peaceful residential zones that are perfect for families or travelers seeking a serene getaway, away from the hustle and bustle. | family-friendly parks, walking trails, local bakeries, small community events |
| Culinary Scene | Baillargues has a growing culinary scene with restaurants that showcase local cuisine, attracting food lovers. | traditional French bistros, local markets, culinary festivals, food tours |
Understanding Airbnb License Requirements & STR Laws in Baillargues (2025)
While Baillargues, Occitania, France currently shows low STR regulations, specific Airbnb license requirements might still exist or change. Always verify the latest short term rental regulations and Airbnb license requirements directly with local government authorities for Baillargues to ensure full compliance before hosting.
(Source: AirROI data, 2025, based on 4% licensed listings)
Top Performing Airbnb Properties in Baillargues (2025)
Benchmark your potential! Explore examples of top-performing Airbnb properties in Baillarguesbased on Trailing Twelve Month (TTM) revenue. Analyze their characteristics, revenue, occupancy rate, and ADR to understand what drives success in this market.
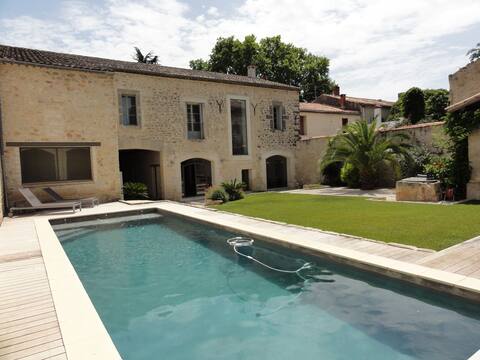
Luxury Villa with Large swimming pool
Entire Place • 6 bedrooms

Beautiful Barn with Exterior
Entire Place • 7 bedrooms

La Contemporaine
Entire Place • 2 bedrooms

Master house completely renovated.
Entire Place • 3 bedrooms

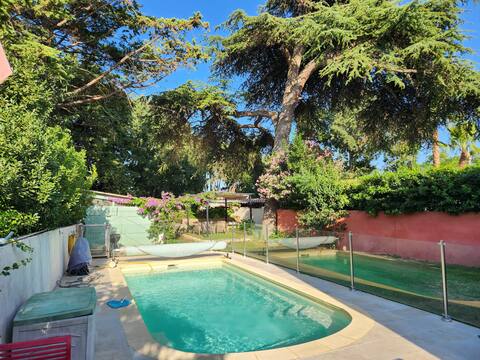
Pretty house 15 mins from the sea
Entire Place • 3 bedrooms
House near Montpellier for 1 or 2 families
Entire Place • 6 bedrooms
Note: Performance varies based on location, size, amenities, seasonality, and management quality. Data reflects the past 12 months.
Top Performing Airbnb Hosts in Baillargues (2025)
Learn from the best! This table showcases top-performing Airbnb hosts in Baillargues based on the number of properties managed and estimated total revenue over the past year. Analyze their scale and performance metrics.
| Host Name | Properties | Grossing Revenue | Stay Reviews | Avg Rating |
|---|---|---|---|---|
| Marc | 1 | $108,340 | 15 | 5.00/5.0 |
| Sabine | 1 | $71,797 | 43 | 4.81/5.0 |
| Kevin Et Marjorie | 2 | $52,483 | 35 | 4.80/5.0 |
| Simon | 1 | $49,667 | 8 | 4.50/5.0 |
| Célia | 1 | $38,918 | 7 | 4.57/5.0 |
| Romain | 1 | $38,768 | 17 | 4.71/5.0 |
| Sabine | 1 | $37,337 | 64 | 4.88/5.0 |
| Tudorel | 2 | $35,123 | 79 | 4.73/5.0 |
| Françoise | 1 | $32,448 | 8 | 4.88/5.0 |
| Host #406498559 | 3 | $31,875 | 1 | 0.00/5.0 |
Analyzing the strategies of top hosts, such as their property selection, pricing, and guest communication, can offer valuable lessons for optimizing your own Airbnb operations in Baillargues.
Dive Deeper: Advanced Baillargues STR Market Data (2025)
Ready to unlock more insights? AirROI provides access to advanced metrics and comprehensive Airbnb data for Baillargues. Explore detailed analytics beyond this report to refine your investment strategy, optimize pricing, and maximize your vacation rental profits.
Explore Advanced MetricsBaillargues Short-Term Rental Market Composition (2025): Property & Room Types
Room Type Distribution
Property Type Distribution
Market Composition Insights for Baillargues
- The Baillargues Airbnb market composition is heavily skewed towards Entire Home/Apt listings, which make up 78.8% of the 80 active rentals. This indicates strong guest preference for privacy and space.
- Looking at the property type distribution in Baillargues, House properties are the most common (66.3%), reflecting the local real estate landscape.
- Houses represent a significant 66.3% portion, catering likely to families or larger groups.
- The presence of 6.3% Hotel/Boutique listings indicates integration with traditional hospitality.
- Smaller segments like others, unique stays (combined 3.8%) offer potential for unique stay experiences.
Baillargues Airbnb Room Capacity Analysis (2025): Bedroom Distribution
Distribution of Listings by Number of Bedrooms
Room Capacity Insights for Baillargues
- The dominant room capacity in Baillargues is 1 bedroom listings, making up 28.7% of the market. This suggests a strong demand for properties suitable for couples or solo travelers.
- Together, 1 bedroom and 2 bedrooms properties represent 48.7% of the active Airbnb listings in Baillargues, indicating a high concentration in these sizes.
- A significant 31.4% of listings offer 3+ bedrooms, catering to larger groups and families seeking more space in Baillargues.
Baillargues Vacation Rental Guest Capacity Trends (2025)
Distribution of Listings by Guest Capacity
Guest Capacity Insights for Baillargues
- The most common guest capacity trend in Baillargues vacation rentals is listings accommodating 2 guests (23.8%). This suggests the primary traveler segment is likely couples or solo travelers.
- Properties designed for 2 guests and 6 guests dominate the Baillargues STR market, accounting for 45.1% of listings.
- 36.4% of properties accommodate 6+ guests, serving the market segment for larger families or group travel in Baillargues.
- On average, properties in Baillargues are equipped to host 3.8 guests.
Baillargues Airbnb Booking Patterns (2025): Available vs. Booked Days
Available Days Distribution
Booked Days Distribution
Booking Pattern Insights for Baillargues
- The most common availability pattern in Baillargues falls within the 271-366 days range, representing 48.8% of listings. This suggests many properties have significant open periods on their calendars.
- Approximately 81.3% of listings show high availability (181+ days open annually), indicating potential for increased bookings or specific owner usage patterns.
- For booked days, the 91-180 days range is most frequent in Baillargues (31.3%), reflecting common guest stay durations or potential owner blocking patterns.
- A notable 20.0% of properties secure long booking periods (181+ days booked per year), highlighting successful long-term rental strategies or significant owner usage.
Baillargues Airbnb Minimum Stay Requirements Analysis
Distribution of Listings by Minimum Night Requirement
1 Night
19 listings
25% of total
2 Nights
22 listings
28.9% of total
3 Nights
15 listings
19.7% of total
4-6 Nights
12 listings
15.8% of total
7-29 Nights
5 listings
6.6% of total
30+ Nights
3 listings
3.9% of total
Key Insights
- The most prevalent minimum stay requirement in Baillargues is 2 Nights, adopted by 28.9% of listings. This highlights the market's preference for shorter, flexible bookings.
Recommendations
- Align with the market by considering a 2 Nights minimum stay, as 28.9% of Baillargues hosts use this setting.
- If feasible, allowing 1-night stays, especially midweek or during low season, could capture last-minute bookings, as only 25% currently do.
- Adjust minimum nights based on seasonality – potentially shorter during low season and longer during peak demand periods in Baillargues.
Baillargues Airbnb Cancellation Policy Trends Analysis (2025)
Flexible
22 listings
34.4% of total
Moderate
19 listings
29.7% of total
Firm
13 listings
20.3% of total
Strict
10 listings
15.6% of total
Cancellation Policy Insights for Baillargues
- The prevailing Airbnb cancellation policy trend in Baillargues is Flexible, used by 34.4% of listings.
- There's a relatively balanced mix between guest-friendly (64.1%) and stricter (35.9%) policies, offering choices for different guest needs.
Recommendations for Hosts
- Consider adopting a Flexible policy to align with the 34.4% market standard in Baillargues.
- Regularly review your cancellation policy against competitors and market demand shifts in Baillargues.
Baillargues STR Booking Lead Time Analysis (2025)
Average Booking Lead Time by Month
Booking Lead Time Insights for Baillargues
- The overall average booking lead time for vacation rentals in Baillargues is 55 days.
- Guests book furthest in advance for stays during June (average 98 days), likely coinciding with peak travel demand or local events.
- The shortest booking windows occur for stays in November (average 34 days), indicating more last-minute travel plans during this time.
- Seasonally, Summer (83 days avg.) sees the longest lead times, while Fall (41 days avg.) has the shortest, reflecting typical travel planning cycles.
Recommendations for Hosts
- Use the overall average lead time (55 days) as a baseline for your pricing and availability strategy in Baillargues.
- For June stays, consider implementing length-of-stay discounts or slightly higher rates for bookings made less than 98 days out to capitalize on advance planning.
- Target marketing efforts for the Summer season well in advance (at least 83 days) to capture early planners.
- Monitor your own booking lead times against these Baillargues averages to identify opportunities for dynamic pricing adjustments.
Popular & Essential Airbnb Amenities in Baillargues (2025)
Amenity Prevalence
Amenity Insights for Baillargues
- Essential amenities in Baillargues that guests expect include: Kitchen, Wifi. Lacking these (any) could significantly impact bookings.
- Popular amenities like Hot water, Heating, TV are common but not universal. Offering these can provide a competitive edge.
Recommendations for Hosts
- Ensure your listing includes all essential amenities for Baillargues: Kitchen, Wifi.
- Prioritize adding missing essentials: Kitchen, Wifi.
- Consider adding popular differentiators like Hot water or Heating to increase appeal.
- Highlight unique or less common amenities you offer (e.g., hot tub, dedicated workspace, EV charger) in your listing description and photos.
- Regularly check competitor amenities in Baillargues to stay competitive.
Baillargues Airbnb Guest Demographics & Profile Analysis (2025)
Guest Profile Summary for Baillargues
- The typical guest profile for Airbnb in Baillargues consists of primarily domestic travelers (88%), often arriving from nearby Paris, typically belonging to the Post-2000s (Gen Z/Alpha) group (50%), primarily speaking French or English.
- Domestic travelers account for 88.3% of guests.
- Key international markets include France (88.3%) and Germany (3.3%).
- Top languages spoken are French (45.6%) followed by English (30.5%).
- A significant demographic segment is the Post-2000s (Gen Z/Alpha) group, representing 50% of guests.
Recommendations for Hosts
- Target domestic marketing efforts towards travelers from Paris and Montpellier.
- Tailor amenities and listing descriptions to appeal to the dominant Post-2000s (Gen Z/Alpha) demographic (e.g., highlight fast WiFi, smart home features, local guides).
- Highlight unique local experiences or amenities relevant to the primary guest profile.
- Consider seasonal promotions aligned with peak travel times for key origin markets.
Nearby Short-Term Rental Market Comparison
How does the Baillargues Airbnb market stack up against its neighbors? Compare key performance metrics like average monthly revenue, ADR, and occupancy rates in surrounding areas to understand the broader regional STR landscape.
| Market | Active Properties | Monthly Revenue | Daily Rate | Avg. Occupancy |
|---|---|---|---|---|
| Villeneuvette | 13 | $4,150 | $337.56 | 44% |
| Divajeu | 19 | $3,941 | $410.65 | 42% |
| Chantepérier | 20 | $3,057 | $281.60 | 37% |
| Rupià | 11 | $3,046 | $386.95 | 40% |
| Gordes | 225 | $2,913 | $366.32 | 43% |
| Redessan | 19 | $2,834 | $334.82 | 34% |
| Fontarèches | 11 | $2,802 | $525.31 | 34% |
| Ménerbes | 97 | $2,800 | $453.86 | 41% |
| La Bruguière | 14 | $2,732 | $277.64 | 50% |
| Soyans | 12 | $2,721 | $193.55 | 45% |