Aleu Airbnb Market Analysis 2025: Short Term Rental Data & Vacation Rental Statistics in Occitania, France
Is Airbnb profitable in Aleu in 2025? Explore comprehensive Airbnb analytics for Aleu, Occitania, France to uncover income potential. This 2025 STR market report for Aleu, based on AirROI data from April 2024 to March 2025, reveals key trends in the niche market of 17 active listings.
Whether you're considering an Airbnb investment in Aleu, optimizing your existing vacation rental, or exploring rental arbitrage opportunities, understanding the Aleu Airbnb data is crucial. Understanding the local regulations is key to maximizing your short term rental income potential. Let's dive into the specifics.
Key Aleu Airbnb Performance Metrics Overview
Monthly Airbnb Revenue Variations & Income Potential in Aleu (2025)
Understanding the monthly revenue variations for Airbnb listings in Aleu is key to maximizing your short term rental income potential. Seasonality significantly impacts earnings. Our analysis, based on data from the past 12 months, shows that the peak revenue month for STRs in Aleu is typically August, while February often presents the lowest earnings, highlighting opportunities for strategic pricing adjustments during shoulder and low seasons. Explore the typical Airbnb income in Aleu across different performance tiers:
- Best-in-class properties (Top 10%) achieve $2,737+ monthly, often utilizing dynamic pricing and superior guest experiences.
- Strong performing properties (Top 25%) earn $1,664 or more, indicating effective management and desirable locations/amenities.
- Typical properties (Median) generate around $1,028 per month, representing the average market performance.
- Entry-level properties (Bottom 25%) see earnings around $657, often with potential for optimization.
Average Monthly Airbnb Earnings Trend in Aleu
Aleu Airbnb Occupancy Rate Trends (2025)
Maximize your bookings by understanding the Aleu STR occupancy trends. Seasonal demand shifts significantly influence how often properties are booked. Typically, Augustsees the highest demand (peak season occupancy), while April experiences the lowest (low season). Effective strategies, like adjusting minimum stays or offering promotions, can boost occupancy during slower periods. Here's how different property tiers perform in Aleu:
- Best-in-class properties (Top 10%) achieve 69%+ occupancy, indicating high desirability and potentially optimized availability.
- Strong performing properties (Top 25%) maintain 55% or higher occupancy, suggesting good market fit and guest satisfaction.
- Typical properties (Median) have an occupancy rate around 36%.
- Entry-level properties (Bottom 25%) average 24% occupancy, potentially facing higher vacancy.
Average Monthly Occupancy Rate Trend in Aleu
Average Daily Rate (ADR) Airbnb Trends in Aleu (2025)
Effective short term rental pricing strategy in Aleu involves understanding monthly ADR fluctuations. The Average Daily Rate (ADR) for Airbnb in Aleu typically peaks in July and dips lowest during March. Leveraging Airbnb dynamic pricing tools or strategies based on this seasonality can significantly boost revenue. Here's a look at the typical nightly rates achieved:
- Best-in-class properties (Top 10%) command rates of $135+ per night, often due to premium features or locations.
- Strong performing properties (Top 25%) achieve nightly rates of $112 or more.
- Typical properties (Median) charge around $93 per night.
- Entry-level properties (Bottom 25%) earn around $68 per night.
Average Daily Rate (ADR) Trend by Month in Aleu
Get Live Aleu Market Intelligence 👇

Explore Real-time Analytics
Airbnb Seasonality Analysis & Trends in Aleu (2025)
Peak Season (August, July, December)
- Revenue averages $2,140 per month
- Occupancy rates average 61.0%
- Daily rates average $102
Shoulder Season
- Revenue averages $1,393 per month
- Occupancy maintains around 34.3%
- Daily rates hold near $100
Low Season (January, February, November)
- Revenue drops to average $1,125 per month
- Occupancy decreases to average 32.1%
- Daily rates adjust to average $93
Seasonality Insights for Aleu
- The Airbnb seasonality in Aleu shows highly seasonal trends requiring careful strategy. While the sections above show seasonal averages, it's also insightful to look at the extremes:
- During the high season, the absolute peak month showcases Aleu's highest earning potential, with monthly revenues capable of climbing to $2,483, occupancy reaching a high of 73.3%, and ADRs peaking at $106.
- Conversely, the slowest single month of the year, typically falling within the low season, marks the market's lowest point. In this month, revenue might dip to $1,001, occupancy could drop to 26.0%, and ADRs may adjust down to $89.
- Understanding both the seasonal averages and these monthly peaks and troughs in revenue, occupancy, and ADR is crucial for maximizing your Airbnb profit potential in Aleu.
Seasonal Strategies for Maximizing Profit
- Peak Season: Maximize revenue through premium pricing and potentially longer minimum stays. Ensure high availability.
- Low Season: Offer competitive pricing, special promotions (e.g., extended stay discounts), and flexible cancellation policies. Target off-season travelers like remote workers or budget-conscious guests.
- Shoulder Seasons: Implement dynamic pricing that balances peak and low rates. Target weekend travelers or specific events. Offer slightly more flexible terms than peak season.
- Regularly analyze your own performance against these Aleu seasonality benchmarks and adjust your pricing and availability strategy accordingly.
Best Areas for Airbnb Investment in Aleu (2025)
Exploring the top neighborhoods for short-term rentals in Aleu? This section highlights key areas, outlining why they are attractive for hosts and guests, along with notable local attractions. Consider these locations based on your target guest profile and investment strategy.
| Neighborhood / Area | Why Host Here? (Target Guests & Appeal) | Key Attractions & Landmarks |
|---|---|---|
| Carcassonne | Famous for its medieval fortress and historical significance, Carcassonne attracts tourists interested in history and culture. The stunning architecture and rich heritage make it an ideal spot for Airbnb hosting. | Cité de Carcassonne, Basilica of Saint-Nazaire, Carcassonne Museum, Canal du Midi, Château Comtal, Pont Vieux |
| Toulouse | Known as 'La Ville Rose', Toulouse is vibrant with culture, aerospace industries, and a booming student population. It offers a mix of historical sites and modern attractions, making it appealing to various guests. | Capitole de Toulouse, Basilique Saint-Sernin, Cité de l'Espace, Les Abattoirs, Pont Saint-Pierre, Musée des Augustins |
| Montpellier | A lively university city with a strong student presence. Montpellier combines historical charm with modern flair making it an attractive location for short-term rentals. | Place de la Comédie, Montpellier Cathedral, Musée Fabre, Jardin des Plantes, Antigone District, Le Petit Bateau |
| Nîmes | Home to well-preserved Roman monuments, Nîmes attracts history buffs and tourists interested in ancient culture. The city's stunning architecture and history provide a unique backdrop for vacationers. | Maison Carrée, Arenes de Nîmes, Jardins de la Fontaine, Temple de Diane, Pont du Gard, Musée de la Romanité |
| Avignon | Famous for its historic Papal Palace and annual theatre festival, Avignon attracts arts and culture lovers, making it a prime location for Airbnb investments. | Palais des Papes, Pont Saint-Bénézet, Avignon Festival, Rocher des Doms, Musée Calvet, Cathedral of Avignon |
| Albi | Renowned for its impressive red-brick architecture and the UNESCO-listed Albi Cathedral, Albi is an attractive destination for visitors interested in art and history. | Sainte-Cécile Cathedral, Toulouse-Lautrec Museum, Palais de la Berbie, Old Bridge, Castelnau-de-Montmiral, Jumping International d'Albi |
| Collioure | A picturesque coastal village known for its art scene and charming harbor, Collioure is popular among tourists seeking relaxation and beauty, perfect for a vacation rental. | Collioure Beach, Château Royal de Collioure, Church of Notre-Dame-des-Anges, Fort Saint-Elme, Musee d'Art Moderne, Les Coves de Llavanera |
| Sète | A vibrant port town known for its seafood and stunning canals, Sète is an attractive seaside destination with a unique cultural atmosphere, making it great for Airbnb hosting. | Mont Saint Clair, Musee Paul Valery, Canal Royal, Cimetière marin, Plage de Sète, Festival de chansons |
Understanding Airbnb License Requirements & STR Laws in Aleu (2025)
With 12% of listings showing registration in 2025, understanding potential Airbnb license requirements is crucial in Aleu. Always verify the latest short term rental regulations and Airbnb license requirements directly with local government authorities for Aleu to ensure full compliance before hosting.
(Source: AirROI data, 2025, based on 12% licensed listings)
Top Performing Airbnb Properties in Aleu (2025)
Benchmark your potential! Explore examples of top-performing Airbnb properties in Aleubased on Trailing Twelve Month (TTM) revenue. Analyze their characteristics, revenue, occupancy rate, and ADR to understand what drives success in this market.
La Maison Prats: between nature and well-being.
Entire Place • 1 bedroom
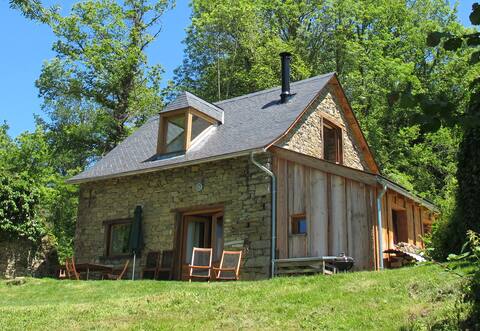
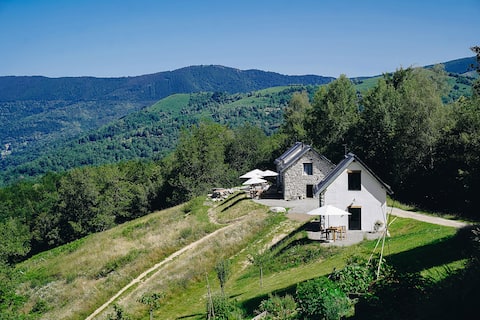
Barn with magnificent views of the mountains
Entire Place • 1 bedroom
Gîtes Libellule - Gîte Chouette
Entire Place • 2 bedrooms
Chalet apartment, independent mountain terrace
Entire Place • 1 bedroom
Le petit gite à Jourtau
Entire Place • 2 bedrooms

Facing the Valier, studio with terrace ,La Bernadole
Entire Place • 1 bedroom
Note: Performance varies based on location, size, amenities, seasonality, and management quality. Data reflects the past 12 months.
Top Performing Airbnb Hosts in Aleu (2025)
Learn from the best! This table showcases top-performing Airbnb hosts in Aleu based on the number of properties managed and estimated total revenue over the past year. Analyze their scale and performance metrics.
| Host Name | Properties | Grossing Revenue | Stay Reviews | Avg Rating |
|---|---|---|---|---|
| La Maison Prats | 1 | $69,921 | 98 | 5.00/5.0 |
| Sandrine | 2 | $40,938 | 497 | 4.91/5.0 |
| Virginie | 3 | $37,870 | 138 | 5.00/5.0 |
| Becky | 3 | $33,376 | 139 | 4.82/5.0 |
| Frederick | 3 | $24,896 | 240 | 4.84/5.0 |
| Jacques | 1 | $18,723 | 133 | 4.92/5.0 |
| Anne Marie | 1 | $9,103 | 188 | 4.87/5.0 |
| Nadine | 1 | $5,762 | 17 | 4.94/5.0 |
| Nathalie | 1 | $4,299 | 11 | 4.18/5.0 |
| Host #345689979 | 1 | $3,675 | 0 | 0.00/5.0 |
Analyzing the strategies of top hosts, such as their property selection, pricing, and guest communication, can offer valuable lessons for optimizing your own Airbnb operations in Aleu.
Dive Deeper: Advanced Aleu STR Market Data (2025)
Ready to unlock more insights? AirROI provides access to advanced metrics and comprehensive Airbnb data for Aleu. Explore detailed analytics beyond this report to refine your investment strategy, optimize pricing, and maximize your vacation rental profits.
Explore Advanced MetricsAleu Short-Term Rental Market Composition (2025): Property & Room Types
Room Type Distribution
Property Type Distribution
Market Composition Insights for Aleu
- The Aleu Airbnb market composition is heavily skewed towards Entire Home/Apt listings, which make up 88.2% of the 17 active rentals. This indicates strong guest preference for privacy and space.
- Looking at the property type distribution in Aleu, House properties are the most common (47.1%), reflecting the local real estate landscape.
- Houses represent a significant 47.1% portion, catering likely to families or larger groups.
- The presence of 11.8% Hotel/Boutique listings indicates integration with traditional hospitality.
Aleu Airbnb Room Capacity Analysis (2025): Bedroom Distribution
Distribution of Listings by Number of Bedrooms
Room Capacity Insights for Aleu
- The dominant room capacity in Aleu is 1 bedroom listings, making up 58.8% of the market. This suggests a strong demand for properties suitable for couples or solo travelers.
- Together, 1 bedroom and 2 bedrooms properties represent 82.3% of the active Airbnb listings in Aleu, indicating a high concentration in these sizes.
- With over half the market (58.8%) consisting of studios or 1-bedroom units, Aleu is particularly well-suited for individuals or couples.
Aleu Vacation Rental Guest Capacity Trends (2025)
Distribution of Listings by Guest Capacity
Guest Capacity Insights for Aleu
- The most common guest capacity trend in Aleu vacation rentals is listings accommodating 2 guests (47.1%). This suggests the primary traveler segment is likely couples or solo travelers.
- Properties designed for 2 guests and 4 guests dominate the Aleu STR market, accounting for 76.5% of listings.
- A significant 47.1% of listings cater specifically to 1-2 guests, highlighting strong demand from couples and solo travelers in Aleu.
- 17.6% of properties accommodate 6+ guests, serving the market segment for larger families or group travel in Aleu.
- On average, properties in Aleu are equipped to host 3.4 guests.
Aleu Airbnb Booking Patterns (2025): Available vs. Booked Days
Available Days Distribution
Booked Days Distribution
Booking Pattern Insights for Aleu
- The most common availability pattern in Aleu falls within the 181-270 days range, representing 47.1% of listings. This suggests many properties have significant open periods on their calendars.
- Approximately 88.3% of listings show high availability (181+ days open annually), indicating potential for increased bookings or specific owner usage patterns.
- For booked days, the 91-180 days range is most frequent in Aleu (41.2%), reflecting common guest stay durations or potential owner blocking patterns.
- A notable 17.7% of properties secure long booking periods (181+ days booked per year), highlighting successful long-term rental strategies or significant owner usage.
Aleu Airbnb Minimum Stay Requirements Analysis
Distribution of Listings by Minimum Night Requirement
1 Night
5 listings
31.3% of total
2 Nights
7 listings
43.8% of total
30+ Nights
4 listings
25% of total
Key Insights
- The most prevalent minimum stay requirement in Aleu is 2 Nights, adopted by 43.8% of listings. This highlights the market's preference for shorter, flexible bookings.
- A strong majority (75.1%) of the Aleu Airbnb data shows acceptance of very short stays (1-2 nights), indicating a dynamic, high-turnover market.
- A significant segment (25%) caters to monthly stays (30+ nights) in Aleu, pointing to opportunities in the extended-stay market.
Recommendations
- Align with the market by considering a 2 Nights minimum stay, as 43.8% of Aleu hosts use this setting.
- Explore offering discounts for stays of 30+ nights to attract the 25% of the market seeking extended stays.
- Adjust minimum nights based on seasonality – potentially shorter during low season and longer during peak demand periods in Aleu.
Aleu Airbnb Cancellation Policy Trends Analysis (2025)
Super Strict 30 Days
3 listings
18.8% of total
Flexible
2 listings
12.5% of total
Moderate
4 listings
25% of total
Strict
7 listings
43.8% of total
Cancellation Policy Insights for Aleu
- The prevailing Airbnb cancellation policy trend in Aleu is Strict, used by 43.8% of listings.
- There's a relatively balanced mix between guest-friendly (37.5%) and stricter (43.8%) policies, offering choices for different guest needs.
Recommendations for Hosts
- Consider adopting a Strict policy to align with the 43.8% market standard in Aleu.
- With 43.8% using Strict terms, this is a viable option in Aleu, particularly for high-value properties or during peak demand periods.
- Regularly review your cancellation policy against competitors and market demand shifts in Aleu.
Aleu STR Booking Lead Time Analysis (2025)
Average Booking Lead Time by Month
Booking Lead Time Insights for Aleu
- The overall average booking lead time for vacation rentals in Aleu is 44 days.
- Guests book furthest in advance for stays during August (average 68 days), likely coinciding with peak travel demand or local events.
- The shortest booking windows occur for stays in November (average 16 days), indicating more last-minute travel plans during this time.
- Seasonally, Summer (59 days avg.) sees the longest lead times, while Fall (29 days avg.) has the shortest, reflecting typical travel planning cycles.
Recommendations for Hosts
- Use the overall average lead time (44 days) as a baseline for your pricing and availability strategy in Aleu.
- For August stays, consider implementing length-of-stay discounts or slightly higher rates for bookings made less than 68 days out to capitalize on advance planning.
- Target marketing efforts for the Summer season well in advance (at least 59 days) to capture early planners.
- Monitor your own booking lead times against these Aleu averages to identify opportunities for dynamic pricing adjustments.
Popular & Essential Airbnb Amenities in Aleu (2025)
Amenity Prevalence
Amenity Insights for Aleu
- Essential amenities in Aleu that guests expect include: Kitchen, Hot water, Free parking on premises. Lacking these (any) could significantly impact bookings.
- Popular amenities like Dishes and silverware, Coffee maker, Essentials are common but not universal. Offering these can provide a competitive edge.
Recommendations for Hosts
- Ensure your listing includes all essential amenities for Aleu: Kitchen, Hot water, Free parking on premises.
- Consider adding popular differentiators like Dishes and silverware or Coffee maker to increase appeal.
- Highlight unique or less common amenities you offer (e.g., hot tub, dedicated workspace, EV charger) in your listing description and photos.
- Regularly check competitor amenities in Aleu to stay competitive.
Aleu Airbnb Guest Demographics & Profile Analysis (2025)
Guest Profile Summary for Aleu
- The typical guest profile for Airbnb in Aleu consists of primarily domestic travelers (73%), often arriving from nearby Toulouse, typically belonging to the Post-2000s (Gen Z/Alpha) group (50%), primarily speaking English or French.
- Domestic travelers account for 72.9% of guests.
- Key international markets include France (72.9%) and Spain (10.3%).
- Top languages spoken are English (39%) followed by French (31.7%).
- A significant demographic segment is the Post-2000s (Gen Z/Alpha) group, representing 50% of guests.
Recommendations for Hosts
- Target domestic marketing efforts towards travelers from Toulouse and Barcelona.
- Tailor amenities and listing descriptions to appeal to the dominant Post-2000s (Gen Z/Alpha) demographic (e.g., highlight fast WiFi, smart home features, local guides).
- Highlight unique local experiences or amenities relevant to the primary guest profile.
- Consider seasonal promotions aligned with peak travel times for key origin markets.
Nearby Short-Term Rental Market Comparison
How does the Aleu Airbnb market stack up against its neighbors? Compare key performance metrics like average monthly revenue, ADR, and occupancy rates in surrounding areas to understand the broader regional STR landscape.
| Market | Active Properties | Monthly Revenue | Daily Rate | Avg. Occupancy |
|---|---|---|---|---|
| Canyelles | 49 | $5,958 | $1023.94 | 37% |
| Arenys de Munt | 28 | $5,100 | $514.27 | 41% |
| Teià | 25 | $5,027 | $348.45 | 45% |
| Cornellà del Terri | 17 | $4,960 | $460.96 | 41% |
| Tiana | 12 | $4,955 | $299.97 | 48% |
| Amer | 10 | $4,848 | $397.58 | 40% |
| Bescanó | 11 | $4,761 | $445.38 | 41% |
| Porqueres | 12 | $4,714 | $469.05 | 36% |
| Premià de Dalt | 28 | $4,630 | $345.43 | 49% |
| Cabrils | 53 | $4,474 | $436.58 | 48% |