Talence Airbnb Market Analysis 2025: Short Term Rental Data & Vacation Rental Statistics in Nouvelle-Aquitaine, France
Is Airbnb profitable in Talence in 2025? Explore comprehensive Airbnb analytics for Talence, Nouvelle-Aquitaine, France to uncover income potential. This 2025 STR market report for Talence, based on AirROI data from April 2024 to March 2025, reveals key trends in the market of 294 active listings.
Whether you're considering an Airbnb investment in Talence, optimizing your existing vacation rental, or exploring rental arbitrage opportunities, understanding the Talence Airbnb data is crucial. Leveraging the low regulation environment is key to maximizing your short term rental income potential. Let's dive into the specifics.
Key Talence Airbnb Performance Metrics Overview
Monthly Airbnb Revenue Variations & Income Potential in Talence (2025)
Understanding the monthly revenue variations for Airbnb listings in Talence is key to maximizing your short term rental income potential. Seasonality significantly impacts earnings. Our analysis, based on data from the past 12 months, shows that the peak revenue month for STRs in Talence is typically June, while March often presents the lowest earnings, highlighting opportunities for strategic pricing adjustments during shoulder and low seasons. Explore the typical Airbnb income in Talence across different performance tiers:
- Best-in-class properties (Top 10%) achieve $3,156+ monthly, often utilizing dynamic pricing and superior guest experiences.
- Strong performing properties (Top 25%) earn $1,857 or more, indicating effective management and desirable locations/amenities.
- Typical properties (Median) generate around $1,231 per month, representing the average market performance.
- Entry-level properties (Bottom 25%) see earnings around $661, often with potential for optimization.
Average Monthly Airbnb Earnings Trend in Talence
Talence Airbnb Occupancy Rate Trends (2025)
Maximize your bookings by understanding the Talence STR occupancy trends. Seasonal demand shifts significantly influence how often properties are booked. Typically, Septembersees the highest demand (peak season occupancy), while March experiences the lowest (low season). Effective strategies, like adjusting minimum stays or offering promotions, can boost occupancy during slower periods. Here's how different property tiers perform in Talence:
- Best-in-class properties (Top 10%) achieve 88%+ occupancy, indicating high desirability and potentially optimized availability.
- Strong performing properties (Top 25%) maintain 77% or higher occupancy, suggesting good market fit and guest satisfaction.
- Typical properties (Median) have an occupancy rate around 55%.
- Entry-level properties (Bottom 25%) average 28% occupancy, potentially facing higher vacancy.
Average Monthly Occupancy Rate Trend in Talence
Average Daily Rate (ADR) Airbnb Trends in Talence (2025)
Effective short term rental pricing strategy in Talence involves understanding monthly ADR fluctuations. The Average Daily Rate (ADR) for Airbnb in Talence typically peaks in November and dips lowest during April. Leveraging Airbnb dynamic pricing tools or strategies based on this seasonality can significantly boost revenue. Here's a look at the typical nightly rates achieved:
- Best-in-class properties (Top 10%) command rates of $196+ per night, often due to premium features or locations.
- Strong performing properties (Top 25%) achieve nightly rates of $110 or more.
- Typical properties (Median) charge around $66 per night.
- Entry-level properties (Bottom 25%) earn around $48 per night.
Average Daily Rate (ADR) Trend by Month in Talence
Get Live Talence Market Intelligence 👇

Explore Real-time Analytics
Airbnb Seasonality Analysis & Trends in Talence (2025)
Peak Season (June, May, September)
- Revenue averages $1,958 per month
- Occupancy rates average 56.7%
- Daily rates average $95
Shoulder Season
- Revenue averages $1,597 per month
- Occupancy maintains around 52.9%
- Daily rates hold near $98
Low Season (January, February, March)
- Revenue drops to average $1,181 per month
- Occupancy decreases to average 47.8%
- Daily rates adjust to average $98
Seasonality Insights for Talence
- The Airbnb seasonality in Talence shows moderate seasonality with distinct peak and low periods. While the sections above show seasonal averages, it's also insightful to look at the extremes:
- During the high season, the absolute peak month showcases Talence's highest earning potential, with monthly revenues capable of climbing to $2,009, occupancy reaching a high of 64.0%, and ADRs peaking at $103.
- Conversely, the slowest single month of the year, typically falling within the low season, marks the market's lowest point. In this month, revenue might dip to $1,121, occupancy could drop to 45.2%, and ADRs may adjust down to $94.
- Understanding both the seasonal averages and these monthly peaks and troughs in revenue, occupancy, and ADR is crucial for maximizing your Airbnb profit potential in Talence.
Seasonal Strategies for Maximizing Profit
- Peak Season: Maximize revenue through premium pricing and potentially longer minimum stays. Ensure high availability.
- Low Season: Offer competitive pricing, special promotions (e.g., extended stay discounts), and flexible cancellation policies. Target off-season travelers like remote workers or budget-conscious guests.
- Shoulder Seasons: Implement dynamic pricing that balances peak and low rates. Target weekend travelers or specific events. Offer slightly more flexible terms than peak season.
- Regularly analyze your own performance against these Talence seasonality benchmarks and adjust your pricing and availability strategy accordingly.
Best Areas for Airbnb Investment in Talence (2025)
Exploring the top neighborhoods for short-term rentals in Talence? This section highlights key areas, outlining why they are attractive for hosts and guests, along with notable local attractions. Consider these locations based on your target guest profile and investment strategy.
| Neighborhood / Area | Why Host Here? (Target Guests & Appeal) | Key Attractions & Landmarks |
|---|---|---|
| Talence Centre | Central area with easy access to transport links and amenities. Popular for students and families alike, making it a great spot for short-term rentals. | Talence Market, Château Peixotto, Parc Peixotto, Université Bordeaux 3, Public Library of Talence |
| Saint-Genès | Residential neighborhood offering a mix of local charm and access to Bordeaux. Attractive for longer stays due to its quiet atmosphere and local services. | Bordeaux Botanical Garden, Parc Bordelais, Rue de la Croix Blanche, Local cafes and shops |
| Targonne | Known for its green spaces and proximity to local schools. This area appeals to families and students attending nearby educational institutions. | Parc de l'Ermitage, Institut Polytechnique de Bordeaux, Local sports facilities |
| Pessac | Adjacent to Talence, this area is known for its vineyards and relaxed lifestyle. Great for guests wanting to explore the wine culture while staying close to Bordeaux. | Château Pape Clément, Pessac Leognan vineyards, Local wine tasting tours |
| Bordeaux Sud | Conveniently located near transportation and Bordeaux city center. This area draws tourists for its accessibility and amenities. | Place de la Victoire, Local restaurants and cafes, Public transport access to Bordeaux |
| Capeyron | Ideal for those looking to enjoy a quieter part of the region while still being close to urban amenities. Popular with families and long-term stays. | Parc de Capeyron, Community sports events, Local markets |
| Brandenbourg | A tranquil neighborhood with a mix of contemporary living and historical charm. It attracts visitors looking for a peaceful yet convenient stay. | Parc de Brandenbourg, Historic architecture, Nearby local amenities |
| Mérignac | Although it's a bit outside Talence, it's a valuable area due to proximity to the airport and business parks, appealing to business travelers. | Bordeaux-Mérignac Airport, Local shopping centers, Business parks with coworking spaces |
Understanding Airbnb License Requirements & STR Laws in Talence (2025)
While Talence, Nouvelle-Aquitaine, France currently shows low STR regulations, specific Airbnb license requirements might still exist or change. Always verify the latest short term rental regulations and Airbnb license requirements directly with local government authorities for Talence to ensure full compliance before hosting.
(Source: AirROI data, 2025, based on 5% licensed listings)
Top Performing Airbnb Properties in Talence (2025)
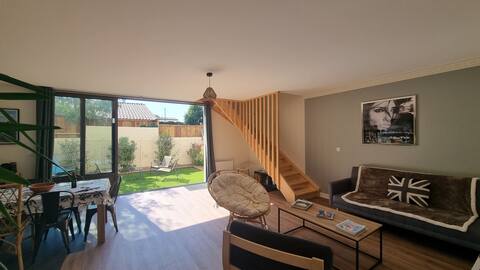
Benchmark your potential! Explore examples of top-performing Airbnb properties in Talencebased on Trailing Twelve Month (TTM) revenue. Analyze their characteristics, revenue, occupancy rate, and ADR to understand what drives success in this market.
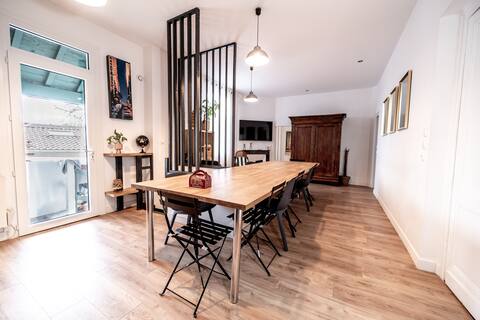
Domaine du Petit Basque near tram and bus
Entire Place • 8 bedrooms
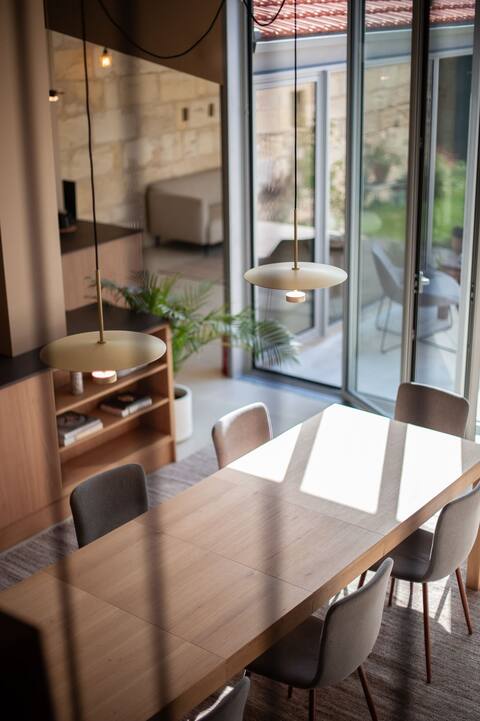
High standing house + Parkings & Tramway
Entire Place • 4 bedrooms

Talence house with 3 bedrooms, parking and garden
Entire Place • 3 bedrooms
Modern family shop
Entire Place • 4 bedrooms

GuestReady - Quiet apartment in Talence, sleeps 6
Entire Place • 2 bedrooms
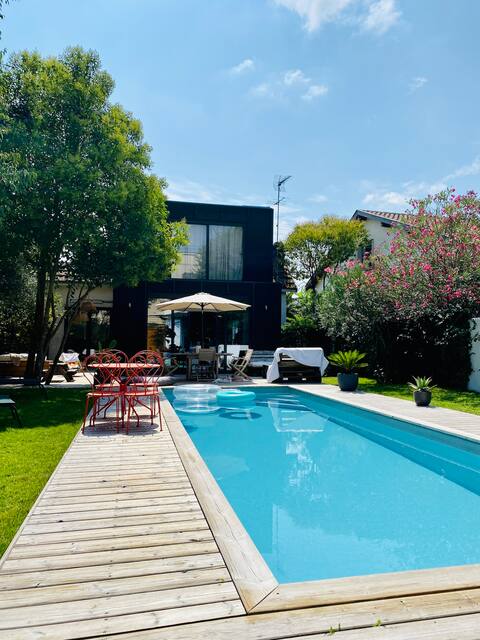
EXCEPTIONAL OFFER House near Bordeaux center
Entire Place • 3 bedrooms
Note: Performance varies based on location, size, amenities, seasonality, and management quality. Data reflects the past 12 months.
Top Performing Airbnb Hosts in Talence (2025)
Learn from the best! This table showcases top-performing Airbnb hosts in Talence based on the number of properties managed and estimated total revenue over the past year. Analyze their scale and performance metrics.
| Host Name | Properties | Grossing Revenue | Stay Reviews | Avg Rating |
|---|---|---|---|---|
| Hontas | 1 | $167,211 | 44 | 4.86/5.0 |
| Zacharie | 4 | $138,512 | 213 | 4.44/5.0 |
| Catherine | 2 | $117,773 | 290 | 4.91/5.0 |
| Olivier | 8 | $109,884 | 723 | 4.44/5.0 |
| Sébastien | 1 | $65,590 | 125 | 4.90/5.0 |
| Raida Et Farid | 4 | $57,329 | 415 | 4.80/5.0 |
| Jenna | 1 | $54,218 | 6 | 4.83/5.0 |
| Marina | 4 | $53,555 | 483 | 4.54/5.0 |
| GuestReady | 1 | $51,745 | 29 | 4.48/5.0 |
| Julie, Sté IDEALOC | 2 | $50,479 | 109 | 4.75/5.0 |
Analyzing the strategies of top hosts, such as their property selection, pricing, and guest communication, can offer valuable lessons for optimizing your own Airbnb operations in Talence.
Dive Deeper: Advanced Talence STR Market Data (2025)
Ready to unlock more insights? AirROI provides access to advanced metrics and comprehensive Airbnb data for Talence. Explore detailed analytics beyond this report to refine your investment strategy, optimize pricing, and maximize your vacation rental profits.
Explore Advanced MetricsTalence Short-Term Rental Market Composition (2025): Property & Room Types
Room Type Distribution
Property Type Distribution
Market Composition Insights for Talence
- The Talence Airbnb market composition is heavily skewed towards Entire Home/Apt listings, which make up 78.2% of the 294 active rentals. This indicates strong guest preference for privacy and space.
- Looking at the property type distribution in Talence, Apartment/Condo properties are the most common (56.5%), reflecting the local real estate landscape.
- Houses represent a significant 38.8% portion, catering likely to families or larger groups.
- Smaller segments like hotel/boutique, others (combined 4.7%) offer potential for unique stay experiences.
Talence Airbnb Room Capacity Analysis (2025): Bedroom Distribution
Distribution of Listings by Number of Bedrooms
Room Capacity Insights for Talence
- The dominant room capacity in Talence is 1 bedroom listings, making up 37.8% of the market. This suggests a strong demand for properties suitable for couples or solo travelers.
- Together, 1 bedroom and 2 bedrooms properties represent 51.1% of the active Airbnb listings in Talence, indicating a high concentration in these sizes.
- A significant 21.1% of listings offer 3+ bedrooms, catering to larger groups and families seeking more space in Talence.
Talence Vacation Rental Guest Capacity Trends (2025)
Distribution of Listings by Guest Capacity
Guest Capacity Insights for Talence
- The most common guest capacity trend in Talence vacation rentals is listings accommodating 2 guests (36.4%). This suggests the primary traveler segment is likely couples or solo travelers.
- Properties designed for 2 guests and 4 guests dominate the Talence STR market, accounting for 52.4% of listings.
- 20.4% of properties accommodate 6+ guests, serving the market segment for larger families or group travel in Talence.
- On average, properties in Talence are equipped to host 3.1 guests.
Talence Airbnb Booking Patterns (2025): Available vs. Booked Days
Available Days Distribution
Booked Days Distribution
Booking Pattern Insights for Talence
- The most common availability pattern in Talence falls within the 271-366 days range, representing 35.7% of listings. This suggests many properties have significant open periods on their calendars.
- Approximately 67.3% of listings show high availability (181+ days open annually), indicating potential for increased bookings or specific owner usage patterns.
- For booked days, the 91-180 days range is most frequent in Talence (32.3%), reflecting common guest stay durations or potential owner blocking patterns.
- A notable 33.6% of properties secure long booking periods (181+ days booked per year), highlighting successful long-term rental strategies or significant owner usage.
Talence Airbnb Minimum Stay Requirements Analysis
Distribution of Listings by Minimum Night Requirement
1 Night
68 listings
25.7% of total
2 Nights
89 listings
33.6% of total
3 Nights
34 listings
12.8% of total
4-6 Nights
42 listings
15.8% of total
7-29 Nights
18 listings
6.8% of total
30+ Nights
14 listings
5.3% of total
Key Insights
- The most prevalent minimum stay requirement in Talence is 2 Nights, adopted by 33.6% of listings. This highlights the market's preference for shorter, flexible bookings.
Recommendations
- Align with the market by considering a 2 Nights minimum stay, as 33.6% of Talence hosts use this setting.
- If feasible, allowing 1-night stays, especially midweek or during low season, could capture last-minute bookings, as only 25.7% currently do.
- Explore offering discounts for stays of 30+ nights to attract the 5.3% of the market seeking extended stays.
- Adjust minimum nights based on seasonality – potentially shorter during low season and longer during peak demand periods in Talence.
Talence Airbnb Cancellation Policy Trends Analysis (2025)
Flexible
81 listings
33.2% of total
Moderate
90 listings
36.9% of total
Firm
18 listings
7.4% of total
Strict
55 listings
22.5% of total
Cancellation Policy Insights for Talence
- The prevailing Airbnb cancellation policy trend in Talence is Moderate, used by 36.9% of listings.
- The market strongly favors guest-friendly terms, with 70.1% of listings offering Flexible or Moderate policies. This suggests guests in Talence may expect booking flexibility.
Recommendations for Hosts
- Consider adopting a Moderate policy to align with the 36.9% market standard in Talence.
- Regularly review your cancellation policy against competitors and market demand shifts in Talence.
Talence STR Booking Lead Time Analysis (2025)
Average Booking Lead Time by Month
Booking Lead Time Insights for Talence
- The overall average booking lead time for vacation rentals in Talence is 46 days.
- Guests book furthest in advance for stays during June (average 69 days), likely coinciding with peak travel demand or local events.
- The shortest booking windows occur for stays in February (average 34 days), indicating more last-minute travel plans during this time.
- Seasonally, Summer (57 days avg.) sees the longest lead times, while Winter (36 days avg.) has the shortest, reflecting typical travel planning cycles.
Recommendations for Hosts
- Use the overall average lead time (46 days) as a baseline for your pricing and availability strategy in Talence.
- For June stays, consider implementing length-of-stay discounts or slightly higher rates for bookings made less than 69 days out to capitalize on advance planning.
- Target marketing efforts for the Summer season well in advance (at least 57 days) to capture early planners.
- Monitor your own booking lead times against these Talence averages to identify opportunities for dynamic pricing adjustments.
Popular & Essential Airbnb Amenities in Talence (2025)
Amenity Prevalence
Amenity Insights for Talence
- Popular amenities like Heating, Wifi, Kitchen are common but not universal. Offering these can provide a competitive edge.
- Warning: Wifi is not universally provided but is considered essential globally. Ensure reliable Wifi is offered.
Recommendations for Hosts
- Consider adding popular differentiators like Heating or Wifi to increase appeal.
- Highlight unique or less common amenities you offer (e.g., hot tub, dedicated workspace, EV charger) in your listing description and photos.
- Regularly check competitor amenities in Talence to stay competitive.
Talence Airbnb Guest Demographics & Profile Analysis (2025)
Guest Profile Summary for Talence
- The typical guest profile for Airbnb in Talence consists of primarily domestic travelers (73%), often arriving from nearby Paris, typically belonging to the Post-2000s (Gen Z/Alpha) group (50%), primarily speaking French or English.
- Domestic travelers account for 73.2% of guests.
- Key international markets include France (73.2%) and Spain (4.3%).
- Top languages spoken are French (37.1%) followed by English (34.1%).
- A significant demographic segment is the Post-2000s (Gen Z/Alpha) group, representing 50% of guests.
Recommendations for Hosts
- Target domestic marketing efforts towards travelers from Paris and Toulouse.
- Tailor amenities and listing descriptions to appeal to the dominant Post-2000s (Gen Z/Alpha) demographic (e.g., highlight fast WiFi, smart home features, local guides).
- Highlight unique local experiences or amenities relevant to the primary guest profile.
- Consider seasonal promotions aligned with peak travel times for key origin markets.
Nearby Short-Term Rental Market Comparison
How does the Talence Airbnb market stack up against its neighbors? Compare key performance metrics like average monthly revenue, ADR, and occupancy rates in surrounding areas to understand the broader regional STR landscape.
| Market | Active Properties | Monthly Revenue | Daily Rate | Avg. Occupancy |
|---|---|---|---|---|
| San Sebastián | 1,426 | $3,546 | $262.81 | 49% |
| Saint-Laurent-des-Combes | 11 | $3,526 | $706.18 | 23% |
| Astaffort | 10 | $3,393 | $314.20 | 35% |
| Cénac | 18 | $2,773 | $268.58 | 53% |
| Cérons | 11 | $2,635 | $196.16 | 39% |
| Galgon | 12 | $2,599 | $210.34 | 48% |
| Hernani | 11 | $2,572 | $345.16 | 40% |
| Eynesse | 14 | $2,564 | $282.87 | 36% |
| Bourrou | 10 | $2,475 | $247.57 | 36% |
| Saint-Hippolyte | 10 | $2,443 | $204.98 | 44% |