Surgères Airbnb Market Analysis 2025: Short Term Rental Data & Vacation Rental Statistics in Nouvelle-Aquitaine, France
Is Airbnb profitable in Surgères in 2025? Explore comprehensive Airbnb analytics for Surgères, Nouvelle-Aquitaine, France to uncover income potential. This 2025 STR market report for Surgères, based on AirROI data from April 2024 to March 2025, reveals key trends in the niche market of 37 active listings.
Whether you're considering an Airbnb investment in Surgères, optimizing your existing vacation rental, or exploring rental arbitrage opportunities, understanding the Surgères Airbnb data is crucial. Understanding the local regulations is key to maximizing your short term rental income potential. Let's dive into the specifics.
Key Surgères Airbnb Performance Metrics Overview
Monthly Airbnb Revenue Variations & Income Potential in Surgères (2025)
Understanding the monthly revenue variations for Airbnb listings in Surgères is key to maximizing your short term rental income potential. Seasonality significantly impacts earnings. Our analysis, based on data from the past 12 months, shows that the peak revenue month for STRs in Surgères is typically August, while February often presents the lowest earnings, highlighting opportunities for strategic pricing adjustments during shoulder and low seasons. Explore the typical Airbnb income in Surgères across different performance tiers:
- Best-in-class properties (Top 10%) achieve $2,004+ monthly, often utilizing dynamic pricing and superior guest experiences.
- Strong performing properties (Top 25%) earn $1,392 or more, indicating effective management and desirable locations/amenities.
- Typical properties (Median) generate around $747 per month, representing the average market performance.
- Entry-level properties (Bottom 25%) see earnings around $300, often with potential for optimization.
Average Monthly Airbnb Earnings Trend in Surgères
Surgères Airbnb Occupancy Rate Trends (2025)
Maximize your bookings by understanding the Surgères STR occupancy trends. Seasonal demand shifts significantly influence how often properties are booked. Typically, Augustsees the highest demand (peak season occupancy), while February experiences the lowest (low season). Effective strategies, like adjusting minimum stays or offering promotions, can boost occupancy during slower periods. Here's how different property tiers perform in Surgères:
- Best-in-class properties (Top 10%) achieve 73%+ occupancy, indicating high desirability and potentially optimized availability.
- Strong performing properties (Top 25%) maintain 60% or higher occupancy, suggesting good market fit and guest satisfaction.
- Typical properties (Median) have an occupancy rate around 38%.
- Entry-level properties (Bottom 25%) average 18% occupancy, potentially facing higher vacancy.
Average Monthly Occupancy Rate Trend in Surgères
Average Daily Rate (ADR) Airbnb Trends in Surgères (2025)
Effective short term rental pricing strategy in Surgères involves understanding monthly ADR fluctuations. The Average Daily Rate (ADR) for Airbnb in Surgères typically peaks in December and dips lowest during April. Leveraging Airbnb dynamic pricing tools or strategies based on this seasonality can significantly boost revenue. Here's a look at the typical nightly rates achieved:
- Best-in-class properties (Top 10%) command rates of $119+ per night, often due to premium features or locations.
- Strong performing properties (Top 25%) achieve nightly rates of $87 or more.
- Typical properties (Median) charge around $59 per night.
- Entry-level properties (Bottom 25%) earn around $46 per night.
Average Daily Rate (ADR) Trend by Month in Surgères
Get Live Surgères Market Intelligence 👇

Explore Real-time Analytics
Airbnb Seasonality Analysis & Trends in Surgères (2025)
Peak Season (August, July, May)
- Revenue averages $1,484 per month
- Occupancy rates average 51.0%
- Daily rates average $76
Shoulder Season
- Revenue averages $934 per month
- Occupancy maintains around 39.2%
- Daily rates hold near $75
Low Season (January, February, September)
- Revenue drops to average $607 per month
- Occupancy decreases to average 32.0%
- Daily rates adjust to average $76
Seasonality Insights for Surgères
- The Airbnb seasonality in Surgères shows highly seasonal trends requiring careful strategy. While the sections above show seasonal averages, it's also insightful to look at the extremes:
- During the high season, the absolute peak month showcases Surgères's highest earning potential, with monthly revenues capable of climbing to $1,744, occupancy reaching a high of 64.1%, and ADRs peaking at $78.
- Conversely, the slowest single month of the year, typically falling within the low season, marks the market's lowest point. In this month, revenue might dip to $424, occupancy could drop to 28.4%, and ADRs may adjust down to $71.
- Understanding both the seasonal averages and these monthly peaks and troughs in revenue, occupancy, and ADR is crucial for maximizing your Airbnb profit potential in Surgères.
Seasonal Strategies for Maximizing Profit
- Peak Season: Maximize revenue through premium pricing and potentially longer minimum stays. Ensure high availability.
- Low Season: Offer competitive pricing, special promotions (e.g., extended stay discounts), and flexible cancellation policies. Target off-season travelers like remote workers or budget-conscious guests.
- Shoulder Seasons: Implement dynamic pricing that balances peak and low rates. Target weekend travelers or specific events. Offer slightly more flexible terms than peak season.
- Regularly analyze your own performance against these Surgères seasonality benchmarks and adjust your pricing and availability strategy accordingly.
Best Areas for Airbnb Investment in Surgères (2025)
Exploring the top neighborhoods for short-term rentals in Surgères? This section highlights key areas, outlining why they are attractive for hosts and guests, along with notable local attractions. Consider these locations based on your target guest profile and investment strategy.
| Neighborhood / Area | Why Host Here? (Target Guests & Appeal) | Key Attractions & Landmarks |
|---|---|---|
| Centre Ville | The heart of Surgères, offering easy access to shops, restaurants, and local culture. It's prime for tourists who want to experience the charm of the town and enjoy local amenities. | Château de Surgères, Église Saint-Symphorien, local markets, Le Parc de la Mairie, Café de la Mairie |
| La Gare | Close proximity to the train station makes this area appealing for travelers looking to explore the surrounding regions. A convenient spot for those using public transport. | Surgères Train Station, nearby shops, restaurants, easy access to La Rochelle and Niort |
| Quartier Historique | A charming historical neighborhood with beautiful old buildings and a rich history. Perfect for guests interested in cultural heritage and local history. | historical buildings, local art galleries, Café des Artistes, cultural events, town square |
| Les Jardins | This area features beautiful gardens and green spaces, ideal for families and nature lovers. Great for those looking to unwind in a tranquil setting. | Jardin des Plantes, Parc de la Réserve, walking paths, picnic spots |
| Proche de La Rochelle | Just a short drive from La Rochelle, this area attracts visitors looking to enjoy both the quiet of Surgères and the vibrant city life of La Rochelle. | beaches of La Rochelle, aquarium, Vieux Port, shopping in La Rochelle |
| Vignoble | Surrounded by vineyards, this area offers wine enthusiasts a chance to explore local wineries and enjoy wine tastings. A unique experience for guests. | local wineries, wine tasting tours, scenic countryside, wine festivals |
| Cottage District | A peaceful residential area known for its charming cottages and greenery. Ideal for those seeking a quiet retreat. | quiet streets, charming cottages, local parks |
| Rural Surroundings | The outskirts of Surgères offer beautiful countryside views and rural charm. Great for visitors looking for a nature getaway. | nature trails, scenic views, outdoor activities, farm visits |
Understanding Airbnb License Requirements & STR Laws in Surgères (2025)
With 11% of listings showing registration in 2025, understanding potential Airbnb license requirements is crucial in Surgères. Always verify the latest short term rental regulations and Airbnb license requirements directly with local government authorities for Surgères to ensure full compliance before hosting.
(Source: AirROI data, 2025, based on 11% licensed listings)
Top Performing Airbnb Properties in Surgères (2025)
Benchmark your potential! Explore examples of top-performing Airbnb properties in Surgèresbased on Trailing Twelve Month (TTM) revenue. Analyze their characteristics, revenue, occupancy rate, and ADR to understand what drives success in this market.
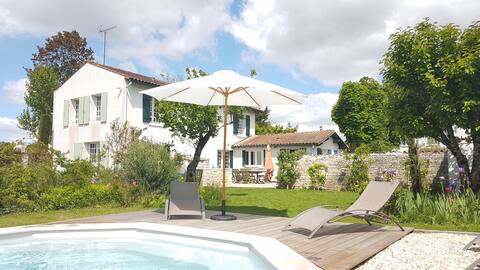
Charming House 8 pers with heated pool 40m²
Entire Place • 4 bedrooms
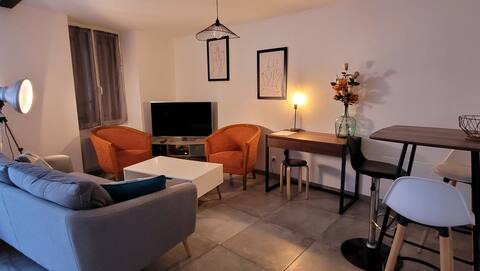
Townhouse - Surgères
Entire Place • 2 bedrooms
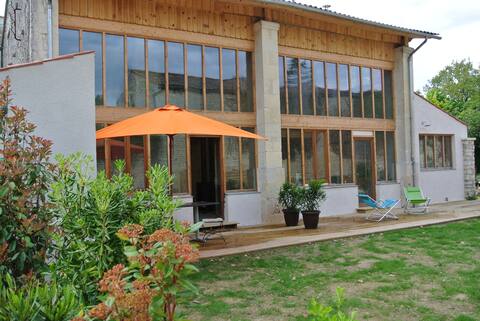
cottage 6 people, quiet garden in the city center
Entire Place • 3 bedrooms
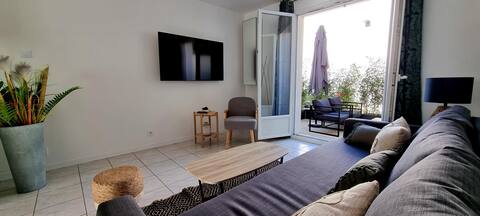
Only 150ft from the Castle ! Netflix-Terrace-AC
Entire Place • 1 bedroom
maison de vacances /4 personnes.
Entire Place • 2 bedrooms
Furnished duplex studio with parking place
Entire Place • 1 bedroom
Note: Performance varies based on location, size, amenities, seasonality, and management quality. Data reflects the past 12 months.
Top Performing Airbnb Hosts in Surgères (2025)
Learn from the best! This table showcases top-performing Airbnb hosts in Surgères based on the number of properties managed and estimated total revenue over the past year. Analyze their scale and performance metrics.
| Host Name | Properties | Grossing Revenue | Stay Reviews | Avg Rating |
|---|---|---|---|---|
| Chantal | 2 | $38,151 | 94 | 4.89/5.0 |
| Judy Et Olivier | 2 | $33,125 | 266 | 4.91/5.0 |
| Emmanuel | 1 | $32,609 | 8 | 4.88/5.0 |
| Véronique | 2 | $29,672 | 39 | 2.37/5.0 |
| Michaël | 2 | $24,421 | 341 | 4.68/5.0 |
| Host #441872102 | 1 | $17,550 | 13 | 4.92/5.0 |
| Katerine | 1 | $13,202 | 40 | 4.90/5.0 |
| Valerie | 1 | $12,874 | 31 | 4.94/5.0 |
| Merry | 1 | $12,449 | 56 | 4.89/5.0 |
| Jérome | 1 | $11,288 | 25 | 4.56/5.0 |
Analyzing the strategies of top hosts, such as their property selection, pricing, and guest communication, can offer valuable lessons for optimizing your own Airbnb operations in Surgères.
Dive Deeper: Advanced Surgères STR Market Data (2025)
Ready to unlock more insights? AirROI provides access to advanced metrics and comprehensive Airbnb data for Surgères. Explore detailed analytics beyond this report to refine your investment strategy, optimize pricing, and maximize your vacation rental profits.
Explore Advanced MetricsSurgères Short-Term Rental Market Composition (2025): Property & Room Types
Room Type Distribution
Property Type Distribution
Market Composition Insights for Surgères
- The Surgères Airbnb market composition is heavily skewed towards Entire Home/Apt listings, which make up 64.9% of the 37 active rentals. This indicates strong guest preference for privacy and space.
- However, a notable 35.1% share for Private Rooms suggests opportunities for budget-conscious travelers or hosts renting out spare rooms.
- Looking at the property type distribution in Surgères, House properties are the most common (67.6%), reflecting the local real estate landscape.
- Houses represent a significant 67.6% portion, catering likely to families or larger groups.
- The presence of 13.5% Hotel/Boutique listings indicates integration with traditional hospitality.
- Smaller segments like others (combined 2.7%) offer potential for unique stay experiences.
Surgères Airbnb Room Capacity Analysis (2025): Bedroom Distribution
Distribution of Listings by Number of Bedrooms
Room Capacity Insights for Surgères
- The dominant room capacity in Surgères is 2 bedrooms listings, making up 35.1% of the market. This suggests a strong demand for properties suitable for couples or solo travelers.
- Together, 2 bedrooms and 1 bedroom properties represent 56.7% of the active Airbnb listings in Surgères, indicating a high concentration in these sizes.
- Listings with 3+ bedrooms (8.1%) represent a smaller niche, potentially indicating an underserved market for larger group accommodations in Surgères.
Surgères Vacation Rental Guest Capacity Trends (2025)
Distribution of Listings by Guest Capacity
Guest Capacity Insights for Surgères
- The most common guest capacity trend in Surgères vacation rentals is listings accommodating 4 guests (27%). This suggests the primary traveler segment is likely small families or groups.
- Properties designed for 4 guests and 2 guests dominate the Surgères STR market, accounting for 48.6% of listings.
- 13.5% of properties accommodate 6+ guests, serving the market segment for larger families or group travel in Surgères.
- On average, properties in Surgères are equipped to host 2.8 guests.
Surgères Airbnb Booking Patterns (2025): Available vs. Booked Days
Available Days Distribution
Booked Days Distribution
Booking Pattern Insights for Surgères
- The most common availability pattern in Surgères falls within the 271-366 days range, representing 40.5% of listings. This suggests many properties have significant open periods on their calendars.
- Approximately 70.2% of listings show high availability (181+ days open annually), indicating potential for increased bookings or specific owner usage patterns.
- For booked days, the 181-270 days range is most frequent in Surgères (32.4%), reflecting common guest stay durations or potential owner blocking patterns.
- A notable 32.4% of properties secure long booking periods (181+ days booked per year), highlighting successful long-term rental strategies or significant owner usage.
Surgères Airbnb Minimum Stay Requirements Analysis
Distribution of Listings by Minimum Night Requirement
1 Night
22 listings
62.9% of total
2 Nights
9 listings
25.7% of total
4-6 Nights
2 listings
5.7% of total
7-29 Nights
1 listings
2.9% of total
30+ Nights
1 listings
2.9% of total
Key Insights
- The most prevalent minimum stay requirement in Surgères is 1 Night, adopted by 62.9% of listings. This highlights the market's preference for shorter, flexible bookings.
- A strong majority (88.6%) of the Surgères Airbnb data shows acceptance of very short stays (1-2 nights), indicating a dynamic, high-turnover market.
- Dedicated monthly rentals (30+ nights) represent a small niche (2.9%), possibly an untapped area for hosts.
Recommendations
- Align with the market by considering a 1 Night minimum stay, as 62.9% of Surgères hosts use this setting.
- Adjust minimum nights based on seasonality – potentially shorter during low season and longer during peak demand periods in Surgères.
Surgères Airbnb Cancellation Policy Trends Analysis (2025)
Flexible
19 listings
59.4% of total
Moderate
9 listings
28.1% of total
Firm
1 listings
3.1% of total
Strict
3 listings
9.4% of total
Cancellation Policy Insights for Surgères
- The prevailing Airbnb cancellation policy trend in Surgères is Flexible, used by 59.4% of listings.
- The market strongly favors guest-friendly terms, with 87.5% of listings offering Flexible or Moderate policies. This suggests guests in Surgères may expect booking flexibility.
- Strict cancellation policies are quite rare (9.4%), potentially making listings with this policy less competitive unless justified by high demand or property type.
Recommendations for Hosts
- Consider adopting a Flexible policy to align with the 59.4% market standard in Surgères.
- Given the high prevalence of Flexible policies (59.4%), offering this can enhance booking appeal, especially during shoulder seasons.
- Using a Strict policy might deter some guests, as only 9.4% of listings use it. Evaluate if potential revenue protection outweighs possible lower booking rates.
- Regularly review your cancellation policy against competitors and market demand shifts in Surgères.
Surgères STR Booking Lead Time Analysis (2025)
Average Booking Lead Time by Month
Booking Lead Time Insights for Surgères
- The overall average booking lead time for vacation rentals in Surgères is 44 days.
- Guests book furthest in advance for stays during July (average 80 days), likely coinciding with peak travel demand or local events.
- The shortest booking windows occur for stays in November (average 25 days), indicating more last-minute travel plans during this time.
- Seasonally, Summer (68 days avg.) sees the longest lead times, while Fall (29 days avg.) has the shortest, reflecting typical travel planning cycles.
Recommendations for Hosts
- Use the overall average lead time (44 days) as a baseline for your pricing and availability strategy in Surgères.
- For July stays, consider implementing length-of-stay discounts or slightly higher rates for bookings made less than 80 days out to capitalize on advance planning.
- Target marketing efforts for the Summer season well in advance (at least 68 days) to capture early planners.
- Monitor your own booking lead times against these Surgères averages to identify opportunities for dynamic pricing adjustments.
Popular & Essential Airbnb Amenities in Surgères (2025)
Amenity Prevalence
Amenity Insights for Surgères
- Popular amenities like Heating, Hot water, Smoke alarm are common but not universal. Offering these can provide a competitive edge.
- Warning: Wifi is not universally provided but is considered essential globally. Ensure reliable Wifi is offered.
Recommendations for Hosts
- Consider adding popular differentiators like Heating or Hot water to increase appeal.
- Highlight unique or less common amenities you offer (e.g., hot tub, dedicated workspace, EV charger) in your listing description and photos.
- Regularly check competitor amenities in Surgères to stay competitive.
Surgères Airbnb Guest Demographics & Profile Analysis (2025)
Guest Profile Summary for Surgères
- The typical guest profile for Airbnb in Surgères consists of primarily domestic travelers (94%), often arriving from nearby Paris, typically belonging to the Post-2000s (Gen Z/Alpha) group (50%), primarily speaking French or English.
- Domestic travelers account for 93.5% of guests.
- Key international markets include France (93.5%) and United Kingdom (0.8%).
- Top languages spoken are French (50.8%) followed by English (28.8%).
- A significant demographic segment is the Post-2000s (Gen Z/Alpha) group, representing 50% of guests.
Recommendations for Hosts
- Target domestic marketing efforts towards travelers from Paris and Nantes.
- Tailor amenities and listing descriptions to appeal to the dominant Post-2000s (Gen Z/Alpha) demographic (e.g., highlight fast WiFi, smart home features, local guides).
- Highlight unique local experiences or amenities relevant to the primary guest profile.
- Consider seasonal promotions aligned with peak travel times for key origin markets.
Nearby Short-Term Rental Market Comparison
How does the Surgères Airbnb market stack up against its neighbors? Compare key performance metrics like average monthly revenue, ADR, and occupancy rates in surrounding areas to understand the broader regional STR landscape.
| Market | Active Properties | Monthly Revenue | Daily Rate | Avg. Occupancy |
|---|---|---|---|---|
| Coteaux-sur-Loire | 19 | $3,328 | $270.00 | 41% |
| Villiers-sur-Loir | 10 | $2,967 | $216.51 | 41% |
| Artannes-sur-Indre | 21 | $2,949 | $275.91 | 41% |
| Vallon-sur-Gée | 11 | $2,913 | $379.01 | 30% |
| Bourneau | 11 | $2,747 | $442.07 | 35% |
| Nuaillé-d'Aunis | 10 | $2,741 | $373.83 | 37% |
| Ambillou | 18 | $2,701 | $370.97 | 28% |
| Le Bois-Plage-en-Ré | 303 | $2,528 | $284.63 | 45% |
| Chambellay | 11 | $2,525 | $255.24 | 34% |
| Le Grand-Pressigny | 11 | $2,511 | $266.72 | 31% |