Salles-sur-Mer Airbnb Market Analysis 2025: Short Term Rental Data & Vacation Rental Statistics in Nouvelle-Aquitaine, France
Is Airbnb profitable in Salles-sur-Mer in 2025? Explore comprehensive Airbnb analytics for Salles-sur-Mer, Nouvelle-Aquitaine, France to uncover income potential. This 2025 STR market report for Salles-sur-Mer, based on AirROI data from April 2024 to March 2025, reveals key trends in the niche market of 36 active listings.
Whether you're considering an Airbnb investment in Salles-sur-Mer, optimizing your existing vacation rental, or exploring rental arbitrage opportunities, understanding the Salles-sur-Mer Airbnb data is crucial. Navigating the high regulation landscape is key to maximizing your short term rental income potential. Let's dive into the specifics.
Key Salles-sur-Mer Airbnb Performance Metrics Overview
Monthly Airbnb Revenue Variations & Income Potential in Salles-sur-Mer (2025)
Understanding the monthly revenue variations for Airbnb listings in Salles-sur-Mer is key to maximizing your short term rental income potential. Seasonality significantly impacts earnings. Our analysis, based on data from the past 12 months, shows that the peak revenue month for STRs in Salles-sur-Mer is typically April, while January often presents the lowest earnings, highlighting opportunities for strategic pricing adjustments during shoulder and low seasons. Explore the typical Airbnb income in Salles-sur-Mer across different performance tiers:
- Best-in-class properties (Top 10%) achieve $3,209+ monthly, often utilizing dynamic pricing and superior guest experiences.
- Strong performing properties (Top 25%) earn $2,054 or more, indicating effective management and desirable locations/amenities.
- Typical properties (Median) generate around $1,059 per month, representing the average market performance.
- Entry-level properties (Bottom 25%) see earnings around $516, often with potential for optimization.
Average Monthly Airbnb Earnings Trend in Salles-sur-Mer
Salles-sur-Mer Airbnb Occupancy Rate Trends (2025)
Maximize your bookings by understanding the Salles-sur-Mer STR occupancy trends. Seasonal demand shifts significantly influence how often properties are booked. Typically, Augustsees the highest demand (peak season occupancy), while January experiences the lowest (low season). Effective strategies, like adjusting minimum stays or offering promotions, can boost occupancy during slower periods. Here's how different property tiers perform in Salles-sur-Mer:
- Best-in-class properties (Top 10%) achieve 65%+ occupancy, indicating high desirability and potentially optimized availability.
- Strong performing properties (Top 25%) maintain 50% or higher occupancy, suggesting good market fit and guest satisfaction.
- Typical properties (Median) have an occupancy rate around 28%.
- Entry-level properties (Bottom 25%) average 14% occupancy, potentially facing higher vacancy.
Average Monthly Occupancy Rate Trend in Salles-sur-Mer
Average Daily Rate (ADR) Airbnb Trends in Salles-sur-Mer (2025)
Effective short term rental pricing strategy in Salles-sur-Mer involves understanding monthly ADR fluctuations. The Average Daily Rate (ADR) for Airbnb in Salles-sur-Mer typically peaks in November and dips lowest during April. Leveraging Airbnb dynamic pricing tools or strategies based on this seasonality can significantly boost revenue. Here's a look at the typical nightly rates achieved:
- Best-in-class properties (Top 10%) command rates of $359+ per night, often due to premium features or locations.
- Strong performing properties (Top 25%) achieve nightly rates of $169 or more.
- Typical properties (Median) charge around $120 per night.
- Entry-level properties (Bottom 25%) earn around $84 per night.
Average Daily Rate (ADR) Trend by Month in Salles-sur-Mer
Get Live Salles-sur-Mer Market Intelligence 👇

Explore Real-time Analytics
Airbnb Seasonality Analysis & Trends in Salles-sur-Mer (2025)
Peak Season (April, August, June)
- Revenue averages $3,010 per month
- Occupancy rates average 41.2%
- Daily rates average $172
Shoulder Season
- Revenue averages $1,495 per month
- Occupancy maintains around 32.8%
- Daily rates hold near $178
Low Season (January, February, November)
- Revenue drops to average $859 per month
- Occupancy decreases to average 26.1%
- Daily rates adjust to average $190
Seasonality Insights for Salles-sur-Mer
- The Airbnb seasonality in Salles-sur-Mer shows highly seasonal trends requiring careful strategy. While the sections above show seasonal averages, it's also insightful to look at the extremes:
- During the high season, the absolute peak month showcases Salles-sur-Mer's highest earning potential, with monthly revenues capable of climbing to $3,193, occupancy reaching a high of 64.9%, and ADRs peaking at $192.
- Conversely, the slowest single month of the year, typically falling within the low season, marks the market's lowest point. In this month, revenue might dip to $810, occupancy could drop to 22.6%, and ADRs may adjust down to $169.
- Understanding both the seasonal averages and these monthly peaks and troughs in revenue, occupancy, and ADR is crucial for maximizing your Airbnb profit potential in Salles-sur-Mer.
Seasonal Strategies for Maximizing Profit
- Peak Season: Maximize revenue through premium pricing and potentially longer minimum stays. Ensure high availability.
- Low Season: Offer competitive pricing, special promotions (e.g., extended stay discounts), and flexible cancellation policies. Target off-season travelers like remote workers or budget-conscious guests.
- Shoulder Seasons: Implement dynamic pricing that balances peak and low rates. Target weekend travelers or specific events. Offer slightly more flexible terms than peak season.
- Regularly analyze your own performance against these Salles-sur-Mer seasonality benchmarks and adjust your pricing and availability strategy accordingly.
Best Areas for Airbnb Investment in Salles-sur-Mer (2025)
Exploring the top neighborhoods for short-term rentals in Salles-sur-Mer? This section highlights key areas, outlining why they are attractive for hosts and guests, along with notable local attractions. Consider these locations based on your target guest profile and investment strategy.
| Neighborhood / Area | Why Host Here? (Target Guests & Appeal) | Key Attractions & Landmarks |
|---|---|---|
| Saint-Rémy-de-Provence | A picturesque town known for its rich history and stunning landscapes, making it a popular destination for tourists seeking art and tranquility. Great for attracting travelers looking for a quintessential Provençal experience. | Saint-Paul-de-Mausole, Les Baux-de-Provence, Van Gogh Museum, Roman ruins, Local markets |
| La Rochelle | A historic port city with beautiful architecture and a vibrant maritime culture. Ideal for visitors interested in coastal activities and historical sights. | Old Port, La Rochelle Aquarium, Towers of La Rochelle, Maritime Museum, Beach and seaside promenades |
| Bordeaux | A renowned city known for its wine and gastronomy. Attracts wine enthusiasts and culinary travelers looking for a sophisticated urban experience with cultural offerings. | Place de la Bourse, Cité du Vin, Bordeaux Wine Museum, Park Bordelais, Chartrons district |
| Arcachon | Famous for its stunning beaches and the Dune du Pilat, the highest sand dune in Europe. A hotspot for summer vacationers and outdoor enthusiasts. | Dune du Pilat, Arcachon Bay, Beaches, Parc Mauresque, Bird Island |
| Royan | A vibrant seaside resort town with beautiful beaches, attracting both families and young travelers looking for sun and sand. | Grande Conche Beach, Côte de Beauté, Royan Market, Phare de Cordouan, Zoo de la Palmyre |
| Pau | Nestled in the Pyrénées, Pau offers a stunning natural environment combined with rich history. It's perfect for tourists seeking scenic views and outdoor activities. | Château de Pau, Boulevard des Pyrénées, Palais Beaumont, Jardin Henri IV, Local vineyard tours |
| Angoulême | Famous for its comic book festival and artistic vibe, appealing to younger travelers and art lovers alike. A historical town with a unique culture. | Cité internationale de la bande dessinée, Angoulême Cathedral, Le Musée de la bande dessinée, Local cafes, Historic streets |
| Cognac | Known worldwide for its brandy production, Cognac is a charming town attracting visitors interested in culinary experiences and vineyard tours. | Hennessy Cognac Tour, Cognac Museum, Château de Cognac, Cognac vineyards, Local distilleries |
Understanding Airbnb License Requirements & STR Laws in Salles-sur-Mer (2025)
Yes, Salles-sur-Mer, Nouvelle-Aquitaine, France enforces high STR regulations. Obtaining a license and ensuring compliance is almost certainly required according to current 2025 STR laws. Always verify the latest short term rental regulations and Airbnb license requirements directly with local government authorities for Salles-sur-Mer to ensure full compliance before hosting.
(Source: AirROI data, 2025, based on 53% licensed listings)
Top Performing Airbnb Properties in Salles-sur-Mer (2025)
Benchmark your potential! Explore examples of top-performing Airbnb properties in Salles-sur-Merbased on Trailing Twelve Month (TTM) revenue. Analyze their characteristics, revenue, occupancy rate, and ADR to understand what drives success in this market.
Villa Lorisa & annexe-jacuzzi et plages 19 pers
Entire Place • 7 bedrooms
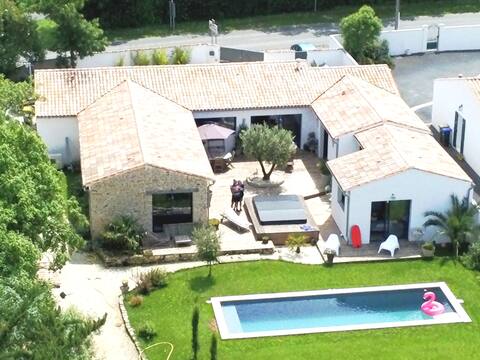
Villa park 5000 m2 near beach and La Rochelle
Entire Place • 4 bedrooms

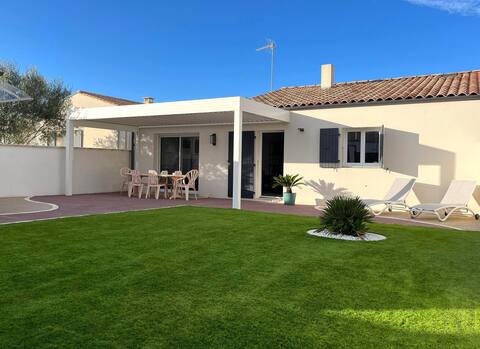
House of 75m² 1km from the sea, jaccuzi, terrace
Entire Place • 1 bedroom
The Tamaris
Entire Place • 3 bedrooms
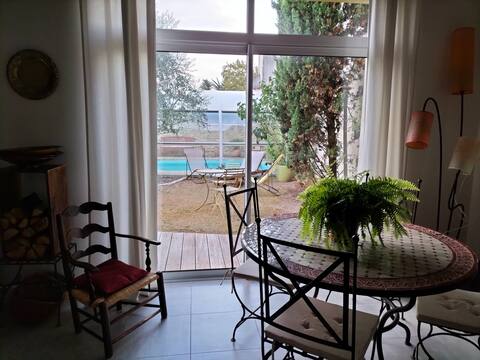
Le Loft à Salles sur mer
Entire Place • 2 bedrooms
rooms: independent entrance and lunch area.
Private Room • 2 bedrooms
Note: Performance varies based on location, size, amenities, seasonality, and management quality. Data reflects the past 12 months.
Top Performing Airbnb Hosts in Salles-sur-Mer (2025)
Learn from the best! This table showcases top-performing Airbnb hosts in Salles-sur-Mer based on the number of properties managed and estimated total revenue over the past year. Analyze their scale and performance metrics.
| Host Name | Properties | Grossing Revenue | Stay Reviews | Avg Rating |
|---|---|---|---|---|
| Caroline | 3 | $71,523 | 52 | 3.21/5.0 |
| Elsa Et Sébastien | 1 | $50,716 | 6 | 5.00/5.0 |
| Laurine | 2 | $35,432 | 35 | 2.48/5.0 |
| Stephane | 1 | $25,996 | 36 | 4.86/5.0 |
| Christophe | 1 | $18,806 | 25 | 4.96/5.0 |
| Mathieu | 1 | $18,259 | 11 | 4.73/5.0 |
| Valerie | 1 | $17,959 | 8 | 4.75/5.0 |
| Isabelle | 1 | $17,375 | 19 | 5.00/5.0 |
| Isabelle | 2 | $16,227 | 128 | 4.78/5.0 |
| Emmanuel | 1 | $15,770 | 101 | 5.00/5.0 |
Analyzing the strategies of top hosts, such as their property selection, pricing, and guest communication, can offer valuable lessons for optimizing your own Airbnb operations in Salles-sur-Mer.
Dive Deeper: Advanced Salles-sur-Mer STR Market Data (2025)
Ready to unlock more insights? AirROI provides access to advanced metrics and comprehensive Airbnb data for Salles-sur-Mer. Explore detailed analytics beyond this report to refine your investment strategy, optimize pricing, and maximize your vacation rental profits.
Explore Advanced MetricsSalles-sur-Mer Short-Term Rental Market Composition (2025): Property & Room Types
Room Type Distribution
Property Type Distribution
Market Composition Insights for Salles-sur-Mer
- The Salles-sur-Mer Airbnb market composition is heavily skewed towards Entire Home/Apt listings, which make up 75% of the 36 active rentals. This indicates strong guest preference for privacy and space.
- Looking at the property type distribution in Salles-sur-Mer, House properties are the most common (72.2%), reflecting the local real estate landscape.
- Houses represent a significant 72.2% portion, catering likely to families or larger groups.
- The presence of 13.9% Hotel/Boutique listings indicates integration with traditional hospitality.
Salles-sur-Mer Airbnb Room Capacity Analysis (2025): Bedroom Distribution
Distribution of Listings by Number of Bedrooms
Room Capacity Insights for Salles-sur-Mer
- The dominant room capacity in Salles-sur-Mer is 1 bedroom listings, making up 25% of the market. This suggests a strong demand for properties suitable for couples or solo travelers.
- Together, 1 bedroom and 2 bedrooms properties represent 50.0% of the active Airbnb listings in Salles-sur-Mer, indicating a high concentration in these sizes.
- A significant 30.5% of listings offer 3+ bedrooms, catering to larger groups and families seeking more space in Salles-sur-Mer.
Salles-sur-Mer Vacation Rental Guest Capacity Trends (2025)
Distribution of Listings by Guest Capacity
Guest Capacity Insights for Salles-sur-Mer
- The most common guest capacity trend in Salles-sur-Mer vacation rentals is listings accommodating 4 guests (19.4%). This suggests the primary traveler segment is likely small families or groups.
- Properties designed for 4 guests and 6 guests dominate the Salles-sur-Mer STR market, accounting for 38.8% of listings.
- 36.1% of properties accommodate 6+ guests, serving the market segment for larger families or group travel in Salles-sur-Mer.
- On average, properties in Salles-sur-Mer are equipped to host 3.9 guests.
Salles-sur-Mer Airbnb Booking Patterns (2025): Available vs. Booked Days
Available Days Distribution
Booked Days Distribution
Booking Pattern Insights for Salles-sur-Mer
- The most common availability pattern in Salles-sur-Mer falls within the 271-366 days range, representing 63.9% of listings. This suggests many properties have significant open periods on their calendars.
- Approximately 94.5% of listings show high availability (181+ days open annually), indicating potential for increased bookings or specific owner usage patterns.
- For booked days, the 91-180 days range is most frequent in Salles-sur-Mer (33.3%), reflecting common guest stay durations or potential owner blocking patterns.
- A notable 5.6% of properties secure long booking periods (181+ days booked per year), highlighting successful long-term rental strategies or significant owner usage.
Salles-sur-Mer Airbnb Minimum Stay Requirements Analysis
Distribution of Listings by Minimum Night Requirement
1 Night
4 listings
11.8% of total
2 Nights
12 listings
35.3% of total
3 Nights
10 listings
29.4% of total
4-6 Nights
4 listings
11.8% of total
7-29 Nights
1 listings
2.9% of total
30+ Nights
3 listings
8.8% of total
Key Insights
- The most prevalent minimum stay requirement in Salles-sur-Mer is 2 Nights, adopted by 35.3% of listings. This highlights the market's preference for shorter, flexible bookings.
Recommendations
- Align with the market by considering a 2 Nights minimum stay, as 35.3% of Salles-sur-Mer hosts use this setting.
- If feasible, allowing 1-night stays, especially midweek or during low season, could capture last-minute bookings, as only 11.8% currently do.
- A 2-night minimum appears standard (35.3%). Consider this for weekends or peak periods.
- Explore offering discounts for stays of 30+ nights to attract the 8.8% of the market seeking extended stays.
- Adjust minimum nights based on seasonality – potentially shorter during low season and longer during peak demand periods in Salles-sur-Mer.
Salles-sur-Mer Airbnb Cancellation Policy Trends Analysis (2025)
Flexible
6 listings
19.4% of total
Moderate
7 listings
22.6% of total
Firm
10 listings
32.3% of total
Strict
8 listings
25.8% of total
Cancellation Policy Insights for Salles-sur-Mer
- The prevailing Airbnb cancellation policy trend in Salles-sur-Mer is Firm, used by 32.3% of listings.
- A majority (58.1%) of hosts in Salles-sur-Mer utilize Firm or Strict policies, indicating a market where hosts prioritize booking security.
Recommendations for Hosts
- Consider adopting a Firm policy to align with the 32.3% market standard in Salles-sur-Mer.
- Regularly review your cancellation policy against competitors and market demand shifts in Salles-sur-Mer.
Salles-sur-Mer STR Booking Lead Time Analysis (2025)
Average Booking Lead Time by Month
Booking Lead Time Insights for Salles-sur-Mer
- The overall average booking lead time for vacation rentals in Salles-sur-Mer is 58 days.
- Guests book furthest in advance for stays during May (average 95 days), likely coinciding with peak travel demand or local events.
- The shortest booking windows occur for stays in December (average 46 days), indicating more last-minute travel plans during this time.
- Seasonally, Spring (80 days avg.) sees the longest lead times, while Fall (49 days avg.) has the shortest, reflecting typical travel planning cycles.
Recommendations for Hosts
- Use the overall average lead time (58 days) as a baseline for your pricing and availability strategy in Salles-sur-Mer.
- For May stays, consider implementing length-of-stay discounts or slightly higher rates for bookings made less than 95 days out to capitalize on advance planning.
- Target marketing efforts for the Spring season well in advance (at least 80 days) to capture early planners.
- Monitor your own booking lead times against these Salles-sur-Mer averages to identify opportunities for dynamic pricing adjustments.
Popular & Essential Airbnb Amenities in Salles-sur-Mer (2025)
Amenity Prevalence
Amenity Insights for Salles-sur-Mer
- Popular amenities like Heating, Wifi, Hot water are common but not universal. Offering these can provide a competitive edge.
- Warning: Wifi is not universally provided but is considered essential globally. Ensure reliable Wifi is offered.
Recommendations for Hosts
- Consider adding popular differentiators like Heating or Wifi to increase appeal.
- Highlight unique or less common amenities you offer (e.g., hot tub, dedicated workspace, EV charger) in your listing description and photos.
- Regularly check competitor amenities in Salles-sur-Mer to stay competitive.
Salles-sur-Mer Airbnb Guest Demographics & Profile Analysis (2025)
Guest Profile Summary for Salles-sur-Mer
- The typical guest profile for Airbnb in Salles-sur-Mer consists of primarily domestic travelers (89%), often arriving from nearby Paris, typically belonging to the Post-2000s (Gen Z/Alpha) group (50%), primarily speaking French or English.
- Domestic travelers account for 88.6% of guests.
- Key international markets include France (88.6%) and Belgium (3.4%).
- Top languages spoken are French (56.5%) followed by English (28.7%).
- A significant demographic segment is the Post-2000s (Gen Z/Alpha) group, representing 50% of guests.
Recommendations for Hosts
- Target domestic marketing efforts towards travelers from Paris and Nantes.
- Tailor amenities and listing descriptions to appeal to the dominant Post-2000s (Gen Z/Alpha) demographic (e.g., highlight fast WiFi, smart home features, local guides).
- Highlight unique local experiences or amenities relevant to the primary guest profile.
- Consider seasonal promotions aligned with peak travel times for key origin markets.
Nearby Short-Term Rental Market Comparison
How does the Salles-sur-Mer Airbnb market stack up against its neighbors? Compare key performance metrics like average monthly revenue, ADR, and occupancy rates in surrounding areas to understand the broader regional STR landscape.
| Market | Active Properties | Monthly Revenue | Daily Rate | Avg. Occupancy |
|---|---|---|---|---|
| Vallon-sur-Gée | 11 | $2,913 | $379.01 | 30% |
| Bourneau | 11 | $2,747 | $442.07 | 35% |
| Nuaillé-d'Aunis | 10 | $2,741 | $373.83 | 37% |
| Le Bois-Plage-en-Ré | 303 | $2,528 | $284.63 | 45% |
| Chambellay | 11 | $2,525 | $255.24 | 34% |
| Sainte-Florence | 10 | $2,445 | $233.78 | 46% |
| Saint-Hippolyte | 10 | $2,443 | $204.98 | 44% |
| Abzac | 12 | $2,415 | $349.03 | 36% |
| La Flotte | 396 | $2,382 | $236.53 | 46% |
| Saint-Georges-des-Coteaux | 12 | $2,335 | $187.61 | 43% |