Sallebœuf Airbnb Market Analysis 2025: Short Term Rental Data & Vacation Rental Statistics in Nouvelle-Aquitaine, France
Is Airbnb profitable in Sallebœuf in 2025? Explore comprehensive Airbnb analytics for Sallebœuf, Nouvelle-Aquitaine, France to uncover income potential. This 2025 STR market report for Sallebœuf, based on AirROI data from April 2024 to March 2025, reveals key trends in the niche market of 21 active listings.
Whether you're considering an Airbnb investment in Sallebœuf, optimizing your existing vacation rental, or exploring rental arbitrage opportunities, understanding the Sallebœuf Airbnb data is crucial. Leveraging the low regulation environment is key to maximizing your short term rental income potential. Let's dive into the specifics.
Key Sallebœuf Airbnb Performance Metrics Overview
Monthly Airbnb Revenue Variations & Income Potential in Sallebœuf (2025)
Understanding the monthly revenue variations for Airbnb listings in Sallebœuf is key to maximizing your short term rental income potential. Seasonality significantly impacts earnings. Our analysis, based on data from the past 12 months, shows that the peak revenue month for STRs in Sallebœuf is typically August, while January often presents the lowest earnings, highlighting opportunities for strategic pricing adjustments during shoulder and low seasons. Explore the typical Airbnb income in Sallebœuf across different performance tiers:
- Best-in-class properties (Top 10%) achieve $3,053+ monthly, often utilizing dynamic pricing and superior guest experiences.
- Strong performing properties (Top 25%) earn $1,719 or more, indicating effective management and desirable locations/amenities.
- Typical properties (Median) generate around $825 per month, representing the average market performance.
- Entry-level properties (Bottom 25%) see earnings around $427, often with potential for optimization.
Average Monthly Airbnb Earnings Trend in Sallebœuf
Sallebœuf Airbnb Occupancy Rate Trends (2025)
Maximize your bookings by understanding the Sallebœuf STR occupancy trends. Seasonal demand shifts significantly influence how often properties are booked. Typically, Augustsees the highest demand (peak season occupancy), while November experiences the lowest (low season). Effective strategies, like adjusting minimum stays or offering promotions, can boost occupancy during slower periods. Here's how different property tiers perform in Sallebœuf:
- Best-in-class properties (Top 10%) achieve 75%+ occupancy, indicating high desirability and potentially optimized availability.
- Strong performing properties (Top 25%) maintain 48% or higher occupancy, suggesting good market fit and guest satisfaction.
- Typical properties (Median) have an occupancy rate around 24%.
- Entry-level properties (Bottom 25%) average 11% occupancy, potentially facing higher vacancy.
Average Monthly Occupancy Rate Trend in Sallebœuf
Average Daily Rate (ADR) Airbnb Trends in Sallebœuf (2025)
Effective short term rental pricing strategy in Sallebœuf involves understanding monthly ADR fluctuations. The Average Daily Rate (ADR) for Airbnb in Sallebœuf typically peaks in November and dips lowest during January. Leveraging Airbnb dynamic pricing tools or strategies based on this seasonality can significantly boost revenue. Here's a look at the typical nightly rates achieved:
- Best-in-class properties (Top 10%) command rates of $410+ per night, often due to premium features or locations.
- Strong performing properties (Top 25%) achieve nightly rates of $307 or more.
- Typical properties (Median) charge around $97 per night.
- Entry-level properties (Bottom 25%) earn around $59 per night.
Average Daily Rate (ADR) Trend by Month in Sallebœuf
Get Live Sallebœuf Market Intelligence 👇

Explore Real-time Analytics
Airbnb Seasonality Analysis & Trends in Sallebœuf (2025)
Peak Season (August, July, June)
- Revenue averages $2,454 per month
- Occupancy rates average 44.8%
- Daily rates average $170
Shoulder Season
- Revenue averages $1,078 per month
- Occupancy maintains around 29.7%
- Daily rates hold near $165
Low Season (January, February, November)
- Revenue drops to average $599 per month
- Occupancy decreases to average 30.2%
- Daily rates adjust to average $168
Seasonality Insights for Sallebœuf
- The Airbnb seasonality in Sallebœuf shows highly seasonal trends requiring careful strategy. While the sections above show seasonal averages, it's also insightful to look at the extremes:
- During the high season, the absolute peak month showcases Sallebœuf's highest earning potential, with monthly revenues capable of climbing to $3,089, occupancy reaching a high of 54.2%, and ADRs peaking at $184.
- Conversely, the slowest single month of the year, typically falling within the low season, marks the market's lowest point. In this month, revenue might dip to $541, occupancy could drop to 23.3%, and ADRs may adjust down to $159.
- Understanding both the seasonal averages and these monthly peaks and troughs in revenue, occupancy, and ADR is crucial for maximizing your Airbnb profit potential in Sallebœuf.
Seasonal Strategies for Maximizing Profit
- Peak Season: Maximize revenue through premium pricing and potentially longer minimum stays. Ensure high availability.
- Low Season: Offer competitive pricing, special promotions (e.g., extended stay discounts), and flexible cancellation policies. Target off-season travelers like remote workers or budget-conscious guests.
- Shoulder Seasons: Implement dynamic pricing that balances peak and low rates. Target weekend travelers or specific events. Offer slightly more flexible terms than peak season.
- Regularly analyze your own performance against these Sallebœuf seasonality benchmarks and adjust your pricing and availability strategy accordingly.
Best Areas for Airbnb Investment in Sallebœuf (2025)
Exploring the top neighborhoods for short-term rentals in Sallebœuf? This section highlights key areas, outlining why they are attractive for hosts and guests, along with notable local attractions. Consider these locations based on your target guest profile and investment strategy.
| Neighborhood / Area | Why Host Here? (Target Guests & Appeal) | Key Attractions & Landmarks |
|---|---|---|
| Bordeaux City Center | A vibrant hub with historical architecture and plenty of shops, eateries, and attractions. Ideal for tourists exploring the wine capital of France. | Place de la Bourse, La Cité du Vin, Bordeaux Cathedral, CAPC Musée d'Art Contemporain, Rue Sainte-Catherine |
| Saint-Émilion | Known for its picturesque medieval village and world-renowned vineyards, this area is perfect for wine lovers and tourists seeking charm and beauty. | Saint-Émilion Monolithic Church, Vineyard tours, Baleine Castle, Wine Tasting Cellars, Underground Monolithic City |
| Arcachon Bay | Famous for its stunning beach resorts and the Dune du Pilat, the highest sand dune in Europe. Great for families and outdoor activities. | Dune du Pilat, Arcachon Beach, Île aux Oiseaux, Parc Mauresque, Oyster tasting |
| Lacanau-Océan | A popular seaside destination for surfers and beachgoers, known for its beautiful beaches and lively atmosphere. | Lacanau Beach, Surfing schools, Bike paths, Nature reserves, Restaurants and cafes |
| Cap Ferret | Offers a more relaxed atmosphere compared to other coastal areas, known for its charming cabins and beautiful beaches. Attracts families and nature lovers. | Plage de l'Horizon, Le Phare du Cap Ferret, Bassin d'Arcachon views, Local seafood restaurants, Bike paths along the coast |
| Pauillac | Located in the renowned Bordeaux wine region, this small town is perfect for wine tours and gastronomic experiences. | Châteaux of the Médoc, Wine estates, Bordeaux vineyards, River sightseeing cruises, Local markets |
| Sarlat-la-Canéda | A stunning medieval town known for its preserved architecture and vibrant markets, attracting tourists interested in history and gastronomy. | Sarlat Market, Medieval buildings, La Roque-Gageac, Gastronomic festivals, River Dordogne |
| Cognac | Famous for its brandy production, this town offers distillery tours and a rich cultural experience for alcohol enthusiasts. | Cognac houses (Hennessy, Rémy Martin), Cognac museum, Historic town center, River Charente walks, Gastronomic restaurants |
Understanding Airbnb License Requirements & STR Laws in Sallebœuf (2025)
While Sallebœuf, Nouvelle-Aquitaine, France currently shows low STR regulations, specific Airbnb license requirements might still exist or change. Always verify the latest short term rental regulations and Airbnb license requirements directly with local government authorities for Sallebœuf to ensure full compliance before hosting.
(Source: AirROI data, 2025, based on 5% licensed listings)
Top Performing Airbnb Properties in Sallebœuf (2025)
Benchmark your potential! Explore examples of top-performing Airbnb properties in Sallebœufbased on Trailing Twelve Month (TTM) revenue. Analyze their characteristics, revenue, occupancy rate, and ADR to understand what drives success in this market.
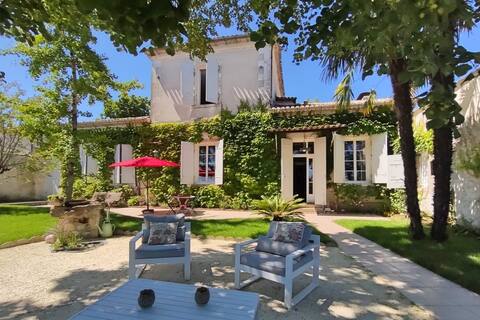
Charming HOUSE 5* near Bordeaux, swimming pool/A/C
Entire Place • 4 bedrooms
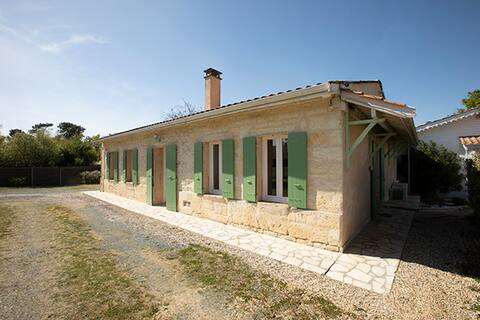
Old Photo Workshop in the heart of the Entre-deux-Mers
Entire Place • 4 bedrooms

Bulle Spa Insolite Cabernet
Entire Place • 1 bedroom
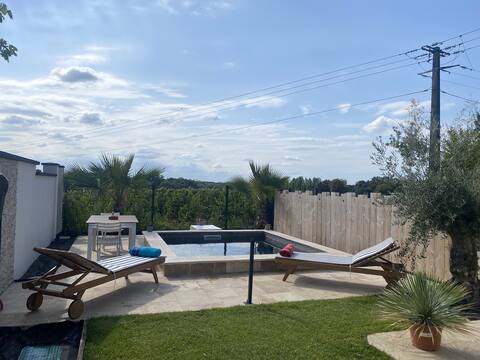
Maison Contemporaine - Piscine
Entire Place • 2 bedrooms
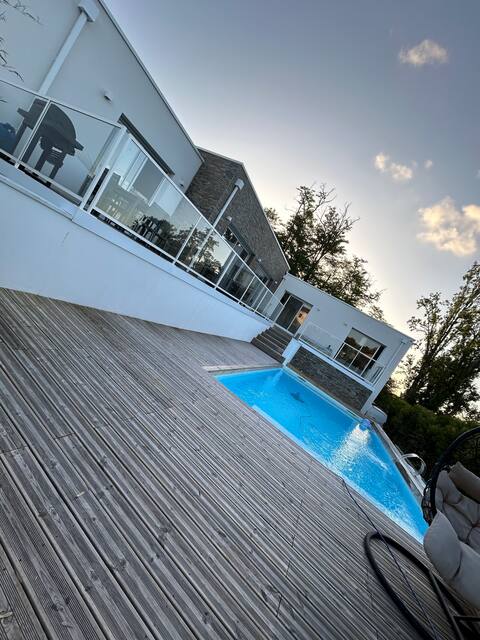
Villa avec piscine
Entire Place • 3 bedrooms

Apartment prox Bordeaux 4 p. private terrace parking
Entire Place • 1 bedroom
Note: Performance varies based on location, size, amenities, seasonality, and management quality. Data reflects the past 12 months.
Top Performing Airbnb Hosts in Sallebœuf (2025)
Learn from the best! This table showcases top-performing Airbnb hosts in Sallebœuf based on the number of properties managed and estimated total revenue over the past year. Analyze their scale and performance metrics.
| Host Name | Properties | Grossing Revenue | Stay Reviews | Avg Rating |
|---|---|---|---|---|
| Host #21975719 | 5 | $55,691 | 1 | 0.00/5.0 |
| Mathilde | 1 | $33,285 | 12 | 5.00/5.0 |
| Valerie | 1 | $26,755 | 20 | 5.00/5.0 |
| Host #423570694 | 1 | $20,577 | 3 | 5.00/5.0 |
| Host #394136387 | 1 | $16,100 | 1 | 0.00/5.0 |
| Aurelie | 1 | $12,151 | 166 | 4.78/5.0 |
| Laure | 1 | $11,148 | 94 | 4.82/5.0 |
| Geneviève | 1 | $7,647 | 20 | 4.90/5.0 |
| Damien | 1 | $7,449 | 10 | 4.90/5.0 |
| Danielle | 1 | $6,934 | 37 | 4.89/5.0 |
Analyzing the strategies of top hosts, such as their property selection, pricing, and guest communication, can offer valuable lessons for optimizing your own Airbnb operations in Sallebœuf.
Dive Deeper: Advanced Sallebœuf STR Market Data (2025)
Ready to unlock more insights? AirROI provides access to advanced metrics and comprehensive Airbnb data for Sallebœuf. Explore detailed analytics beyond this report to refine your investment strategy, optimize pricing, and maximize your vacation rental profits.
Explore Advanced MetricsSallebœuf Short-Term Rental Market Composition (2025): Property & Room Types
Room Type Distribution
Property Type Distribution
Market Composition Insights for Sallebœuf
- The Sallebœuf Airbnb market composition is heavily skewed towards Entire Home/Apt listings, which make up 81% of the 21 active rentals. This indicates strong guest preference for privacy and space.
- Looking at the property type distribution in Sallebœuf, House properties are the most common (47.6%), reflecting the local real estate landscape.
- Houses represent a significant 47.6% portion, catering likely to families or larger groups.
- The presence of 9.5% Hotel/Boutique listings indicates integration with traditional hospitality.
- Smaller segments like outdoor/unique (combined 4.8%) offer potential for unique stay experiences.
Sallebœuf Airbnb Room Capacity Analysis (2025): Bedroom Distribution
Distribution of Listings by Number of Bedrooms
Room Capacity Insights for Sallebœuf
- The dominant room capacity in Sallebœuf is 1 bedroom listings, making up 52.4% of the market. This suggests a strong demand for properties suitable for couples or solo travelers.
- Together, 1 bedroom and 2 bedrooms properties represent 61.9% of the active Airbnb listings in Sallebœuf, indicating a high concentration in these sizes.
- With over half the market (52.4%) consisting of studios or 1-bedroom units, Sallebœuf is particularly well-suited for individuals or couples.
Sallebœuf Vacation Rental Guest Capacity Trends (2025)
Distribution of Listings by Guest Capacity
Guest Capacity Insights for Sallebœuf
- The most common guest capacity trend in Sallebœuf vacation rentals is listings accommodating 2 guests (33.3%). This suggests the primary traveler segment is likely couples or solo travelers.
- Properties designed for 2 guests and 4 guests dominate the Sallebœuf STR market, accounting for 57.1% of listings.
- 19.1% of properties accommodate 6+ guests, serving the market segment for larger families or group travel in Sallebœuf.
- On average, properties in Sallebœuf are equipped to host 3.1 guests.
Sallebœuf Airbnb Booking Patterns (2025): Available vs. Booked Days
Available Days Distribution
Booked Days Distribution
Booking Pattern Insights for Sallebœuf
- The most common availability pattern in Sallebœuf falls within the 271-366 days range, representing 66.7% of listings. This suggests many properties have significant open periods on their calendars.
- Approximately 95.3% of listings show high availability (181+ days open annually), indicating potential for increased bookings or specific owner usage patterns.
- For booked days, the 1-30 days range is most frequent in Sallebœuf (38.1%), reflecting common guest stay durations or potential owner blocking patterns.
- A notable 4.8% of properties secure long booking periods (181+ days booked per year), highlighting successful long-term rental strategies or significant owner usage.
Sallebœuf Airbnb Minimum Stay Requirements Analysis
Distribution of Listings by Minimum Night Requirement
1 Night
7 listings
46.7% of total
2 Nights
4 listings
26.7% of total
3 Nights
1 listings
6.7% of total
7-29 Nights
3 listings
20% of total
Key Insights
- The most prevalent minimum stay requirement in Sallebœuf is 1 Night, adopted by 46.7% of listings. This highlights the market's preference for shorter, flexible bookings.
- A strong majority (73.4%) of the Sallebœuf Airbnb data shows acceptance of very short stays (1-2 nights), indicating a dynamic, high-turnover market.
Recommendations
- Align with the market by considering a 1 Night minimum stay, as 46.7% of Sallebœuf hosts use this setting.
- Adjust minimum nights based on seasonality – potentially shorter during low season and longer during peak demand periods in Sallebœuf.
Sallebœuf Airbnb Cancellation Policy Trends Analysis (2025)
Flexible
6 listings
42.9% of total
Moderate
2 listings
14.3% of total
Firm
3 listings
21.4% of total
Strict
3 listings
21.4% of total
Cancellation Policy Insights for Sallebœuf
- The prevailing Airbnb cancellation policy trend in Sallebœuf is Flexible, used by 42.9% of listings.
- There's a relatively balanced mix between guest-friendly (57.2%) and stricter (42.8%) policies, offering choices for different guest needs.
Recommendations for Hosts
- Consider adopting a Flexible policy to align with the 42.9% market standard in Sallebœuf.
- Regularly review your cancellation policy against competitors and market demand shifts in Sallebœuf.
Sallebœuf STR Booking Lead Time Analysis (2025)
Average Booking Lead Time by Month
Booking Lead Time Insights for Sallebœuf
- The overall average booking lead time for vacation rentals in Sallebœuf is 46 days.
- Guests book furthest in advance for stays during July (average 61 days), likely coinciding with peak travel demand or local events.
- The shortest booking windows occur for stays in March (average 21 days), indicating more last-minute travel plans during this time.
- Seasonally, Summer (53 days avg.) sees the longest lead times, while Winter (31 days avg.) has the shortest, reflecting typical travel planning cycles.
Recommendations for Hosts
- Use the overall average lead time (46 days) as a baseline for your pricing and availability strategy in Sallebœuf.
- For July stays, consider implementing length-of-stay discounts or slightly higher rates for bookings made less than 61 days out to capitalize on advance planning.
- Target marketing efforts for the Summer season well in advance (at least 53 days) to capture early planners.
- Monitor your own booking lead times against these Sallebœuf averages to identify opportunities for dynamic pricing adjustments.
Popular & Essential Airbnb Amenities in Sallebœuf (2025)
Amenity Prevalence
Amenity Insights for Sallebœuf
- Popular amenities like Wifi, Free parking on premises, Smoke alarm are common but not universal. Offering these can provide a competitive edge.
- Warning: Wifi is not universally provided but is considered essential globally. Ensure reliable Wifi is offered.
Recommendations for Hosts
- Consider adding popular differentiators like Wifi or Free parking on premises to increase appeal.
- Highlight unique or less common amenities you offer (e.g., hot tub, dedicated workspace, EV charger) in your listing description and photos.
- Regularly check competitor amenities in Sallebœuf to stay competitive.
Sallebœuf Airbnb Guest Demographics & Profile Analysis (2025)
Guest Profile Summary for Sallebœuf
- The typical guest profile for Airbnb in Sallebœuf consists of primarily domestic travelers (81%), often arriving from nearby Toulouse, typically belonging to the Post-2000s (Gen Z/Alpha) group (50%), primarily speaking French or English.
- Domestic travelers account for 80.8% of guests.
- Key international markets include France (80.8%) and Netherlands (4.1%).
- Top languages spoken are French (37.7%) followed by English (29%).
- A significant demographic segment is the Post-2000s (Gen Z/Alpha) group, representing 50% of guests.
Recommendations for Hosts
- Target domestic marketing efforts towards travelers from Toulouse and Plouédern.
- Tailor amenities and listing descriptions to appeal to the dominant Post-2000s (Gen Z/Alpha) demographic (e.g., highlight fast WiFi, smart home features, local guides).
- Highlight unique local experiences or amenities relevant to the primary guest profile.
- Consider seasonal promotions aligned with peak travel times for key origin markets.
Nearby Short-Term Rental Market Comparison
How does the Sallebœuf Airbnb market stack up against its neighbors? Compare key performance metrics like average monthly revenue, ADR, and occupancy rates in surrounding areas to understand the broader regional STR landscape.
| Market | Active Properties | Monthly Revenue | Daily Rate | Avg. Occupancy |
|---|---|---|---|---|
| San Sebastián | 1,426 | $3,546 | $262.81 | 49% |
| Saint-Laurent-des-Combes | 11 | $3,526 | $706.18 | 23% |
| Astaffort | 10 | $3,393 | $314.20 | 35% |
| Cénac | 18 | $2,773 | $268.58 | 53% |
| Cérons | 11 | $2,635 | $196.16 | 39% |
| Galgon | 12 | $2,599 | $210.34 | 48% |
| Hernani | 11 | $2,572 | $345.16 | 40% |
| Eynesse | 14 | $2,564 | $282.87 | 36% |
| Bourrou | 10 | $2,475 | $247.57 | 36% |
| Saint-Hippolyte | 10 | $2,443 | $204.98 | 44% |