Saint-Savinien Airbnb Market Analysis 2025: Short Term Rental Data & Vacation Rental Statistics in Nouvelle-Aquitaine, France
Is Airbnb profitable in Saint-Savinien in 2025? Explore comprehensive Airbnb analytics for Saint-Savinien, Nouvelle-Aquitaine, France to uncover income potential. This 2025 STR market report for Saint-Savinien, based on AirROI data from April 2024 to March 2025, reveals key trends in the niche market of 33 active listings.
Whether you're considering an Airbnb investment in Saint-Savinien, optimizing your existing vacation rental, or exploring rental arbitrage opportunities, understanding the Saint-Savinien Airbnb data is crucial. Understanding the local regulations is key to maximizing your short term rental income potential. Let's dive into the specifics.
Key Saint-Savinien Airbnb Performance Metrics Overview
Monthly Airbnb Revenue Variations & Income Potential in Saint-Savinien (2025)
Understanding the monthly revenue variations for Airbnb listings in Saint-Savinien is key to maximizing your short term rental income potential. Seasonality significantly impacts earnings. Our analysis, based on data from the past 12 months, shows that the peak revenue month for STRs in Saint-Savinien is typically August, while March often presents the lowest earnings, highlighting opportunities for strategic pricing adjustments during shoulder and low seasons. Explore the typical Airbnb income in Saint-Savinien across different performance tiers:
- Best-in-class properties (Top 10%) achieve $2,496+ monthly, often utilizing dynamic pricing and superior guest experiences.
- Strong performing properties (Top 25%) earn $1,541 or more, indicating effective management and desirable locations/amenities.
- Typical properties (Median) generate around $858 per month, representing the average market performance.
- Entry-level properties (Bottom 25%) see earnings around $426, often with potential for optimization.
Average Monthly Airbnb Earnings Trend in Saint-Savinien
Saint-Savinien Airbnb Occupancy Rate Trends (2025)
Maximize your bookings by understanding the Saint-Savinien STR occupancy trends. Seasonal demand shifts significantly influence how often properties are booked. Typically, Augustsees the highest demand (peak season occupancy), while March experiences the lowest (low season). Effective strategies, like adjusting minimum stays or offering promotions, can boost occupancy during slower periods. Here's how different property tiers perform in Saint-Savinien:
- Best-in-class properties (Top 10%) achieve 64%+ occupancy, indicating high desirability and potentially optimized availability.
- Strong performing properties (Top 25%) maintain 45% or higher occupancy, suggesting good market fit and guest satisfaction.
- Typical properties (Median) have an occupancy rate around 28%.
- Entry-level properties (Bottom 25%) average 16% occupancy, potentially facing higher vacancy.
Average Monthly Occupancy Rate Trend in Saint-Savinien
Average Daily Rate (ADR) Airbnb Trends in Saint-Savinien (2025)
Effective short term rental pricing strategy in Saint-Savinien involves understanding monthly ADR fluctuations. The Average Daily Rate (ADR) for Airbnb in Saint-Savinien typically peaks in August and dips lowest during February. Leveraging Airbnb dynamic pricing tools or strategies based on this seasonality can significantly boost revenue. Here's a look at the typical nightly rates achieved:
- Best-in-class properties (Top 10%) command rates of $223+ per night, often due to premium features or locations.
- Strong performing properties (Top 25%) achieve nightly rates of $145 or more.
- Typical properties (Median) charge around $96 per night.
- Entry-level properties (Bottom 25%) earn around $67 per night.
Average Daily Rate (ADR) Trend by Month in Saint-Savinien
Get Live Saint-Savinien Market Intelligence 👇

Explore Real-time Analytics
Airbnb Seasonality Analysis & Trends in Saint-Savinien (2025)
Peak Season (August, June, May)
- Revenue averages $2,100 per month
- Occupancy rates average 45.9%
- Daily rates average $126
Shoulder Season
- Revenue averages $1,236 per month
- Occupancy maintains around 31.0%
- Daily rates hold near $125
Low Season (January, February, March)
- Revenue drops to average $500 per month
- Occupancy decreases to average 24.2%
- Daily rates adjust to average $119
Seasonality Insights for Saint-Savinien
- The Airbnb seasonality in Saint-Savinien shows highly seasonal trends requiring careful strategy. While the sections above show seasonal averages, it's also insightful to look at the extremes:
- During the high season, the absolute peak month showcases Saint-Savinien's highest earning potential, with monthly revenues capable of climbing to $2,502, occupancy reaching a high of 64.5%, and ADRs peaking at $129.
- Conversely, the slowest single month of the year, typically falling within the low season, marks the market's lowest point. In this month, revenue might dip to $387, occupancy could drop to 19.5%, and ADRs may adjust down to $118.
- Understanding both the seasonal averages and these monthly peaks and troughs in revenue, occupancy, and ADR is crucial for maximizing your Airbnb profit potential in Saint-Savinien.
Seasonal Strategies for Maximizing Profit
- Peak Season: Maximize revenue through premium pricing and potentially longer minimum stays. Ensure high availability.
- Low Season: Offer competitive pricing, special promotions (e.g., extended stay discounts), and flexible cancellation policies. Target off-season travelers like remote workers or budget-conscious guests.
- Shoulder Seasons: Implement dynamic pricing that balances peak and low rates. Target weekend travelers or specific events. Offer slightly more flexible terms than peak season.
- Regularly analyze your own performance against these Saint-Savinien seasonality benchmarks and adjust your pricing and availability strategy accordingly.
Best Areas for Airbnb Investment in Saint-Savinien (2025)
Exploring the top neighborhoods for short-term rentals in Saint-Savinien? This section highlights key areas, outlining why they are attractive for hosts and guests, along with notable local attractions. Consider these locations based on your target guest profile and investment strategy.
| Neighborhood / Area | Why Host Here? (Target Guests & Appeal) | Key Attractions & Landmarks |
|---|---|---|
| Centre-Ville | The heart of Saint-Savinien, featuring charming streets, local shops, and access to the river. Great for visitors wanting an authentic experience and proximity to local amenities. | Église Saint-Savinien, Place de l'Église, Les bords de la Charente, La Maison du Patrimoine, Parc de la mairie |
| Les Jardins de la Charente | A picturesque area along the banks of the Charente River, ideal for nature lovers and those seeking tranquility. Perfect for families and couples looking for a peaceful retreat. | Charente River walks, La Plage de Saint-Savinien, Canoeing and kayaking, Fishing spots, Picnic areas along the river |
| Le Bourg | A quaint village neighborhood that offers a glimpse into local life, with traditional French architecture and friendly locals. Attractive for visitors seeking a quiet, rural experience. | Local markets, Village festivals, Traditional bakeries, Nearby vineyards, Cycling routes |
| Les Petits Vignes | A residential area with a mix of scenic vineyards and rural charm. Perfect for guests who appreciate wine tourism and the culinary delights of the region. | Wine tasting tours, Vineyard visits, Gourmet restaurants, Scenic bike paths, Local artisans |
| Rue de l'Église | A lively street known for its cultural events and community gatherings. This area attracts visitors interested in local history and cultural immersion. | Cultural festivals, Art exhibitions, Local eateries, Historical landmarks, Community events |
| Les Rives de la Charente | A beautiful riverside area that offers scenic views and outdoor activities. Ideal for active travelers and those looking to enjoy water-based leisure. | Water sports, Walking and cycling paths, Fishing spots, Picnic areas, Scenic lookouts |
| Saint-Savinien Market Area | The area around the local market is vibrant with food stalls and shops. Attractive for foodies and those looking to experience local cuisine and products. | Weekly farmers market, Local produce, Food stalls, Bakeries, Cheese shops |
| Nearby Tourist Attractions | Proximity to nearby popular tourist destinations adds value to hosting in Saint-Savinien, as guests can easily explore the wider region. | Historic sites in Saintes, Cognac distilleries, La Rochelle beaches, Rochefort naval base, Puy du Fou theme park |
Understanding Airbnb License Requirements & STR Laws in Saint-Savinien (2025)
With 15% of listings showing registration in 2025, understanding potential Airbnb license requirements is crucial in Saint-Savinien. Always verify the latest short term rental regulations and Airbnb license requirements directly with local government authorities for Saint-Savinien to ensure full compliance before hosting.
(Source: AirROI data, 2025, based on 15% licensed listings)
Top Performing Airbnb Properties in Saint-Savinien (2025)
Benchmark your potential! Explore examples of top-performing Airbnb properties in Saint-Savinienbased on Trailing Twelve Month (TTM) revenue. Analyze their characteristics, revenue, occupancy rate, and ADR to understand what drives success in this market.
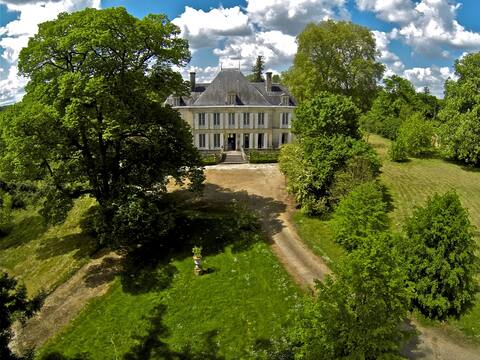
Small chateau ***, pool, private estate
Entire Place • 8 bedrooms

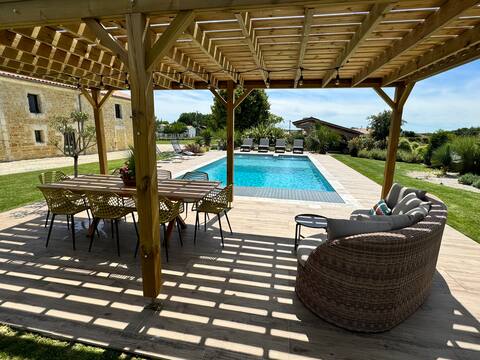
Saint Savinien , cozy villa with pool
Entire Place • 3 bedrooms
Gîte de la "Petite Vallée"
Entire Place • 1 bedroom
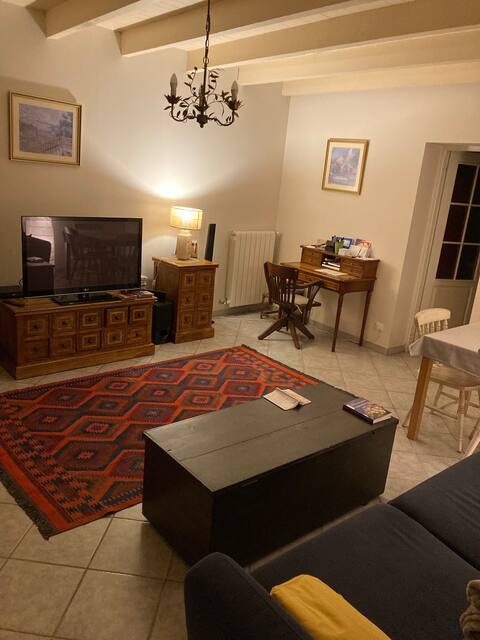
Luxury 1 bed house with shared pool
Entire Place • 1 bedroom
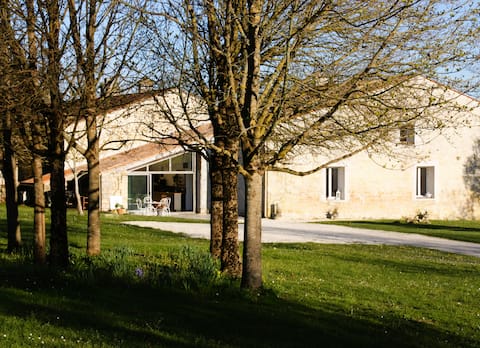
Maison en Charente
Entire Place • 3 bedrooms
Charming Mansion ***, pool, nice garden
Entire Place • 7 bedrooms
Note: Performance varies based on location, size, amenities, seasonality, and management quality. Data reflects the past 12 months.
Top Performing Airbnb Hosts in Saint-Savinien (2025)
Learn from the best! This table showcases top-performing Airbnb hosts in Saint-Savinien based on the number of properties managed and estimated total revenue over the past year. Analyze their scale and performance metrics.
| Host Name | Properties | Grossing Revenue | Stay Reviews | Avg Rating |
|---|---|---|---|---|
| Arnaud | 2 | $81,133 | 90 | 4.71/5.0 |
| Elisabeth | 2 | $29,110 | 27 | 4.88/5.0 |
| Geneviève | 2 | $24,087 | 26 | 5.00/5.0 |
| Cécile | 2 | $20,571 | 10 | 5.00/5.0 |
| Sylvie | 1 | $20,410 | 17 | 5.00/5.0 |
| Danielle | 1 | $18,963 | 4 | 5.00/5.0 |
| Pascal | 1 | $18,169 | 9 | 5.00/5.0 |
| Myriam | 1 | $17,404 | 21 | 5.00/5.0 |
| Frederique | 2 | $16,317 | 157 | 4.67/5.0 |
| Host #153911376 | 4 | $14,501 | 1 | 0.00/5.0 |
Analyzing the strategies of top hosts, such as their property selection, pricing, and guest communication, can offer valuable lessons for optimizing your own Airbnb operations in Saint-Savinien.
Dive Deeper: Advanced Saint-Savinien STR Market Data (2025)
Ready to unlock more insights? AirROI provides access to advanced metrics and comprehensive Airbnb data for Saint-Savinien. Explore detailed analytics beyond this report to refine your investment strategy, optimize pricing, and maximize your vacation rental profits.
Explore Advanced MetricsSaint-Savinien Short-Term Rental Market Composition (2025): Property & Room Types
Room Type Distribution
Property Type Distribution
Market Composition Insights for Saint-Savinien
- The Saint-Savinien Airbnb market composition is heavily skewed towards Entire Home/Apt listings, which make up 75.8% of the 33 active rentals. This indicates strong guest preference for privacy and space.
- Looking at the property type distribution in Saint-Savinien, House properties are the most common (57.6%), reflecting the local real estate landscape.
- Houses represent a significant 57.6% portion, catering likely to families or larger groups.
- The presence of 18.2% Hotel/Boutique listings indicates integration with traditional hospitality.
- Smaller segments like outdoor/unique (combined 3.0%) offer potential for unique stay experiences.
Saint-Savinien Airbnb Room Capacity Analysis (2025): Bedroom Distribution
Distribution of Listings by Number of Bedrooms
Room Capacity Insights for Saint-Savinien
- The dominant room capacity in Saint-Savinien is 1 bedroom listings, making up 30.3% of the market. This suggests a strong demand for properties suitable for couples or solo travelers.
- Together, 1 bedroom and 2 bedrooms properties represent 57.6% of the active Airbnb listings in Saint-Savinien, indicating a high concentration in these sizes.
- A significant 27.3% of listings offer 3+ bedrooms, catering to larger groups and families seeking more space in Saint-Savinien.
Saint-Savinien Vacation Rental Guest Capacity Trends (2025)
Distribution of Listings by Guest Capacity
Guest Capacity Insights for Saint-Savinien
- The most common guest capacity trend in Saint-Savinien vacation rentals is listings accommodating 6 guests (27.3%). This suggests the primary traveler segment is likely larger groups.
- Properties designed for 6 guests and 2 guests dominate the Saint-Savinien STR market, accounting for 48.5% of listings.
- 39.4% of properties accommodate 6+ guests, serving the market segment for larger families or group travel in Saint-Savinien.
- On average, properties in Saint-Savinien are equipped to host 3.8 guests.
Saint-Savinien Airbnb Booking Patterns (2025): Available vs. Booked Days
Available Days Distribution
Booked Days Distribution
Booking Pattern Insights for Saint-Savinien
- The most common availability pattern in Saint-Savinien falls within the 271-366 days range, representing 51.5% of listings. This suggests many properties have significant open periods on their calendars.
- Approximately 87.9% of listings show high availability (181+ days open annually), indicating potential for increased bookings or specific owner usage patterns.
- For booked days, the 91-180 days range is most frequent in Saint-Savinien (36.4%), reflecting common guest stay durations or potential owner blocking patterns.
- A notable 12.1% of properties secure long booking periods (181+ days booked per year), highlighting successful long-term rental strategies or significant owner usage.
Saint-Savinien Airbnb Minimum Stay Requirements Analysis
Distribution of Listings by Minimum Night Requirement
1 Night
15 listings
45.5% of total
2 Nights
9 listings
27.3% of total
3 Nights
4 listings
12.1% of total
4-6 Nights
2 listings
6.1% of total
7-29 Nights
2 listings
6.1% of total
30+ Nights
1 listings
3% of total
Key Insights
- The most prevalent minimum stay requirement in Saint-Savinien is 1 Night, adopted by 45.5% of listings. This highlights the market's preference for shorter, flexible bookings.
- A strong majority (72.8%) of the Saint-Savinien Airbnb data shows acceptance of very short stays (1-2 nights), indicating a dynamic, high-turnover market.
Recommendations
- Align with the market by considering a 1 Night minimum stay, as 45.5% of Saint-Savinien hosts use this setting.
- Adjust minimum nights based on seasonality – potentially shorter during low season and longer during peak demand periods in Saint-Savinien.
Saint-Savinien Airbnb Cancellation Policy Trends Analysis (2025)
Flexible
8 listings
32% of total
Moderate
7 listings
28% of total
Firm
4 listings
16% of total
Strict
6 listings
24% of total
Cancellation Policy Insights for Saint-Savinien
- The prevailing Airbnb cancellation policy trend in Saint-Savinien is Flexible, used by 32% of listings.
- There's a relatively balanced mix between guest-friendly (60.0%) and stricter (40.0%) policies, offering choices for different guest needs.
Recommendations for Hosts
- Consider adopting a Flexible policy to align with the 32% market standard in Saint-Savinien.
- Regularly review your cancellation policy against competitors and market demand shifts in Saint-Savinien.
Saint-Savinien STR Booking Lead Time Analysis (2025)
Average Booking Lead Time by Month
Booking Lead Time Insights for Saint-Savinien
- The overall average booking lead time for vacation rentals in Saint-Savinien is 47 days.
- Guests book furthest in advance for stays during July (average 89 days), likely coinciding with peak travel demand or local events.
- The shortest booking windows occur for stays in November (average 12 days), indicating more last-minute travel plans during this time.
- Seasonally, Summer (80 days avg.) sees the longest lead times, while Winter (26 days avg.) has the shortest, reflecting typical travel planning cycles.
Recommendations for Hosts
- Use the overall average lead time (47 days) as a baseline for your pricing and availability strategy in Saint-Savinien.
- For July stays, consider implementing length-of-stay discounts or slightly higher rates for bookings made less than 89 days out to capitalize on advance planning.
- During November, focus on last-minute booking availability and promotions, as guests book with very short notice (12 days avg.).
- Target marketing efforts for the Summer season well in advance (at least 80 days) to capture early planners.
- Monitor your own booking lead times against these Saint-Savinien averages to identify opportunities for dynamic pricing adjustments.
Popular & Essential Airbnb Amenities in Saint-Savinien (2025)
Amenity Prevalence
Amenity Insights for Saint-Savinien
- Popular amenities like Free parking on premises, TV, Heating are common but not universal. Offering these can provide a competitive edge.
- Warning: Wifi is not universally provided but is considered essential globally. Ensure reliable Wifi is offered.
Recommendations for Hosts
- Consider adding popular differentiators like Free parking on premises or TV to increase appeal.
- Highlight unique or less common amenities you offer (e.g., hot tub, dedicated workspace, EV charger) in your listing description and photos.
- Regularly check competitor amenities in Saint-Savinien to stay competitive.
Saint-Savinien Airbnb Guest Demographics & Profile Analysis (2025)
Guest Profile Summary for Saint-Savinien
- The typical guest profile for Airbnb in Saint-Savinien consists of primarily domestic travelers (84%), often arriving from nearby Paris, typically belonging to the Post-2000s (Gen Z/Alpha) group (50%), primarily speaking French or English.
- Domestic travelers account for 84.3% of guests.
- Key international markets include France (84.3%) and United Kingdom (5%).
- Top languages spoken are French (43.8%) followed by English (34.4%).
- A significant demographic segment is the Post-2000s (Gen Z/Alpha) group, representing 50% of guests.
Recommendations for Hosts
- Target domestic marketing efforts towards travelers from Paris and Bordeaux.
- Tailor amenities and listing descriptions to appeal to the dominant Post-2000s (Gen Z/Alpha) demographic (e.g., highlight fast WiFi, smart home features, local guides).
- Highlight unique local experiences or amenities relevant to the primary guest profile.
- Consider seasonal promotions aligned with peak travel times for key origin markets.
Nearby Short-Term Rental Market Comparison
How does the Saint-Savinien Airbnb market stack up against its neighbors? Compare key performance metrics like average monthly revenue, ADR, and occupancy rates in surrounding areas to understand the broader regional STR landscape.
| Market | Active Properties | Monthly Revenue | Daily Rate | Avg. Occupancy |
|---|---|---|---|---|
| Saint-Laurent-des-Combes | 11 | $3,526 | $706.18 | 23% |
| Astaffort | 10 | $3,393 | $314.20 | 35% |
| Cénac | 18 | $2,773 | $268.58 | 53% |
| Bourneau | 11 | $2,747 | $442.07 | 35% |
| Nuaillé-d'Aunis | 10 | $2,741 | $373.83 | 37% |
| Cérons | 11 | $2,635 | $196.16 | 39% |
| Galgon | 12 | $2,599 | $210.34 | 48% |
| Eynesse | 14 | $2,564 | $282.87 | 36% |
| Le Bois-Plage-en-Ré | 303 | $2,528 | $284.63 | 45% |
| Le Grand-Pressigny | 11 | $2,511 | $266.72 | 31% |