Saint-Sauveur Airbnb Market Analysis 2025: Short Term Rental Data & Vacation Rental Statistics in Nouvelle-Aquitaine, France
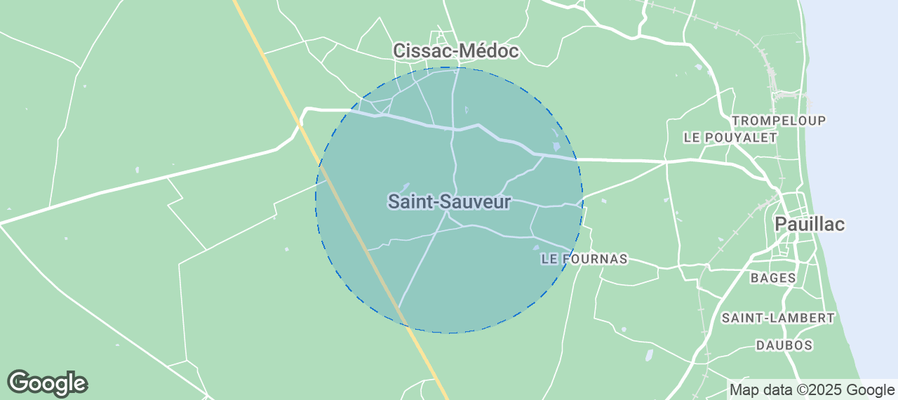
Is Airbnb profitable in Saint-Sauveur in 2025? Explore comprehensive Airbnb analytics for Saint-Sauveur, Nouvelle-Aquitaine, France to uncover income potential. This 2025 STR market report for Saint-Sauveur, based on AirROI data from April 2024 to March 2025, reveals key trends in the niche market of 17 active listings.
Whether you're considering an Airbnb investment in Saint-Sauveur, optimizing your existing vacation rental, or exploring rental arbitrage opportunities, understanding the Saint-Sauveur Airbnb data is crucial. Understanding the local regulations is key to maximizing your short term rental income potential. Let's dive into the specifics.
Key Saint-Sauveur Airbnb Performance Metrics Overview
Monthly Airbnb Revenue Variations & Income Potential in Saint-Sauveur (2025)
Understanding the monthly revenue variations for Airbnb listings in Saint-Sauveur is key to maximizing your short term rental income potential. Seasonality significantly impacts earnings. Our analysis, based on data from the past 12 months, shows that the peak revenue month for STRs in Saint-Sauveur is typically August, while February often presents the lowest earnings, highlighting opportunities for strategic pricing adjustments during shoulder and low seasons. Explore the typical Airbnb income in Saint-Sauveur across different performance tiers:
- Best-in-class properties (Top 10%) achieve $2,096+ monthly, often utilizing dynamic pricing and superior guest experiences.
- Strong performing properties (Top 25%) earn $1,307 or more, indicating effective management and desirable locations/amenities.
- Typical properties (Median) generate around $921 per month, representing the average market performance.
- Entry-level properties (Bottom 25%) see earnings around $517, often with potential for optimization.
Average Monthly Airbnb Earnings Trend in Saint-Sauveur
Saint-Sauveur Airbnb Occupancy Rate Trends (2025)
Maximize your bookings by understanding the Saint-Sauveur STR occupancy trends. Seasonal demand shifts significantly influence how often properties are booked. Typically, Augustsees the highest demand (peak season occupancy), while January experiences the lowest (low season). Effective strategies, like adjusting minimum stays or offering promotions, can boost occupancy during slower periods. Here's how different property tiers perform in Saint-Sauveur:
- Best-in-class properties (Top 10%) achieve 63%+ occupancy, indicating high desirability and potentially optimized availability.
- Strong performing properties (Top 25%) maintain 45% or higher occupancy, suggesting good market fit and guest satisfaction.
- Typical properties (Median) have an occupancy rate around 32%.
- Entry-level properties (Bottom 25%) average 20% occupancy, potentially facing higher vacancy.
Average Monthly Occupancy Rate Trend in Saint-Sauveur
Average Daily Rate (ADR) Airbnb Trends in Saint-Sauveur (2025)
Effective short term rental pricing strategy in Saint-Sauveur involves understanding monthly ADR fluctuations. The Average Daily Rate (ADR) for Airbnb in Saint-Sauveur typically peaks in August and dips lowest during December. Leveraging Airbnb dynamic pricing tools or strategies based on this seasonality can significantly boost revenue. Here's a look at the typical nightly rates achieved:
- Best-in-class properties (Top 10%) command rates of $236+ per night, often due to premium features or locations.
- Strong performing properties (Top 25%) achieve nightly rates of $127 or more.
- Typical properties (Median) charge around $88 per night.
- Entry-level properties (Bottom 25%) earn around $65 per night.
Average Daily Rate (ADR) Trend by Month in Saint-Sauveur
Get Live Saint-Sauveur Market Intelligence 👇
Explore Real-time Analytics
Airbnb Seasonality Analysis & Trends in Saint-Sauveur (2025)
Peak Season (August, May, July)
- Revenue averages $1,952 per month
- Occupancy rates average 55.9%
- Daily rates average $146
Shoulder Season
- Revenue averages $1,030 per month
- Occupancy maintains around 33.5%
- Daily rates hold near $134
Low Season (January, February, March)
- Revenue drops to average $307 per month
- Occupancy decreases to average 16.0%
- Daily rates adjust to average $122
Seasonality Insights for Saint-Sauveur
- The Airbnb seasonality in Saint-Sauveur shows highly seasonal trends requiring careful strategy. While the sections above show seasonal averages, it's also insightful to look at the extremes:
- During the high season, the absolute peak month showcases Saint-Sauveur's highest earning potential, with monthly revenues capable of climbing to $2,331, occupancy reaching a high of 75.9%, and ADRs peaking at $152.
- Conversely, the slowest single month of the year, typically falling within the low season, marks the market's lowest point. In this month, revenue might dip to $255, occupancy could drop to 12.1%, and ADRs may adjust down to $121.
- Understanding both the seasonal averages and these monthly peaks and troughs in revenue, occupancy, and ADR is crucial for maximizing your Airbnb profit potential in Saint-Sauveur.
Seasonal Strategies for Maximizing Profit
- Peak Season: Maximize revenue through premium pricing and potentially longer minimum stays. Ensure high availability.
- Low Season: Offer competitive pricing, special promotions (e.g., extended stay discounts), and flexible cancellation policies. Target off-season travelers like remote workers or budget-conscious guests.
- Shoulder Seasons: Implement dynamic pricing that balances peak and low rates. Target weekend travelers or specific events. Offer slightly more flexible terms than peak season.
- Regularly analyze your own performance against these Saint-Sauveur seasonality benchmarks and adjust your pricing and availability strategy accordingly.
Best Areas for Airbnb Investment in Saint-Sauveur (2025)
Exploring the top neighborhoods for short-term rentals in Saint-Sauveur? This section highlights key areas, outlining why they are attractive for hosts and guests, along with notable local attractions. Consider these locations based on your target guest profile and investment strategy.
| Neighborhood / Area | Why Host Here? (Target Guests & Appeal) | Key Attractions & Landmarks |
|---|---|---|
| Saint-Sauveur Town Center | The lively heart of Saint-Sauveur with shops, restaurants, and local culture. Ideal for guests wanting easy access to amenities and entertainment. | Saint-Sauveur Church, Local boutiques, Cafés, Art galleries, Farmers market |
| Saint-Sauveur Ski Resort | A prime destination for winter sports enthusiasts. Guests flock here for skiing, making it a hot spot during the winter months. | Alpine Ski Area, Snowshoeing trails, Winter festivals, Ski schools, Après-ski bars |
| Les Chênes | A serene residential area offering beautiful landscapes and outdoor activities such as hiking and biking, perfect for nature lovers. | Beautiful hiking trails, Picnic areas, Local parks, Natural scenery, Wildlife spots |
| Lac des Écoles | A picturesque lake area attracting visitors looking for recreational activities in summer such as swimming, fishing, and relaxing by the water. | Swimming area, Fishing spots, Walking paths, Picnic spots, Beach area |
| Saint-Sauveur Village | Charming village atmosphere with local events and community gatherings. Great for guests wanting an authentic small-town experience. | Local events, Festivals, Community centers, Markets, Heritage buildings |
| Sentier des Douaniers | A coastal walking path that showcases beautiful seaside views. Ideal for guests who enjoy long walks and nature exploration. | Scenic coastal paths, Beach access, Wildlife viewing, Photography spots, Resting areas |
| Cascades de la Vernière | A stunning natural waterfall area perfect for photography and relaxation. Attracts visitors looking for scenic beauty and tranquility. | Natural waterfalls, Hiking trails, Photography points, Nature walks, Peaceful surroundings |
| Café Rive Droite | A popular café area with a local vibe, perfect for food lovers and social gatherings. Attracts visitors looking to experience local cuisine and culture. | Cozy dining spots, Culinary events, Live music, Cultural gatherings, Art displays |
Understanding Airbnb License Requirements & STR Laws in Saint-Sauveur (2025)
With 12% of listings showing registration in 2025, understanding potential Airbnb license requirements is crucial in Saint-Sauveur. Always verify the latest short term rental regulations and Airbnb license requirements directly with local government authorities for Saint-Sauveur to ensure full compliance before hosting.
(Source: AirROI data, 2025, based on 12% licensed listings)
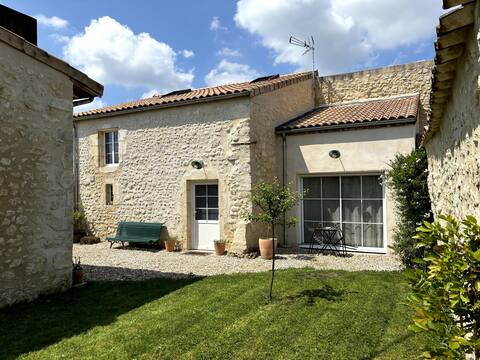
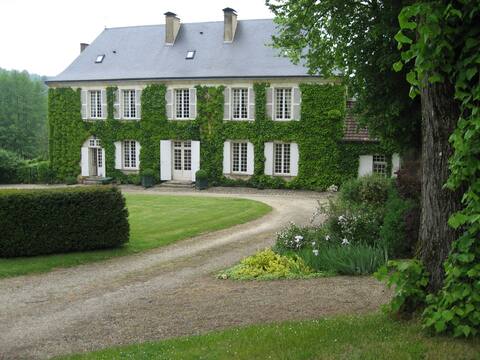
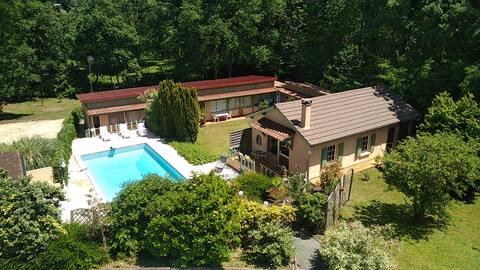
Top Performing Airbnb Properties in Saint-Sauveur (2025)
Benchmark your potential! Explore examples of top-performing Airbnb properties in Saint-Sauveurbased on Trailing Twelve Month (TTM) revenue. Analyze their characteristics, revenue, occupancy rate, and ADR to understand what drives success in this market.
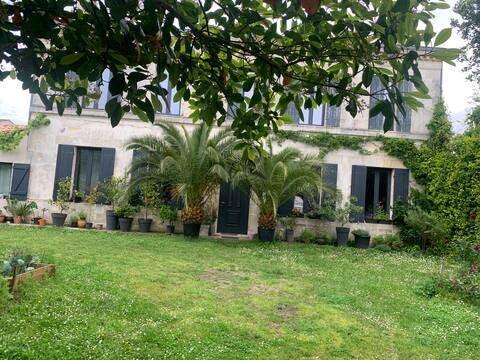
Château La Fon du Berger
Entire Place • 2 bedrooms
Le Bourdil Blanc, near Saint Sauveur on D21
Entire Place • 10 bedrooms
The cooper: 3 Gites for 6 people
Entire Place • 3 bedrooms
Pauillac In a former closed winemaker Coeur Médoc
Private Room • N/A

Family chalet
Entire Place • 3 bedrooms
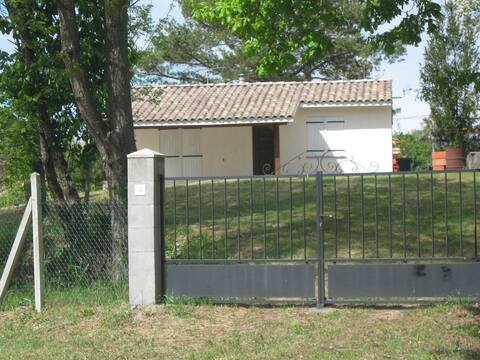
Small house on one level with fenced land
Entire Place • 2 bedrooms
Note: Performance varies based on location, size, amenities, seasonality, and management quality. Data reflects the past 12 months.
Top Performing Airbnb Hosts in Saint-Sauveur (2025)
Learn from the best! This table showcases top-performing Airbnb hosts in Saint-Sauveur based on the number of properties managed and estimated total revenue over the past year. Analyze their scale and performance metrics.
| Host Name | Properties | Grossing Revenue | Stay Reviews | Avg Rating |
|---|---|---|---|---|
| Annie | 4 | $25,876 | 76 | 4.77/5.0 |
| Guillaume | 1 | $23,976 | 57 | 5.00/5.0 |
| Cyrielle | 4 | $16,615 | 136 | 4.88/5.0 |
| Jane | 1 | $14,292 | 5 | 5.00/5.0 |
| Christine | 1 | $10,524 | 50 | 4.98/5.0 |
| Marie Isabelle | 1 | $10,060 | 33 | 4.73/5.0 |
| Marcia | 1 | $9,163 | 33 | 4.76/5.0 |
| Host #194352775 | 1 | $8,107 | 0 | 0.00/5.0 |
| Josette | 1 | $7,423 | 15 | 4.67/5.0 |
| Host #78050519 | 1 | $5,439 | 44 | 4.91/5.0 |
Analyzing the strategies of top hosts, such as their property selection, pricing, and guest communication, can offer valuable lessons for optimizing your own Airbnb operations in Saint-Sauveur.
Dive Deeper: Advanced Saint-Sauveur STR Market Data (2025)
Ready to unlock more insights? AirROI provides access to advanced metrics and comprehensive Airbnb data for Saint-Sauveur. Explore detailed analytics beyond this report to refine your investment strategy, optimize pricing, and maximize your vacation rental profits.
Explore Advanced MetricsSaint-Sauveur Short-Term Rental Market Composition (2025): Property & Room Types
Room Type Distribution
Property Type Distribution
Market Composition Insights for Saint-Sauveur
- The Saint-Sauveur Airbnb market composition is heavily skewed towards Entire Home/Apt listings, which make up 82.4% of the 17 active rentals. This indicates strong guest preference for privacy and space.
- Looking at the property type distribution in Saint-Sauveur, House properties are the most common (70.6%), reflecting the local real estate landscape.
- Houses represent a significant 70.6% portion, catering likely to families or larger groups.
- The presence of 5.9% Hotel/Boutique listings indicates integration with traditional hospitality.
Saint-Sauveur Airbnb Room Capacity Analysis (2025): Bedroom Distribution
Distribution of Listings by Number of Bedrooms
Room Capacity Insights for Saint-Sauveur
- The dominant room capacity in Saint-Sauveur is 1 bedroom listings, making up 52.9% of the market. This suggests a strong demand for properties suitable for couples or solo travelers.
- Together, 1 bedroom and 2 bedrooms properties represent 70.5% of the active Airbnb listings in Saint-Sauveur, indicating a high concentration in these sizes.
- With over half the market (52.9%) consisting of studios or 1-bedroom units, Saint-Sauveur is particularly well-suited for individuals or couples.
Saint-Sauveur Vacation Rental Guest Capacity Trends (2025)
Distribution of Listings by Guest Capacity
Guest Capacity Insights for Saint-Sauveur
- The most common guest capacity trend in Saint-Sauveur vacation rentals is listings accommodating 2 guests (29.4%). This suggests the primary traveler segment is likely couples or solo travelers.
- Properties designed for 2 guests and 4 guests dominate the Saint-Sauveur STR market, accounting for 58.8% of listings.
- 23.5% of properties accommodate 6+ guests, serving the market segment for larger families or group travel in Saint-Sauveur.
- On average, properties in Saint-Sauveur are equipped to host 3.9 guests.
Saint-Sauveur Airbnb Booking Patterns (2025): Available vs. Booked Days
Available Days Distribution
Booked Days Distribution
Booking Pattern Insights for Saint-Sauveur
- The most common availability pattern in Saint-Sauveur falls within the 271-366 days range, representing 70.6% of listings. This suggests many properties have significant open periods on their calendars.
- Approximately 100.0% of listings show high availability (181+ days open annually), indicating potential for increased bookings or specific owner usage patterns.
- For booked days, the 31-90 days range is most frequent in Saint-Sauveur (52.9%), reflecting common guest stay durations or potential owner blocking patterns.
Saint-Sauveur Airbnb Minimum Stay Requirements Analysis
Distribution of Listings by Minimum Night Requirement
1 Night
5 listings
33.3% of total
2 Nights
6 listings
40% of total
3 Nights
1 listings
6.7% of total
4-6 Nights
1 listings
6.7% of total
7-29 Nights
2 listings
13.3% of total
Key Insights
- The most prevalent minimum stay requirement in Saint-Sauveur is 2 Nights, adopted by 40% of listings. This highlights the market's preference for shorter, flexible bookings.
- A strong majority (73.3%) of the Saint-Sauveur Airbnb data shows acceptance of very short stays (1-2 nights), indicating a dynamic, high-turnover market.
Recommendations
- Align with the market by considering a 2 Nights minimum stay, as 40% of Saint-Sauveur hosts use this setting.
- Adjust minimum nights based on seasonality – potentially shorter during low season and longer during peak demand periods in Saint-Sauveur.
Saint-Sauveur Airbnb Cancellation Policy Trends Analysis (2025)
Flexible
3 listings
20% of total
Moderate
2 listings
13.3% of total
Firm
6 listings
40% of total
Strict
4 listings
26.7% of total
Cancellation Policy Insights for Saint-Sauveur
- The prevailing Airbnb cancellation policy trend in Saint-Sauveur is Firm, used by 40% of listings.
- A majority (66.7%) of hosts in Saint-Sauveur utilize Firm or Strict policies, indicating a market where hosts prioritize booking security.
Recommendations for Hosts
- Consider adopting a Firm policy to align with the 40% market standard in Saint-Sauveur.
- Regularly review your cancellation policy against competitors and market demand shifts in Saint-Sauveur.
Saint-Sauveur STR Booking Lead Time Analysis (2025)
Average Booking Lead Time by Month
Booking Lead Time Insights for Saint-Sauveur
- The overall average booking lead time for vacation rentals in Saint-Sauveur is 76 days.
- Guests book furthest in advance for stays during August (average 105 days), likely coinciding with peak travel demand or local events.
- The shortest booking windows occur for stays in February (average 17 days), indicating more last-minute travel plans during this time.
- Seasonally, Summer (88 days avg.) sees the longest lead times, while Winter (36 days avg.) has the shortest, reflecting typical travel planning cycles.
Recommendations for Hosts
- Use the overall average lead time (76 days) as a baseline for your pricing and availability strategy in Saint-Sauveur.
- For August stays, consider implementing length-of-stay discounts or slightly higher rates for bookings made less than 105 days out to capitalize on advance planning.
- Target marketing efforts for the Summer season well in advance (at least 88 days) to capture early planners.
- Monitor your own booking lead times against these Saint-Sauveur averages to identify opportunities for dynamic pricing adjustments.
Popular & Essential Airbnb Amenities in Saint-Sauveur (2025)
Amenity Prevalence
Amenity Insights for Saint-Sauveur
- Essential amenities in Saint-Sauveur that guests expect include: Hot water, Free parking on premises. Lacking these (any) could significantly impact bookings.
- Popular amenities like BBQ grill, Hangers, Hair dryer are common but not universal. Offering these can provide a competitive edge.
Recommendations for Hosts
- Ensure your listing includes all essential amenities for Saint-Sauveur: Hot water, Free parking on premises.
- Consider adding popular differentiators like BBQ grill or Hangers to increase appeal.
- Highlight unique or less common amenities you offer (e.g., hot tub, dedicated workspace, EV charger) in your listing description and photos.
- Regularly check competitor amenities in Saint-Sauveur to stay competitive.
Saint-Sauveur Airbnb Guest Demographics & Profile Analysis (2025)
Guest Profile Summary for Saint-Sauveur
- The typical guest profile for Airbnb in Saint-Sauveur consists of primarily domestic travelers (68%), often arriving from nearby Bordeaux, typically belonging to the Post-2000s (Gen Z/Alpha) group (50%), primarily speaking English or French.
- Domestic travelers account for 68.1% of guests.
- Key international markets include France (68.1%) and Germany (8.3%).
- Top languages spoken are English (37.2%) followed by French (33.3%).
- A significant demographic segment is the Post-2000s (Gen Z/Alpha) group, representing 50% of guests.
Recommendations for Hosts
- Target domestic marketing efforts towards travelers from Bordeaux and Villenave-d'Ornon.
- Tailor amenities and listing descriptions to appeal to the dominant Post-2000s (Gen Z/Alpha) demographic (e.g., highlight fast WiFi, smart home features, local guides).
- Highlight unique local experiences or amenities relevant to the primary guest profile.
- Consider seasonal promotions aligned with peak travel times for key origin markets.
Nearby Short-Term Rental Market Comparison
How does the Saint-Sauveur Airbnb market stack up against its neighbors? Compare key performance metrics like average monthly revenue, ADR, and occupancy rates in surrounding areas to understand the broader regional STR landscape.
| Market | Active Properties | Monthly Revenue | Daily Rate | Avg. Occupancy |
|---|---|---|---|---|
| Saint-Laurent-des-Combes | 11 | $3,526 | $706.18 | 23% |
| Astaffort | 10 | $3,393 | $314.20 | 35% |
| Cénac | 18 | $2,773 | $268.58 | 53% |
| Cérons | 11 | $2,635 | $196.16 | 39% |
| Galgon | 12 | $2,599 | $210.34 | 48% |
| Eynesse | 14 | $2,564 | $282.87 | 36% |
| Bourrou | 10 | $2,475 | $247.57 | 36% |
| Saint-Hippolyte | 10 | $2,443 | $204.98 | 44% |
| Carignan-de-Bordeaux | 30 | $2,418 | $236.77 | 48% |
| Abzac | 12 | $2,415 | $349.03 | 36% |