Saint-Benoît Airbnb Market Analysis 2025: Short Term Rental Data & Vacation Rental Statistics in Nouvelle-Aquitaine, France
Is Airbnb profitable in Saint-Benoît in 2025? Explore comprehensive Airbnb analytics for Saint-Benoît, Nouvelle-Aquitaine, France to uncover income potential. This 2025 STR market report for Saint-Benoît, based on AirROI data from April 2024 to March 2025, reveals key trends in the niche market of 36 active listings.
Whether you're considering an Airbnb investment in Saint-Benoît, optimizing your existing vacation rental, or exploring rental arbitrage opportunities, understanding the Saint-Benoît Airbnb data is crucial. Leveraging the low regulation environment is key to maximizing your short term rental income potential. Let's dive into the specifics.
Key Saint-Benoît Airbnb Performance Metrics Overview
Monthly Airbnb Revenue Variations & Income Potential in Saint-Benoît (2025)
Understanding the monthly revenue variations for Airbnb listings in Saint-Benoît is key to maximizing your short term rental income potential. Seasonality significantly impacts earnings. Our analysis, based on data from the past 12 months, shows that the peak revenue month for STRs in Saint-Benoît is typically June, while February often presents the lowest earnings, highlighting opportunities for strategic pricing adjustments during shoulder and low seasons. Explore the typical Airbnb income in Saint-Benoît across different performance tiers:
- Best-in-class properties (Top 10%) achieve $3,561+ monthly, often utilizing dynamic pricing and superior guest experiences.
- Strong performing properties (Top 25%) earn $1,729 or more, indicating effective management and desirable locations/amenities.
- Typical properties (Median) generate around $951 per month, representing the average market performance.
- Entry-level properties (Bottom 25%) see earnings around $492, often with potential for optimization.
Average Monthly Airbnb Earnings Trend in Saint-Benoît
Saint-Benoît Airbnb Occupancy Rate Trends (2025)
Maximize your bookings by understanding the Saint-Benoît STR occupancy trends. Seasonal demand shifts significantly influence how often properties are booked. Typically, Maysees the highest demand (peak season occupancy), while March experiences the lowest (low season). Effective strategies, like adjusting minimum stays or offering promotions, can boost occupancy during slower periods. Here's how different property tiers perform in Saint-Benoît:
- Best-in-class properties (Top 10%) achieve 85%+ occupancy, indicating high desirability and potentially optimized availability.
- Strong performing properties (Top 25%) maintain 73% or higher occupancy, suggesting good market fit and guest satisfaction.
- Typical properties (Median) have an occupancy rate around 50%.
- Entry-level properties (Bottom 25%) average 27% occupancy, potentially facing higher vacancy.
Average Monthly Occupancy Rate Trend in Saint-Benoît
Average Daily Rate (ADR) Airbnb Trends in Saint-Benoît (2025)
Effective short term rental pricing strategy in Saint-Benoît involves understanding monthly ADR fluctuations. The Average Daily Rate (ADR) for Airbnb in Saint-Benoît typically peaks in July and dips lowest during March. Leveraging Airbnb dynamic pricing tools or strategies based on this seasonality can significantly boost revenue. Here's a look at the typical nightly rates achieved:
- Best-in-class properties (Top 10%) command rates of $197+ per night, often due to premium features or locations.
- Strong performing properties (Top 25%) achieve nightly rates of $112 or more.
- Typical properties (Median) charge around $57 per night.
- Entry-level properties (Bottom 25%) earn around $35 per night.
Average Daily Rate (ADR) Trend by Month in Saint-Benoît
Get Live Saint-Benoît Market Intelligence 👇

Explore Real-time Analytics
Airbnb Seasonality Analysis & Trends in Saint-Benoît (2025)
Peak Season (June, May, July)
- Revenue averages $2,347 per month
- Occupancy rates average 55.2%
- Daily rates average $95
Shoulder Season
- Revenue averages $1,306 per month
- Occupancy maintains around 51.1%
- Daily rates hold near $90
Low Season (February, March, November)
- Revenue drops to average $723 per month
- Occupancy decreases to average 42.8%
- Daily rates adjust to average $83
Seasonality Insights for Saint-Benoît
- The Airbnb seasonality in Saint-Benoît shows highly seasonal trends requiring careful strategy. While the sections above show seasonal averages, it's also insightful to look at the extremes:
- During the high season, the absolute peak month showcases Saint-Benoît's highest earning potential, with monthly revenues capable of climbing to $2,509, occupancy reaching a high of 60.1%, and ADRs peaking at $95.
- Conversely, the slowest single month of the year, typically falling within the low season, marks the market's lowest point. In this month, revenue might dip to $599, occupancy could drop to 40.5%, and ADRs may adjust down to $79.
- Understanding both the seasonal averages and these monthly peaks and troughs in revenue, occupancy, and ADR is crucial for maximizing your Airbnb profit potential in Saint-Benoît.
Seasonal Strategies for Maximizing Profit
- Peak Season: Maximize revenue through premium pricing and potentially longer minimum stays. Ensure high availability.
- Low Season: Offer competitive pricing, special promotions (e.g., extended stay discounts), and flexible cancellation policies. Target off-season travelers like remote workers or budget-conscious guests.
- Shoulder Seasons: Implement dynamic pricing that balances peak and low rates. Target weekend travelers or specific events. Offer slightly more flexible terms than peak season.
- Regularly analyze your own performance against these Saint-Benoît seasonality benchmarks and adjust your pricing and availability strategy accordingly.
Best Areas for Airbnb Investment in Saint-Benoît (2025)
Exploring the top neighborhoods for short-term rentals in Saint-Benoît? This section highlights key areas, outlining why they are attractive for hosts and guests, along with notable local attractions. Consider these locations based on your target guest profile and investment strategy.
| Neighborhood / Area | Why Host Here? (Target Guests & Appeal) | Key Attractions & Landmarks |
|---|---|---|
| La Réserve Naturelle | A stunning nature reserve known for its diverse flora and fauna, offering a peaceful retreat for nature lovers and an eco-friendly experience. | Château de la Roche Courbon, Botanical garden, Nature trails, Bird watching, St. Benoît Abbey |
| Saint-Benoît town center | The vibrant heart of Saint-Benoît, featuring local shops, restaurants, and cultural sites. Ideal for travelers wanting to experience local life. | Place de la République, Local markets, Saint-Benoît Church, Café culture, Community events |
| Futuroscope | Nearby theme park that attracts visitors from all over for its futuristic attractions, making it a hotspot for families and tourists. | Futuroscope Park, Attraction rides, Themed dining, Live shows, Virtual reality experiences |
| The Garden District | A charming residential area with beautiful gardens and parks, perfect for those looking for relaxation and picturesque surroundings. | Parc de la Mairie, Botanical gardens, Walking trails, Picnic areas |
| La Vallée des Singes | A unique wildlife park showcasing primates and exotic animals, great for families and animal lovers. | Animal encounters, Educational programs, Themed pathways, Play areas for children |
| Château de Maulévrier | Historic castle known for its exquisite gardens and architecture, attracting history enthusiasts and garden lovers alike. | Castle tours, Flower gardens, Photography opportunities, Cultural events |
| Cycling Routes | Saint-Benoît and its surroundings offer beautiful cycling routes, attracting outdoor enthusiasts and adventure seekers. | Bicycle rentals, Scenic cycling trails, Nature sightseeing, Cycling events |
| Local Vineyards | Explore the nearby vineyards and wine tasting experiences, appealing to wine lovers and culinary tourists. | Wine tasting tours, Vineyard walks, Local wine shops, Culinary events |
Understanding Airbnb License Requirements & STR Laws in Saint-Benoît (2025)
While Saint-Benoît, Nouvelle-Aquitaine, France currently shows low STR regulations, specific Airbnb license requirements might still exist or change. Always verify the latest short term rental regulations and Airbnb license requirements directly with local government authorities for Saint-Benoît to ensure full compliance before hosting.
(Source: AirROI data, 2025, finding no licensed listings among those analyzed)
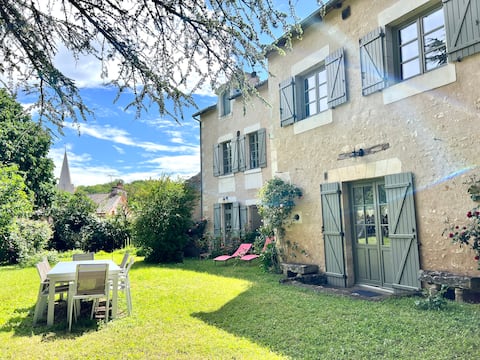
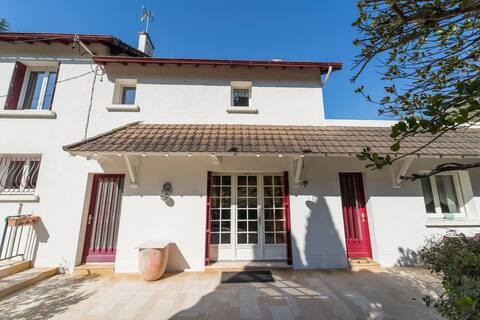
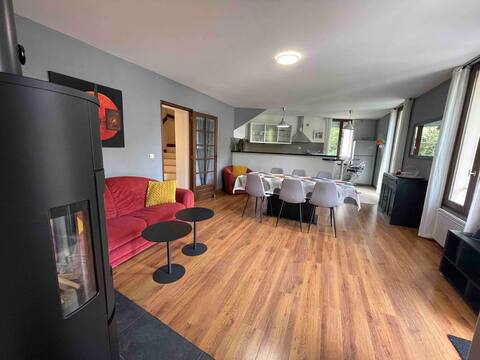
Top Performing Airbnb Properties in Saint-Benoît (2025)
Benchmark your potential! Explore examples of top-performing Airbnb properties in Saint-Benoîtbased on Trailing Twelve Month (TTM) revenue. Analyze their characteristics, revenue, occupancy rate, and ADR to understand what drives success in this market.
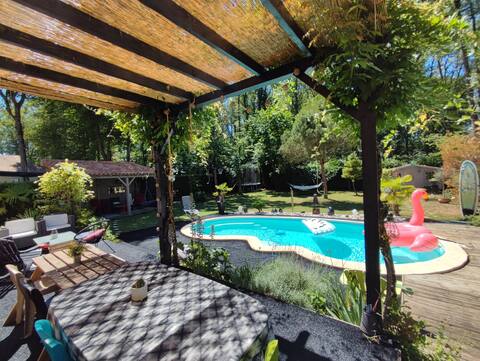
At Domaine Valigny, Heated pool + Fiber WiFi
Entire Place • 4 bedrooms
Les Poissons Rouges - house in the countryside
Entire Place • 4 bedrooms
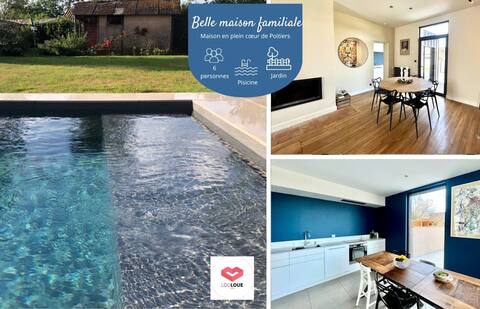
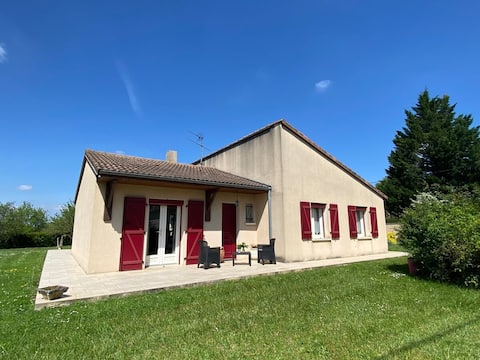
Beautiful family home
Entire Place • 4 bedrooms
Le Gite de Passelourdain
Entire Place • 4 bedrooms
Wooden villa with pool
Entire Place • 4 bedrooms
La Braudière, cozy and warm house 5 min CHU
Entire Place • 3 bedrooms
Note: Performance varies based on location, size, amenities, seasonality, and management quality. Data reflects the past 12 months.
Top Performing Airbnb Hosts in Saint-Benoît (2025)
Learn from the best! This table showcases top-performing Airbnb hosts in Saint-Benoît based on the number of properties managed and estimated total revenue over the past year. Analyze their scale and performance metrics.
| Host Name | Properties | Grossing Revenue | Stay Reviews | Avg Rating |
|---|---|---|---|---|
| Monsieur Conciergerie | 1 | $49,585 | 31 | 4.65/5.0 |
| Frederique | 1 | $42,905 | 22 | 4.55/5.0 |
| Fix | 1 | $40,984 | 3 | 5.00/5.0 |
| Sandra | 1 | $30,628 | 45 | 4.87/5.0 |
| Alexis | 1 | $28,371 | 7 | 4.43/5.0 |
| Faty | 3 | $25,481 | 34 | 4.43/5.0 |
| Laura | 1 | $20,373 | 46 | 4.70/5.0 |
| Cedric | 1 | $20,246 | 15 | 4.07/5.0 |
| Isavic | 1 | $17,967 | 17 | 4.71/5.0 |
| Jouve Laure | 1 | $17,157 | 3 | 5.00/5.0 |
Analyzing the strategies of top hosts, such as their property selection, pricing, and guest communication, can offer valuable lessons for optimizing your own Airbnb operations in Saint-Benoît.
Dive Deeper: Advanced Saint-Benoît STR Market Data (2025)
Ready to unlock more insights? AirROI provides access to advanced metrics and comprehensive Airbnb data for Saint-Benoît. Explore detailed analytics beyond this report to refine your investment strategy, optimize pricing, and maximize your vacation rental profits.
Explore Advanced MetricsSaint-Benoît Short-Term Rental Market Composition (2025): Property & Room Types
Room Type Distribution
Property Type Distribution
Market Composition Insights for Saint-Benoît
- The Saint-Benoît Airbnb market composition is heavily skewed towards Entire Home/Apt listings, which make up 75% of the 36 active rentals. This indicates strong guest preference for privacy and space.
- Looking at the property type distribution in Saint-Benoît, House properties are the most common (72.2%), reflecting the local real estate landscape.
- Houses represent a significant 72.2% portion, catering likely to families or larger groups.
- Smaller segments like hotel/boutique (combined 2.8%) offer potential for unique stay experiences.
Saint-Benoît Airbnb Room Capacity Analysis (2025): Bedroom Distribution
Distribution of Listings by Number of Bedrooms
Room Capacity Insights for Saint-Benoît
- The dominant room capacity in Saint-Benoît is 1 bedroom listings, making up 22.2% of the market. This suggests a strong demand for properties suitable for couples or solo travelers.
- Together, 1 bedroom and 2 bedrooms properties represent 44.4% of the active Airbnb listings in Saint-Benoît, indicating a high concentration in these sizes.
- A significant 30.5% of listings offer 3+ bedrooms, catering to larger groups and families seeking more space in Saint-Benoît.
Saint-Benoît Vacation Rental Guest Capacity Trends (2025)
Distribution of Listings by Guest Capacity
Guest Capacity Insights for Saint-Benoît
- The most common guest capacity trend in Saint-Benoît vacation rentals is listings accommodating 4 guests (27.8%). This suggests the primary traveler segment is likely small families or groups.
- Properties designed for 4 guests and 2 guests dominate the Saint-Benoît STR market, accounting for 44.5% of listings.
- 25.0% of properties accommodate 6+ guests, serving the market segment for larger families or group travel in Saint-Benoît.
- On average, properties in Saint-Benoît are equipped to host 3.4 guests.
Saint-Benoît Airbnb Booking Patterns (2025): Available vs. Booked Days
Available Days Distribution
Booked Days Distribution
Booking Pattern Insights for Saint-Benoît
- The most common availability pattern in Saint-Benoît falls within the 271-366 days range, representing 33.3% of listings. This suggests many properties have significant open periods on their calendars.
- Approximately 63.9% of listings show high availability (181+ days open annually), indicating potential for increased bookings or specific owner usage patterns.
- For booked days, the 91-180 days range is most frequent in Saint-Benoît (33.3%), reflecting common guest stay durations or potential owner blocking patterns.
- A notable 38.9% of properties secure long booking periods (181+ days booked per year), highlighting successful long-term rental strategies or significant owner usage.
Saint-Benoît Airbnb Minimum Stay Requirements Analysis
Distribution of Listings by Minimum Night Requirement
1 Night
13 listings
37.1% of total
2 Nights
15 listings
42.9% of total
3 Nights
2 listings
5.7% of total
4-6 Nights
3 listings
8.6% of total
30+ Nights
2 listings
5.7% of total
Key Insights
- The most prevalent minimum stay requirement in Saint-Benoît is 2 Nights, adopted by 42.9% of listings. This highlights the market's preference for shorter, flexible bookings.
- A strong majority (80.0%) of the Saint-Benoît Airbnb data shows acceptance of very short stays (1-2 nights), indicating a dynamic, high-turnover market.
Recommendations
- Align with the market by considering a 2 Nights minimum stay, as 42.9% of Saint-Benoît hosts use this setting.
- Explore offering discounts for stays of 30+ nights to attract the 5.7% of the market seeking extended stays.
- Adjust minimum nights based on seasonality – potentially shorter during low season and longer during peak demand periods in Saint-Benoît.
Saint-Benoît Airbnb Cancellation Policy Trends Analysis (2025)
Flexible
15 listings
42.9% of total
Moderate
10 listings
28.6% of total
Firm
6 listings
17.1% of total
Strict
4 listings
11.4% of total
Cancellation Policy Insights for Saint-Benoît
- The prevailing Airbnb cancellation policy trend in Saint-Benoît is Flexible, used by 42.9% of listings.
- The market strongly favors guest-friendly terms, with 71.5% of listings offering Flexible or Moderate policies. This suggests guests in Saint-Benoît may expect booking flexibility.
Recommendations for Hosts
- Consider adopting a Flexible policy to align with the 42.9% market standard in Saint-Benoît.
- Using a Strict policy might deter some guests, as only 11.4% of listings use it. Evaluate if potential revenue protection outweighs possible lower booking rates.
- Regularly review your cancellation policy against competitors and market demand shifts in Saint-Benoît.
Saint-Benoît STR Booking Lead Time Analysis (2025)
Average Booking Lead Time by Month
Booking Lead Time Insights for Saint-Benoît
- The overall average booking lead time for vacation rentals in Saint-Benoît is 39 days.
- Guests book furthest in advance for stays during June (average 79 days), likely coinciding with peak travel demand or local events.
- The shortest booking windows occur for stays in October (average 22 days), indicating more last-minute travel plans during this time.
- Seasonally, Summer (61 days avg.) sees the longest lead times, while Fall (28 days avg.) has the shortest, reflecting typical travel planning cycles.
Recommendations for Hosts
- Use the overall average lead time (39 days) as a baseline for your pricing and availability strategy in Saint-Benoît.
- For June stays, consider implementing length-of-stay discounts or slightly higher rates for bookings made less than 79 days out to capitalize on advance planning.
- Target marketing efforts for the Summer season well in advance (at least 61 days) to capture early planners.
- Monitor your own booking lead times against these Saint-Benoît averages to identify opportunities for dynamic pricing adjustments.
Popular & Essential Airbnb Amenities in Saint-Benoît (2025)
Amenity Prevalence
Amenity Insights for Saint-Benoît
- Popular amenities like Hot water, Smoke alarm, Heating are common but not universal. Offering these can provide a competitive edge.
Recommendations for Hosts
- Consider adding popular differentiators like Hot water or Smoke alarm to increase appeal.
- Highlight unique or less common amenities you offer (e.g., hot tub, dedicated workspace, EV charger) in your listing description and photos.
- Regularly check competitor amenities in Saint-Benoît to stay competitive.
Saint-Benoît Airbnb Guest Demographics & Profile Analysis (2025)
Guest Profile Summary for Saint-Benoît
- The typical guest profile for Airbnb in Saint-Benoît consists of primarily domestic travelers (94%), often arriving from nearby Paris, typically belonging to the Post-2000s (Gen Z/Alpha) group (50%), primarily speaking French or English.
- Domestic travelers account for 93.7% of guests.
- Key international markets include France (93.7%) and United Kingdom (1.6%).
- Top languages spoken are French (53.6%) followed by English (29.2%).
- A significant demographic segment is the Post-2000s (Gen Z/Alpha) group, representing 50% of guests.
Recommendations for Hosts
- Target domestic marketing efforts towards travelers from Paris and Bordeaux.
- Tailor amenities and listing descriptions to appeal to the dominant Post-2000s (Gen Z/Alpha) demographic (e.g., highlight fast WiFi, smart home features, local guides).
- Highlight unique local experiences or amenities relevant to the primary guest profile.
- Consider seasonal promotions aligned with peak travel times for key origin markets.
Nearby Short-Term Rental Market Comparison
How does the Saint-Benoît Airbnb market stack up against its neighbors? Compare key performance metrics like average monthly revenue, ADR, and occupancy rates in surrounding areas to understand the broader regional STR landscape.
| Market | Active Properties | Monthly Revenue | Daily Rate | Avg. Occupancy |
|---|---|---|---|---|
| Millançay | 11 | $3,476 | $370.42 | 39% |
| Coteaux-sur-Loire | 19 | $3,328 | $270.00 | 41% |
| Langon-sur-Cher | 12 | $3,127 | $400.27 | 35% |
| Villiers-sur-Loir | 10 | $2,967 | $216.51 | 41% |
| Artannes-sur-Indre | 21 | $2,949 | $275.91 | 41% |
| Vallon-sur-Gée | 11 | $2,913 | $379.01 | 30% |
| Bourneau | 11 | $2,747 | $442.07 | 35% |
| Nuaillé-d'Aunis | 10 | $2,741 | $373.83 | 37% |
| Cellettes | 41 | $2,711 | $275.68 | 40% |
| Ambillou | 18 | $2,701 | $370.97 | 28% |