Saint-Augustin Airbnb Market Analysis 2025: Short Term Rental Data & Vacation Rental Statistics in Nouvelle-Aquitaine, France
Is Airbnb profitable in Saint-Augustin in 2025? Explore comprehensive Airbnb analytics for Saint-Augustin, Nouvelle-Aquitaine, France to uncover income potential. This 2025 STR market report for Saint-Augustin, based on AirROI data from April 2024 to March 2025, reveals key trends in the niche market of 66 active listings.
Whether you're considering an Airbnb investment in Saint-Augustin, optimizing your existing vacation rental, or exploring rental arbitrage opportunities, understanding the Saint-Augustin Airbnb data is crucial. Leveraging the low regulation environment is key to maximizing your short term rental income potential. Let's dive into the specifics.
Key Saint-Augustin Airbnb Performance Metrics Overview
Monthly Airbnb Revenue Variations & Income Potential in Saint-Augustin (2025)
Understanding the monthly revenue variations for Airbnb listings in Saint-Augustin is key to maximizing your short term rental income potential. Seasonality significantly impacts earnings. Our analysis, based on data from the past 12 months, shows that the peak revenue month for STRs in Saint-Augustin is typically August, while January often presents the lowest earnings, highlighting opportunities for strategic pricing adjustments during shoulder and low seasons. Explore the typical Airbnb income in Saint-Augustin across different performance tiers:
- Best-in-class properties (Top 10%) achieve $3,391+ monthly, often utilizing dynamic pricing and superior guest experiences.
- Strong performing properties (Top 25%) earn $2,109 or more, indicating effective management and desirable locations/amenities.
- Typical properties (Median) generate around $1,276 per month, representing the average market performance.
- Entry-level properties (Bottom 25%) see earnings around $633, often with potential for optimization.
Average Monthly Airbnb Earnings Trend in Saint-Augustin
Saint-Augustin Airbnb Occupancy Rate Trends (2025)
Maximize your bookings by understanding the Saint-Augustin STR occupancy trends. Seasonal demand shifts significantly influence how often properties are booked. Typically, Augustsees the highest demand (peak season occupancy), while January experiences the lowest (low season). Effective strategies, like adjusting minimum stays or offering promotions, can boost occupancy during slower periods. Here's how different property tiers perform in Saint-Augustin:
- Best-in-class properties (Top 10%) achieve 59%+ occupancy, indicating high desirability and potentially optimized availability.
- Strong performing properties (Top 25%) maintain 41% or higher occupancy, suggesting good market fit and guest satisfaction.
- Typical properties (Median) have an occupancy rate around 29%.
- Entry-level properties (Bottom 25%) average 14% occupancy, potentially facing higher vacancy.
Average Monthly Occupancy Rate Trend in Saint-Augustin
Average Daily Rate (ADR) Airbnb Trends in Saint-Augustin (2025)
Effective short term rental pricing strategy in Saint-Augustin involves understanding monthly ADR fluctuations. The Average Daily Rate (ADR) for Airbnb in Saint-Augustin typically peaks in July and dips lowest during March. Leveraging Airbnb dynamic pricing tools or strategies based on this seasonality can significantly boost revenue. Here's a look at the typical nightly rates achieved:
- Best-in-class properties (Top 10%) command rates of $285+ per night, often due to premium features or locations.
- Strong performing properties (Top 25%) achieve nightly rates of $179 or more.
- Typical properties (Median) charge around $126 per night.
- Entry-level properties (Bottom 25%) earn around $93 per night.
Average Daily Rate (ADR) Trend by Month in Saint-Augustin
Get Live Saint-Augustin Market Intelligence 👇

Explore Real-time Analytics
Airbnb Seasonality Analysis & Trends in Saint-Augustin (2025)
Peak Season (August, July, April)
- Revenue averages $3,051 per month
- Occupancy rates average 47.8%
- Daily rates average $164
Shoulder Season
- Revenue averages $1,422 per month
- Occupancy maintains around 26.5%
- Daily rates hold near $156
Low Season (January, February, March)
- Revenue drops to average $723 per month
- Occupancy decreases to average 20.4%
- Daily rates adjust to average $151
Seasonality Insights for Saint-Augustin
- The Airbnb seasonality in Saint-Augustin shows highly seasonal trends requiring careful strategy. While the sections above show seasonal averages, it's also insightful to look at the extremes:
- During the high season, the absolute peak month showcases Saint-Augustin's highest earning potential, with monthly revenues capable of climbing to $3,700, occupancy reaching a high of 68.2%, and ADRs peaking at $171.
- Conversely, the slowest single month of the year, typically falling within the low season, marks the market's lowest point. In this month, revenue might dip to $641, occupancy could drop to 15.6%, and ADRs may adjust down to $148.
- Understanding both the seasonal averages and these monthly peaks and troughs in revenue, occupancy, and ADR is crucial for maximizing your Airbnb profit potential in Saint-Augustin.
Seasonal Strategies for Maximizing Profit
- Peak Season: Maximize revenue through premium pricing and potentially longer minimum stays. Ensure high availability.
- Low Season: Offer competitive pricing, special promotions (e.g., extended stay discounts), and flexible cancellation policies. Target off-season travelers like remote workers or budget-conscious guests.
- Shoulder Seasons: Implement dynamic pricing that balances peak and low rates. Target weekend travelers or specific events. Offer slightly more flexible terms than peak season.
- Regularly analyze your own performance against these Saint-Augustin seasonality benchmarks and adjust your pricing and availability strategy accordingly.
Best Areas for Airbnb Investment in Saint-Augustin (2025)
Exploring the top neighborhoods for short-term rentals in Saint-Augustin? This section highlights key areas, outlining why they are attractive for hosts and guests, along with notable local attractions. Consider these locations based on your target guest profile and investment strategy.
| Neighborhood / Area | Why Host Here? (Target Guests & Appeal) | Key Attractions & Landmarks |
|---|---|---|
| La Roche Courbon | A stunning historic château surrounded by beautiful gardens, attracting tourists interested in history and nature. The picturesque setting makes it ideal for unique Airbnb listings. | Château de La Roche Courbon, Botanical Gardens, Local vineyards, River Charente, Historical tours |
| Ile d'Oléron | Known for its beautiful beaches, this island is a popular summer destination for families and those seeking relaxation. The local culture and seafood draw many visitors year-round. | Phare de Chassiron, La Grande Plage, Oléron Aquarium, Local seafood markets, Cycling trails |
| Royan | A vibrant coastal town known for its beautiful beaches and warm climate. Perfect for beach-goers and families looking for a summer getaway with various attractions nearby. | Grande Conche Beach, Royan Congress Center, Phare de Cordouan, Local markets, Water sports activities |
| La Palmyre | A family-friendly destination famous for its zoo and beautiful beaches. Appeals to families and young travelers looking for fun and leisure activities. | La Palmyre Zoo, La Palmyre Beach, Mini Golf, Water park, Cycling paths |
| Saintes | A historic town with Roman ruins and a charming old town. Attracts history enthusiasts and tourists interested in French heritage. | Arch of Germanicus, Saintes Roman Amphitheatre, Saint Peter's Cathedral, Museums, Local festivals |
| Cognac | Renowned for its production of cognac, this town attracts tourists interested in distilleries and wine tours. A unique experience for culinary tourists. | Cognac distilleries, Cognac Museum, River Charente, Local vineyards, Gastronomic tours |
| Royan-Plage | This area combines beach accessibility with shops and restaurants, making it great for both relaxation and social activities. Perfect for summer vacation rentals. | Royan Beach, Shopping promenade, Seaside restaurants, Boardwalk, Water sports |
| Marais Poitevin | Known as the Green Venice, this area offers beautiful canals and lush landscapes ideal for eco-tourists and those interested in outdoor activities. | Boat tours, Bicycle rental, Fishing spots, Nature trails, Local wildlife |
Understanding Airbnb License Requirements & STR Laws in Saint-Augustin (2025)
While Saint-Augustin, Nouvelle-Aquitaine, France currently shows low STR regulations, specific Airbnb license requirements might still exist or change. Always verify the latest short term rental regulations and Airbnb license requirements directly with local government authorities for Saint-Augustin to ensure full compliance before hosting.
(Source: AirROI data, 2025, based on 6% licensed listings)
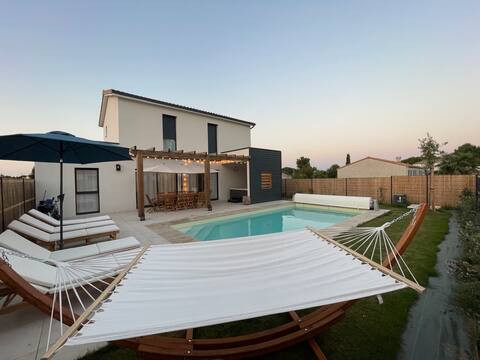
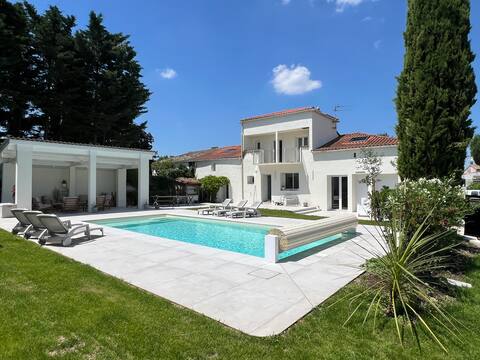
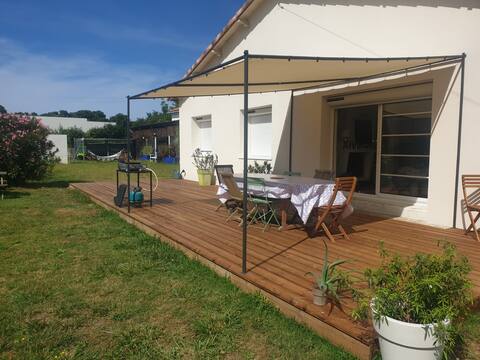
Top Performing Airbnb Properties in Saint-Augustin (2025)
Benchmark your potential! Explore examples of top-performing Airbnb properties in Saint-Augustinbased on Trailing Twelve Month (TTM) revenue. Analyze their characteristics, revenue, occupancy rate, and ADR to understand what drives success in this market.
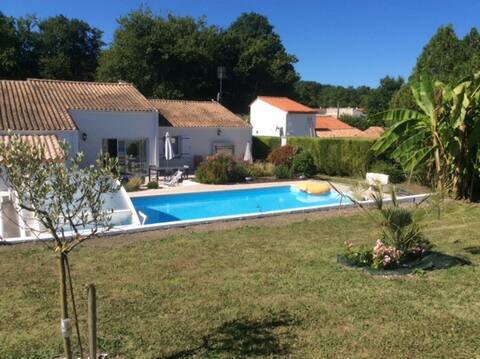
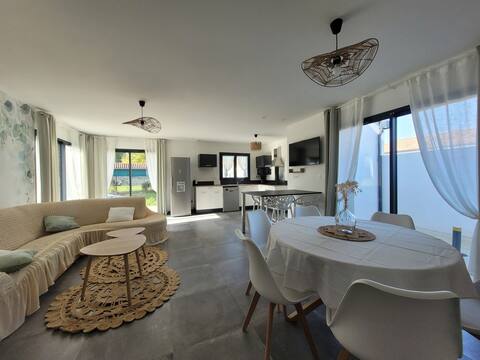
Beautiful Villa with a Pool
Entire Place • 5 bedrooms
4 chbres villa with pool (16)
Entire Place • 4 bedrooms

Villa with pool for 11 people, 4km from the beaches
Entire Place • 5 bedrooms
Maison familiale-amis piscine proche mer
Entire Place • 5 bedrooms
New pool house, 4 hp. 6 pers. enclosed garden
Entire Place • 4 bedrooms
House classified 3* close to the beaches
Entire Place • 3 bedrooms
Note: Performance varies based on location, size, amenities, seasonality, and management quality. Data reflects the past 12 months.
Top Performing Airbnb Hosts in Saint-Augustin (2025)
Learn from the best! This table showcases top-performing Airbnb hosts in Saint-Augustin based on the number of properties managed and estimated total revenue over the past year. Analyze their scale and performance metrics.
| Host Name | Properties | Grossing Revenue | Stay Reviews | Avg Rating |
|---|---|---|---|---|
| Nick | 12 | $142,733 | 122 | 3.49/5.0 |
| Office Foncier De Saintonge | 4 | $105,583 | 23 | 3.66/5.0 |
| Sébastien | 9 | $61,296 | 27 | 2.47/5.0 |
| Roselyne | 1 | $28,192 | 52 | 4.90/5.0 |
| Host #86011538 | 1 | $26,750 | 0 | 0.00/5.0 |
| Alice | 1 | $25,526 | 5 | 5.00/5.0 |
| Sylvie | 1 | $25,269 | 48 | 4.88/5.0 |
| Thierry | 1 | $24,409 | 4 | 4.50/5.0 |
| Joel | 1 | $23,514 | 18 | 4.89/5.0 |
| Karl | 1 | $23,303 | 33 | 4.64/5.0 |
Analyzing the strategies of top hosts, such as their property selection, pricing, and guest communication, can offer valuable lessons for optimizing your own Airbnb operations in Saint-Augustin.
Dive Deeper: Advanced Saint-Augustin STR Market Data (2025)
Ready to unlock more insights? AirROI provides access to advanced metrics and comprehensive Airbnb data for Saint-Augustin. Explore detailed analytics beyond this report to refine your investment strategy, optimize pricing, and maximize your vacation rental profits.
Explore Advanced MetricsSaint-Augustin Short-Term Rental Market Composition (2025): Property & Room Types
Room Type Distribution
Property Type Distribution
Market Composition Insights for Saint-Augustin
- The Saint-Augustin Airbnb market composition is heavily skewed towards Entire Home/Apt listings, which make up 95.5% of the 66 active rentals. This indicates strong guest preference for privacy and space.
- Looking at the property type distribution in Saint-Augustin, House properties are the most common (74.2%), reflecting the local real estate landscape.
- Houses represent a significant 74.2% portion, catering likely to families or larger groups.
- Smaller segments like hotel/boutique (combined 1.5%) offer potential for unique stay experiences.
Saint-Augustin Airbnb Room Capacity Analysis (2025): Bedroom Distribution
Distribution of Listings by Number of Bedrooms
Room Capacity Insights for Saint-Augustin
- The dominant room capacity in Saint-Augustin is 2 bedrooms listings, making up 36.4% of the market. This suggests a strong demand for properties suitable for couples or solo travelers.
- Together, 2 bedrooms and 4 bedrooms properties represent 63.7% of the active Airbnb listings in Saint-Augustin, indicating a high concentration in these sizes.
- A significant 56.1% of listings offer 3+ bedrooms, catering to larger groups and families seeking more space in Saint-Augustin.
Saint-Augustin Vacation Rental Guest Capacity Trends (2025)
Distribution of Listings by Guest Capacity
Guest Capacity Insights for Saint-Augustin
- The most common guest capacity trend in Saint-Augustin vacation rentals is listings accommodating 8+ guests (31.8%). This suggests the primary traveler segment is likely larger groups.
- Properties designed for 8+ guests and 4 guests dominate the Saint-Augustin STR market, accounting for 57.6% of listings.
- 63.6% of properties accommodate 6+ guests, serving the market segment for larger families or group travel in Saint-Augustin.
- On average, properties in Saint-Augustin are equipped to host 5.9 guests.
Saint-Augustin Airbnb Booking Patterns (2025): Available vs. Booked Days
Available Days Distribution
Booked Days Distribution
Booking Pattern Insights for Saint-Augustin
- The most common availability pattern in Saint-Augustin falls within the 271-366 days range, representing 68.2% of listings. This suggests many properties have significant open periods on their calendars.
- Approximately 97.0% of listings show high availability (181+ days open annually), indicating potential for increased bookings or specific owner usage patterns.
- For booked days, the 31-90 days range is most frequent in Saint-Augustin (42.4%), reflecting common guest stay durations or potential owner blocking patterns.
- A notable 3.0% of properties secure long booking periods (181+ days booked per year), highlighting successful long-term rental strategies or significant owner usage.
Saint-Augustin Airbnb Minimum Stay Requirements Analysis
Distribution of Listings by Minimum Night Requirement
1 Night
7 listings
12.5% of total
2 Nights
24 listings
42.9% of total
3 Nights
9 listings
16.1% of total
4-6 Nights
5 listings
8.9% of total
7-29 Nights
11 listings
19.6% of total
Key Insights
- The most prevalent minimum stay requirement in Saint-Augustin is 2 Nights, adopted by 42.9% of listings. This highlights the market's preference for shorter, flexible bookings.
Recommendations
- Align with the market by considering a 2 Nights minimum stay, as 42.9% of Saint-Augustin hosts use this setting.
- If feasible, allowing 1-night stays, especially midweek or during low season, could capture last-minute bookings, as only 12.5% currently do.
- A 2-night minimum appears standard (42.9%). Consider this for weekends or peak periods.
- Adjust minimum nights based on seasonality – potentially shorter during low season and longer during peak demand periods in Saint-Augustin.
Saint-Augustin Airbnb Cancellation Policy Trends Analysis (2025)
Flexible
10 listings
21.7% of total
Moderate
9 listings
19.6% of total
Firm
11 listings
23.9% of total
Strict
16 listings
34.8% of total
Cancellation Policy Insights for Saint-Augustin
- The prevailing Airbnb cancellation policy trend in Saint-Augustin is Strict, used by 34.8% of listings.
- A majority (58.7%) of hosts in Saint-Augustin utilize Firm or Strict policies, indicating a market where hosts prioritize booking security.
Recommendations for Hosts
- Consider adopting a Strict policy to align with the 34.8% market standard in Saint-Augustin.
- With 34.8% using Strict terms, this is a viable option in Saint-Augustin, particularly for high-value properties or during peak demand periods.
- Regularly review your cancellation policy against competitors and market demand shifts in Saint-Augustin.
Saint-Augustin STR Booking Lead Time Analysis (2025)
Average Booking Lead Time by Month
Booking Lead Time Insights for Saint-Augustin
- The overall average booking lead time for vacation rentals in Saint-Augustin is 66 days.
- Guests book furthest in advance for stays during July (average 106 days), likely coinciding with peak travel demand or local events.
- The shortest booking windows occur for stays in November (average 18 days), indicating more last-minute travel plans during this time.
- Seasonally, Summer (92 days avg.) sees the longest lead times, while Winter (38 days avg.) has the shortest, reflecting typical travel planning cycles.
Recommendations for Hosts
- Use the overall average lead time (66 days) as a baseline for your pricing and availability strategy in Saint-Augustin.
- For July stays, consider implementing length-of-stay discounts or slightly higher rates for bookings made less than 106 days out to capitalize on advance planning.
- Target marketing efforts for the Summer season well in advance (at least 92 days) to capture early planners.
- Monitor your own booking lead times against these Saint-Augustin averages to identify opportunities for dynamic pricing adjustments.
Popular & Essential Airbnb Amenities in Saint-Augustin (2025)
Amenity Prevalence
Amenity Insights for Saint-Augustin
- Essential amenities in Saint-Augustin that guests expect include: Kitchen, Free parking on premises, Hot water. Lacking these (any) could significantly impact bookings.
- Popular amenities like Heating, Refrigerator, TV are common but not universal. Offering these can provide a competitive edge.
Recommendations for Hosts
- Ensure your listing includes all essential amenities for Saint-Augustin: Kitchen, Free parking on premises, Hot water.
- Prioritize adding missing essentials: Kitchen, Free parking on premises, Hot water.
- Consider adding popular differentiators like Heating or Refrigerator to increase appeal.
- Highlight unique or less common amenities you offer (e.g., hot tub, dedicated workspace, EV charger) in your listing description and photos.
- Regularly check competitor amenities in Saint-Augustin to stay competitive.
Saint-Augustin Airbnb Guest Demographics & Profile Analysis (2025)
Guest Profile Summary for Saint-Augustin
- The typical guest profile for Airbnb in Saint-Augustin consists of primarily domestic travelers (93%), often arriving from nearby Nantes, typically belonging to the Post-2000s (Gen Z/Alpha) group (50%), primarily speaking French or English.
- Domestic travelers account for 93.0% of guests.
- Key international markets include France (93%) and United Kingdom (2.7%).
- Top languages spoken are French (49.1%) followed by English (34.5%).
- A significant demographic segment is the Post-2000s (Gen Z/Alpha) group, representing 50% of guests.
Recommendations for Hosts
- Target domestic marketing efforts towards travelers from Nantes and Paris.
- Tailor amenities and listing descriptions to appeal to the dominant Post-2000s (Gen Z/Alpha) demographic (e.g., highlight fast WiFi, smart home features, local guides).
- Highlight unique local experiences or amenities relevant to the primary guest profile.
- Consider seasonal promotions aligned with peak travel times for key origin markets.
Nearby Short-Term Rental Market Comparison
How does the Saint-Augustin Airbnb market stack up against its neighbors? Compare key performance metrics like average monthly revenue, ADR, and occupancy rates in surrounding areas to understand the broader regional STR landscape.
| Market | Active Properties | Monthly Revenue | Daily Rate | Avg. Occupancy |
|---|---|---|---|---|
| Saint-Laurent-des-Combes | 11 | $3,526 | $706.18 | 23% |
| Cénac | 18 | $2,773 | $268.58 | 53% |
| Bourneau | 11 | $2,747 | $442.07 | 35% |
| Nuaillé-d'Aunis | 10 | $2,741 | $373.83 | 37% |
| Cérons | 11 | $2,635 | $196.16 | 39% |
| Galgon | 12 | $2,599 | $210.34 | 48% |
| Le Bois-Plage-en-Ré | 303 | $2,528 | $284.63 | 45% |
| Sainte-Florence | 10 | $2,445 | $233.78 | 46% |
| Saint-Hippolyte | 10 | $2,443 | $204.98 | 44% |
| Lège-Cap-Ferret | 1,210 | $2,420 | $337.40 | 41% |