Rochefort Airbnb Market Analysis 2025: Short Term Rental Data & Vacation Rental Statistics in Nouvelle-Aquitaine, France
Is Airbnb profitable in Rochefort in 2025? Explore comprehensive Airbnb analytics for Rochefort, Nouvelle-Aquitaine, France to uncover income potential. This 2025 STR market report for Rochefort, based on AirROI data from April 2024 to March 2025, reveals key trends in the market of 437 active listings.
Whether you're considering an Airbnb investment in Rochefort, optimizing your existing vacation rental, or exploring rental arbitrage opportunities, understanding the Rochefort Airbnb data is crucial. Understanding the local regulations is key to maximizing your short term rental income potential. Let's dive into the specifics.
Key Rochefort Airbnb Performance Metrics Overview
Monthly Airbnb Revenue Variations & Income Potential in Rochefort (2025)
Understanding the monthly revenue variations for Airbnb listings in Rochefort is key to maximizing your short term rental income potential. Seasonality significantly impacts earnings. Our analysis, based on data from the past 12 months, shows that the peak revenue month for STRs in Rochefort is typically August, while January often presents the lowest earnings, highlighting opportunities for strategic pricing adjustments during shoulder and low seasons. Explore the typical Airbnb income in Rochefort across different performance tiers:
- Best-in-class properties (Top 10%) achieve $1,988+ monthly, often utilizing dynamic pricing and superior guest experiences.
- Strong performing properties (Top 25%) earn $1,391 or more, indicating effective management and desirable locations/amenities.
- Typical properties (Median) generate around $928 per month, representing the average market performance.
- Entry-level properties (Bottom 25%) see earnings around $528, often with potential for optimization.
Average Monthly Airbnb Earnings Trend in Rochefort
Rochefort Airbnb Occupancy Rate Trends (2025)
Maximize your bookings by understanding the Rochefort STR occupancy trends. Seasonal demand shifts significantly influence how often properties are booked. Typically, Augustsees the highest demand (peak season occupancy), while January experiences the lowest (low season). Effective strategies, like adjusting minimum stays or offering promotions, can boost occupancy during slower periods. Here's how different property tiers perform in Rochefort:
- Best-in-class properties (Top 10%) achieve 86%+ occupancy, indicating high desirability and potentially optimized availability.
- Strong performing properties (Top 25%) maintain 73% or higher occupancy, suggesting good market fit and guest satisfaction.
- Typical properties (Median) have an occupancy rate around 51%.
- Entry-level properties (Bottom 25%) average 27% occupancy, potentially facing higher vacancy.
Average Monthly Occupancy Rate Trend in Rochefort
Average Daily Rate (ADR) Airbnb Trends in Rochefort (2025)
Effective short term rental pricing strategy in Rochefort involves understanding monthly ADR fluctuations. The Average Daily Rate (ADR) for Airbnb in Rochefort typically peaks in July and dips lowest during February. Leveraging Airbnb dynamic pricing tools or strategies based on this seasonality can significantly boost revenue. Here's a look at the typical nightly rates achieved:
- Best-in-class properties (Top 10%) command rates of $126+ per night, often due to premium features or locations.
- Strong performing properties (Top 25%) achieve nightly rates of $81 or more.
- Typical properties (Median) charge around $54 per night.
- Entry-level properties (Bottom 25%) earn around $41 per night.
Average Daily Rate (ADR) Trend by Month in Rochefort
Get Live Rochefort Market Intelligence 👇

Explore Real-time Analytics
Airbnb Seasonality Analysis & Trends in Rochefort (2025)
Peak Season (August, July, May)
- Revenue averages $1,486 per month
- Occupancy rates average 60.7%
- Daily rates average $72
Shoulder Season
- Revenue averages $1,069 per month
- Occupancy maintains around 50.5%
- Daily rates hold near $70
Low Season (January, February, December)
- Revenue drops to average $658 per month
- Occupancy decreases to average 38.1%
- Daily rates adjust to average $67
Seasonality Insights for Rochefort
- The Airbnb seasonality in Rochefort shows highly seasonal trends requiring careful strategy. While the sections above show seasonal averages, it's also insightful to look at the extremes:
- During the high season, the absolute peak month showcases Rochefort's highest earning potential, with monthly revenues capable of climbing to $1,683, occupancy reaching a high of 70.8%, and ADRs peaking at $73.
- Conversely, the slowest single month of the year, typically falling within the low season, marks the market's lowest point. In this month, revenue might dip to $591, occupancy could drop to 32.8%, and ADRs may adjust down to $67.
- Understanding both the seasonal averages and these monthly peaks and troughs in revenue, occupancy, and ADR is crucial for maximizing your Airbnb profit potential in Rochefort.
Seasonal Strategies for Maximizing Profit
- Peak Season: Maximize revenue through premium pricing and potentially longer minimum stays. Ensure high availability.
- Low Season: Offer competitive pricing, special promotions (e.g., extended stay discounts), and flexible cancellation policies. Target off-season travelers like remote workers or budget-conscious guests.
- Shoulder Seasons: Implement dynamic pricing that balances peak and low rates. Target weekend travelers or specific events. Offer slightly more flexible terms than peak season.
- Regularly analyze your own performance against these Rochefort seasonality benchmarks and adjust your pricing and availability strategy accordingly.
Best Areas for Airbnb Investment in Rochefort (2025)
Exploring the top neighborhoods for short-term rentals in Rochefort? This section highlights key areas, outlining why they are attractive for hosts and guests, along with notable local attractions. Consider these locations based on your target guest profile and investment strategy.
| Neighborhood / Area | Why Host Here? (Target Guests & Appeal) | Key Attractions & Landmarks |
|---|---|---|
| Rochefort City Center | Historic heart of Rochefort, close to attractions and amenities. Perfect for travelers wanting to explore the city's heritage and enjoy local dining. | Corderie Royale, National Museum of the Marine, Rochefort's Old Port, La Maison de Pierre Loti, Rochefort's Market |
| Île d'Aix | A charming island accessible by ferry, ideal for nature lovers and those seeking a quiet retreat. Offers beautiful beaches and a relaxed atmosphere. | Beaches of Île d'Aix, Fort Liédot, Walking paths, Local seafood restaurants |
| Rochefort Sur Mer | Popular coastal area with access to beaches and watersports. Attracts families and young travelers looking for outdoor activities. | Plage de Rochefort, Water sports centers, Cycling paths, Local cafes |
| Brouage | Quaint fortified village near Rochefort, known for its historical significance. Appeals to history enthusiasts and tourists wanting to experience medieval architecture. | Haxo's Citadel, Medieval streets, Local artisanal shops |
| Fouras-les-Bains | A seaside resort town known for its beaches and family-friendly atmosphere. Great for summer rentals and beach vacations. | Fouras Beach, Fort Vauban, Seaside promenades, Local markets |
| Châtelaillon-Plage | A vibrant beach resort with a variety of tourist activities, ideal for vacation rentals during the summer months. | Châtelaillon Beach, Casino, Water Park, Promenade along the beach |
| La Rochelle (nearby) | A major tourist destination with vibrant nightlife and historic architecture, appealing to a wide range of tourists. | Old Port of La Rochelle, Towers of La Rochelle, Aquarium La Rochelle, Shopping district |
| Saint Laurent de la Prée | A peaceful village close to Rochefort, ideal for visitors seeking tranquility and the charm of the French countryside. | Nature trails, Local vineyards, Quiet countryside |
Understanding Airbnb License Requirements & STR Laws in Rochefort (2025)
With 13% of listings showing registration in 2025, understanding potential Airbnb license requirements is crucial in Rochefort. Always verify the latest short term rental regulations and Airbnb license requirements directly with local government authorities for Rochefort to ensure full compliance before hosting.
(Source: AirROI data, 2025, based on 13% licensed listings)
Top Performing Airbnb Properties in Rochefort (2025)
Benchmark your potential! Explore examples of top-performing Airbnb properties in Rochefortbased on Trailing Twelve Month (TTM) revenue. Analyze their characteristics, revenue, occupancy rate, and ADR to understand what drives success in this market.
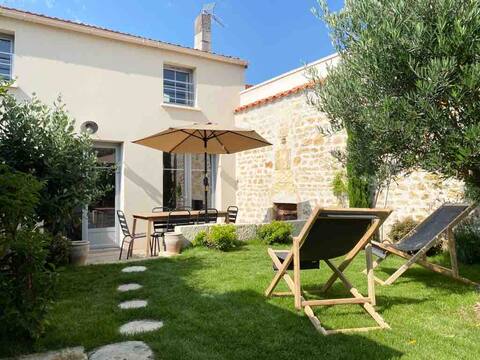
Beautifully renovated house with green garden
Entire Place • 3 bedrooms
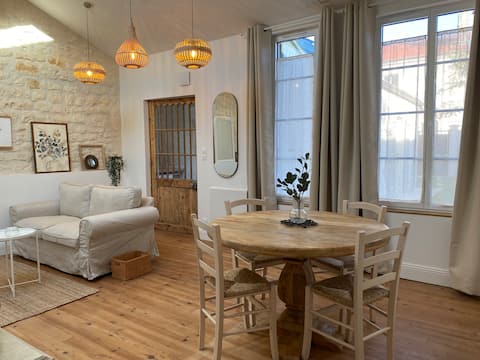
Charming house with a garden
Entire Place • 2 bedrooms

hot tub lounge house hammam jacuzzi
Entire Place • 2 bedrooms
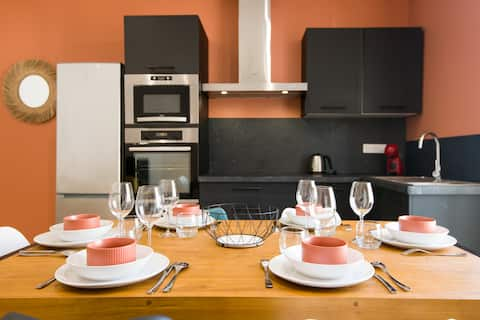
Lovely two bedrooms flat, central location !
Entire Place • 2 bedrooms
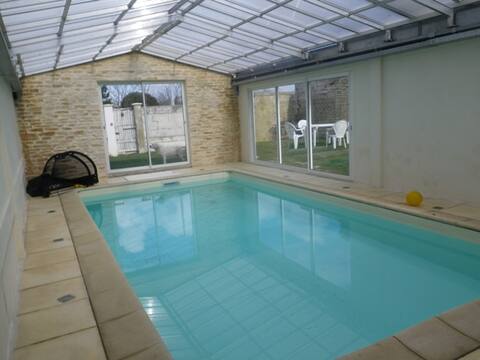
HOUSE WITH POOL HEATED
Entire Place • 7 bedrooms
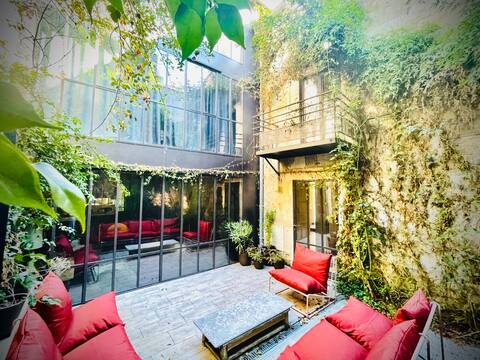
Elegant transparent house La Dame de Verre
Entire Place • 4 bedrooms
Note: Performance varies based on location, size, amenities, seasonality, and management quality. Data reflects the past 12 months.
Top Performing Airbnb Hosts in Rochefort (2025)
Learn from the best! This table showcases top-performing Airbnb hosts in Rochefort based on the number of properties managed and estimated total revenue over the past year. Analyze their scale and performance metrics.
| Host Name | Properties | Grossing Revenue | Stay Reviews | Avg Rating |
|---|---|---|---|---|
| Le Clos | 7 | $143,965 | 364 | 4.86/5.0 |
| Romain | 5 | $140,279 | 180 | 4.79/5.0 |
| Julien | 3 | $105,439 | 204 | 4.99/5.0 |
| La Conciergerie VP Concept | 9 | $104,935 | 269 | 4.80/5.0 |
| Laure | 6 | $91,323 | 403 | 4.86/5.0 |
| Alexandra Et Nicolas | 7 | $73,272 | 46 | 4.56/5.0 |
| Sandra | 2 | $52,290 | 254 | 4.96/5.0 |
| Sara Et Patrice | 2 | $48,676 | 203 | 4.88/5.0 |
| Jonathan | 4 | $48,117 | 232 | 4.83/5.0 |
| Fabien | 5 | $46,451 | 231 | 4.80/5.0 |
Analyzing the strategies of top hosts, such as their property selection, pricing, and guest communication, can offer valuable lessons for optimizing your own Airbnb operations in Rochefort.
Dive Deeper: Advanced Rochefort STR Market Data (2025)
Ready to unlock more insights? AirROI provides access to advanced metrics and comprehensive Airbnb data for Rochefort. Explore detailed analytics beyond this report to refine your investment strategy, optimize pricing, and maximize your vacation rental profits.
Explore Advanced MetricsRochefort Short-Term Rental Market Composition (2025): Property & Room Types
Room Type Distribution
Property Type Distribution
Market Composition Insights for Rochefort
- The Rochefort Airbnb market composition is heavily skewed towards Entire Home/Apt listings, which make up 93.8% of the 437 active rentals. This indicates strong guest preference for privacy and space.
- Looking at the property type distribution in Rochefort, Apartment/Condo properties are the most common (68.9%), reflecting the local real estate landscape.
- Houses represent a significant 26.3% portion, catering likely to families or larger groups.
- Smaller segments like hotel/boutique, others, outdoor/unique (combined 4.8%) offer potential for unique stay experiences.
Rochefort Airbnb Room Capacity Analysis (2025): Bedroom Distribution
Distribution of Listings by Number of Bedrooms
Room Capacity Insights for Rochefort
- The dominant room capacity in Rochefort is 1 bedroom listings, making up 53.8% of the market. This suggests a strong demand for properties suitable for couples or solo travelers.
- Together, 1 bedroom and 2 bedrooms properties represent 72.3% of the active Airbnb listings in Rochefort, indicating a high concentration in these sizes.
- With over half the market (53.8%) consisting of studios or 1-bedroom units, Rochefort is particularly well-suited for individuals or couples.
- Listings with 3+ bedrooms (7.6%) represent a smaller niche, potentially indicating an underserved market for larger group accommodations in Rochefort.
Rochefort Vacation Rental Guest Capacity Trends (2025)
Distribution of Listings by Guest Capacity
Guest Capacity Insights for Rochefort
- The most common guest capacity trend in Rochefort vacation rentals is listings accommodating 2 guests (45.1%). This suggests the primary traveler segment is likely couples or solo travelers.
- Properties designed for 2 guests and 4 guests dominate the Rochefort STR market, accounting for 74.4% of listings.
- A significant 46.2% of listings cater specifically to 1-2 guests, highlighting strong demand from couples and solo travelers in Rochefort.
- 10.3% of properties accommodate 6+ guests, serving the market segment for larger families or group travel in Rochefort.
- On average, properties in Rochefort are equipped to host 3.1 guests.
Rochefort Airbnb Booking Patterns (2025): Available vs. Booked Days
Available Days Distribution
Booked Days Distribution
Booking Pattern Insights for Rochefort
- The most common availability pattern in Rochefort falls within the 271-366 days range, representing 37.3% of listings. This suggests many properties have significant open periods on their calendars.
- Approximately 66.1% of listings show high availability (181+ days open annually), indicating potential for increased bookings or specific owner usage patterns.
- For booked days, the 181-270 days range is most frequent in Rochefort (29.5%), reflecting common guest stay durations or potential owner blocking patterns.
- A notable 35.7% of properties secure long booking periods (181+ days booked per year), highlighting successful long-term rental strategies or significant owner usage.
Rochefort Airbnb Minimum Stay Requirements Analysis
Distribution of Listings by Minimum Night Requirement
1 Night
87 listings
22.1% of total
2 Nights
118 listings
30% of total
3 Nights
52 listings
13.2% of total
4-6 Nights
61 listings
15.5% of total
7-29 Nights
46 listings
11.7% of total
30+ Nights
29 listings
7.4% of total
Key Insights
- The most prevalent minimum stay requirement in Rochefort is 2 Nights, adopted by 30% of listings. This highlights the market's preference for shorter, flexible bookings.
Recommendations
- Align with the market by considering a 2 Nights minimum stay, as 30% of Rochefort hosts use this setting.
- If feasible, allowing 1-night stays, especially midweek or during low season, could capture last-minute bookings, as only 22.1% currently do.
- Explore offering discounts for stays of 30+ nights to attract the 7.4% of the market seeking extended stays.
- Adjust minimum nights based on seasonality – potentially shorter during low season and longer during peak demand periods in Rochefort.
Rochefort Airbnb Cancellation Policy Trends Analysis (2025)
Flexible
128 listings
33.2% of total
Moderate
116 listings
30.1% of total
Firm
65 listings
16.8% of total
Strict
77 listings
19.9% of total
Cancellation Policy Insights for Rochefort
- The prevailing Airbnb cancellation policy trend in Rochefort is Flexible, used by 33.2% of listings.
- There's a relatively balanced mix between guest-friendly (63.3%) and stricter (36.7%) policies, offering choices for different guest needs.
Recommendations for Hosts
- Consider adopting a Flexible policy to align with the 33.2% market standard in Rochefort.
- Regularly review your cancellation policy against competitors and market demand shifts in Rochefort.
Rochefort STR Booking Lead Time Analysis (2025)
Average Booking Lead Time by Month
Booking Lead Time Insights for Rochefort
- The overall average booking lead time for vacation rentals in Rochefort is 76 days.
- Guests book furthest in advance for stays during October (average 106 days), likely coinciding with peak travel demand or local events.
- The shortest booking windows occur for stays in February (average 40 days), indicating more last-minute travel plans during this time.
- Seasonally, Summer (95 days avg.) sees the longest lead times, while Winter (42 days avg.) has the shortest, reflecting typical travel planning cycles.
Recommendations for Hosts
- Use the overall average lead time (76 days) as a baseline for your pricing and availability strategy in Rochefort.
- For October stays, consider implementing length-of-stay discounts or slightly higher rates for bookings made less than 106 days out to capitalize on advance planning.
- Target marketing efforts for the Summer season well in advance (at least 95 days) to capture early planners.
- Monitor your own booking lead times against these Rochefort averages to identify opportunities for dynamic pricing adjustments.
Popular & Essential Airbnb Amenities in Rochefort (2025)
Amenity Prevalence
Amenity Insights for Rochefort
- Essential amenities in Rochefort that guests expect include: Heating, Kitchen. Lacking these (any) could significantly impact bookings.
- Popular amenities like TV, Wifi, Hot water are common but not universal. Offering these can provide a competitive edge.
- Warning: Wifi is not universally provided but is considered essential globally. Ensure reliable Wifi is offered.
Recommendations for Hosts
- Ensure your listing includes all essential amenities for Rochefort: Heating, Kitchen.
- Prioritize adding missing essentials: Heating, Kitchen.
- Consider adding popular differentiators like TV or Wifi to increase appeal.
- Highlight unique or less common amenities you offer (e.g., hot tub, dedicated workspace, EV charger) in your listing description and photos.
- Regularly check competitor amenities in Rochefort to stay competitive.
Rochefort Airbnb Guest Demographics & Profile Analysis (2025)
Guest Profile Summary for Rochefort
- The typical guest profile for Airbnb in Rochefort consists of primarily domestic travelers (92%), often arriving from nearby Paris, typically belonging to the Post-2000s (Gen Z/Alpha) group (50%), primarily speaking French or English.
- Domestic travelers account for 91.9% of guests.
- Key international markets include France (91.9%) and United Kingdom (1.4%).
- Top languages spoken are French (47.3%) followed by English (29.8%).
- A significant demographic segment is the Post-2000s (Gen Z/Alpha) group, representing 50% of guests.
Recommendations for Hosts
- Target domestic marketing efforts towards travelers from Paris and Bordeaux.
- Tailor amenities and listing descriptions to appeal to the dominant Post-2000s (Gen Z/Alpha) demographic (e.g., highlight fast WiFi, smart home features, local guides).
- Highlight unique local experiences or amenities relevant to the primary guest profile.
- Consider seasonal promotions aligned with peak travel times for key origin markets.
Nearby Short-Term Rental Market Comparison
How does the Rochefort Airbnb market stack up against its neighbors? Compare key performance metrics like average monthly revenue, ADR, and occupancy rates in surrounding areas to understand the broader regional STR landscape.
| Market | Active Properties | Monthly Revenue | Daily Rate | Avg. Occupancy |
|---|---|---|---|---|
| Saint-Laurent-des-Combes | 11 | $3,526 | $706.18 | 23% |
| Astaffort | 10 | $3,393 | $314.20 | 35% |
| Cénac | 18 | $2,773 | $268.58 | 53% |
| Bourneau | 11 | $2,747 | $442.07 | 35% |
| Nuaillé-d'Aunis | 10 | $2,741 | $373.83 | 37% |
| Cérons | 11 | $2,635 | $196.16 | 39% |
| Galgon | 12 | $2,599 | $210.34 | 48% |
| Eynesse | 14 | $2,564 | $282.87 | 36% |
| Le Bois-Plage-en-Ré | 303 | $2,528 | $284.63 | 45% |
| Le Grand-Pressigny | 11 | $2,511 | $266.72 | 31% |