Port-des-Barques Airbnb Market Analysis 2025: Short Term Rental Data & Vacation Rental Statistics in Nouvelle-Aquitaine, France
Is Airbnb profitable in Port-des-Barques in 2025? Explore comprehensive Airbnb analytics for Port-des-Barques, Nouvelle-Aquitaine, France to uncover income potential. This 2025 STR market report for Port-des-Barques, based on AirROI data from April 2024 to March 2025, reveals key trends in the niche market of 54 active listings.
Whether you're considering an Airbnb investment in Port-des-Barques, optimizing your existing vacation rental, or exploring rental arbitrage opportunities, understanding the Port-des-Barques Airbnb data is crucial. Leveraging the low regulation environment is key to maximizing your short term rental income potential. Let's dive into the specifics.
Key Port-des-Barques Airbnb Performance Metrics Overview
Monthly Airbnb Revenue Variations & Income Potential in Port-des-Barques (2025)
Understanding the monthly revenue variations for Airbnb listings in Port-des-Barques is key to maximizing your short term rental income potential. Seasonality significantly impacts earnings. Our analysis, based on data from the past 12 months, shows that the peak revenue month for STRs in Port-des-Barques is typically August, while February often presents the lowest earnings, highlighting opportunities for strategic pricing adjustments during shoulder and low seasons. Explore the typical Airbnb income in Port-des-Barques across different performance tiers:
- Best-in-class properties (Top 10%) achieve $2,908+ monthly, often utilizing dynamic pricing and superior guest experiences.
- Strong performing properties (Top 25%) earn $2,070 or more, indicating effective management and desirable locations/amenities.
- Typical properties (Median) generate around $1,351 per month, representing the average market performance.
- Entry-level properties (Bottom 25%) see earnings around $794, often with potential for optimization.
Average Monthly Airbnb Earnings Trend in Port-des-Barques
Port-des-Barques Airbnb Occupancy Rate Trends (2025)
Maximize your bookings by understanding the Port-des-Barques STR occupancy trends. Seasonal demand shifts significantly influence how often properties are booked. Typically, Augustsees the highest demand (peak season occupancy), while January experiences the lowest (low season). Effective strategies, like adjusting minimum stays or offering promotions, can boost occupancy during slower periods. Here's how different property tiers perform in Port-des-Barques:
- Best-in-class properties (Top 10%) achieve 74%+ occupancy, indicating high desirability and potentially optimized availability.
- Strong performing properties (Top 25%) maintain 62% or higher occupancy, suggesting good market fit and guest satisfaction.
- Typical properties (Median) have an occupancy rate around 41%.
- Entry-level properties (Bottom 25%) average 24% occupancy, potentially facing higher vacancy.
Average Monthly Occupancy Rate Trend in Port-des-Barques
Average Daily Rate (ADR) Airbnb Trends in Port-des-Barques (2025)
Effective short term rental pricing strategy in Port-des-Barques involves understanding monthly ADR fluctuations. The Average Daily Rate (ADR) for Airbnb in Port-des-Barques typically peaks in July and dips lowest during January. Leveraging Airbnb dynamic pricing tools or strategies based on this seasonality can significantly boost revenue. Here's a look at the typical nightly rates achieved:
- Best-in-class properties (Top 10%) command rates of $182+ per night, often due to premium features or locations.
- Strong performing properties (Top 25%) achieve nightly rates of $125 or more.
- Typical properties (Median) charge around $95 per night.
- Entry-level properties (Bottom 25%) earn around $73 per night.
Average Daily Rate (ADR) Trend by Month in Port-des-Barques
Get Live Port-des-Barques Market Intelligence 👇

Explore Real-time Analytics
Airbnb Seasonality Analysis & Trends in Port-des-Barques (2025)
Peak Season (August, July, May)
- Revenue averages $2,500 per month
- Occupancy rates average 63.0%
- Daily rates average $120
Shoulder Season
- Revenue averages $1,375 per month
- Occupancy maintains around 39.2%
- Daily rates hold near $113
Low Season (January, February, March)
- Revenue drops to average $971 per month
- Occupancy decreases to average 32.1%
- Daily rates adjust to average $108
Seasonality Insights for Port-des-Barques
- The Airbnb seasonality in Port-des-Barques shows highly seasonal trends requiring careful strategy. While the sections above show seasonal averages, it's also insightful to look at the extremes:
- During the high season, the absolute peak month showcases Port-des-Barques's highest earning potential, with monthly revenues capable of climbing to $2,940, occupancy reaching a high of 77.5%, and ADRs peaking at $123.
- Conversely, the slowest single month of the year, typically falling within the low season, marks the market's lowest point. In this month, revenue might dip to $943, occupancy could drop to 27.4%, and ADRs may adjust down to $107.
- Understanding both the seasonal averages and these monthly peaks and troughs in revenue, occupancy, and ADR is crucial for maximizing your Airbnb profit potential in Port-des-Barques.
Seasonal Strategies for Maximizing Profit
- Peak Season: Maximize revenue through premium pricing and potentially longer minimum stays. Ensure high availability.
- Low Season: Offer competitive pricing, special promotions (e.g., extended stay discounts), and flexible cancellation policies. Target off-season travelers like remote workers or budget-conscious guests.
- Shoulder Seasons: Implement dynamic pricing that balances peak and low rates. Target weekend travelers or specific events. Offer slightly more flexible terms than peak season.
- Regularly analyze your own performance against these Port-des-Barques seasonality benchmarks and adjust your pricing and availability strategy accordingly.
Best Areas for Airbnb Investment in Port-des-Barques (2025)
Exploring the top neighborhoods for short-term rentals in Port-des-Barques? This section highlights key areas, outlining why they are attractive for hosts and guests, along with notable local attractions. Consider these locations based on your target guest profile and investment strategy.
| Neighborhood / Area | Why Host Here? (Target Guests & Appeal) | Key Attractions & Landmarks |
|---|---|---|
| Plage de Port-des-Barques | A beautiful beach location perfect for families and sun-seekers. The serene atmosphere and sandy shores attract tourists looking to relax by the water. | Plage de Port-des-Barques, La Pointe de la Fumée, Les cabanes de pêcheurs, Sentier des Douaniers, Café de la Plage |
| Île Madame | A charming island accessible by boat or at low tide, offering a unique getaway with nature trails and scenic views. Ideal for tourists who love outdoor activities and tranquility. | Île Madame, Nature walks, Birdwatching spots, Scenic viewpoints |
| La Rochelle | Nearby city known for its historic harbor and vibrant culture. A major tourist destination with a rich history, attracting visitors year-round. | Old Port of La Rochelle, Towers of La Rochelle, Aquarium La Rochelle, Historic city center, Museum of New World |
| Île d'Oléron | One of the largest islands in France, known for its beautiful beaches, cycling paths, and fresh seafood. A popular summer destination for tourists. | Côte Sauvage, Phare de Chassiron, Oléron Aquarium, Oyster farming tours, Beaches of Gros Jonc |
| Fort Boyard | Famous fortification located between the islands of Oléron and Aix, appealing to history enthusiasts and tourists interested in the famous TV show. | Fort Boyard tours, Boat trips, Historical significance, Scenic boat rides |
| Saintes | A historic town with Roman ruins and rich cultural heritage. Attracts visitors interested in history and culture. | Saint Pierre Cathedral, Arch of Germanicus, Historic city center, Antique shops, Museums |
| Rochefort | A significant maritime city with an interesting history and beautiful architecture. Suitable for tourists interested in maritime heritage. | Corderie Royale, Naval Museum, Rochefort Town Hall, Historic gardens, Riverside walks |
| Châtelaillon-Plage | A coastal resort town that combines beach life with a maritime atmosphere. Perfect for families and beach lovers. | Châtelaillon Beach, Water sports, Promenade, Restaurants and cafes, Casino |
Understanding Airbnb License Requirements & STR Laws in Port-des-Barques (2025)
While Port-des-Barques, Nouvelle-Aquitaine, France currently shows low STR regulations, specific Airbnb license requirements might still exist or change. Always verify the latest short term rental regulations and Airbnb license requirements directly with local government authorities for Port-des-Barques to ensure full compliance before hosting.
(Source: AirROI data, 2025, based on 2% licensed listings)
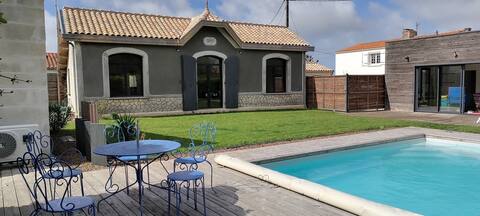
Top Performing Airbnb Properties in Port-des-Barques (2025)
Benchmark your potential! Explore examples of top-performing Airbnb properties in Port-des-Barquesbased on Trailing Twelve Month (TTM) revenue. Analyze their characteristics, revenue, occupancy rate, and ADR to understand what drives success in this market.

Beautiful house with a pool
Entire Place • 4 bedrooms
La Vieve - Pleasant house with pool
Entire Place • 3 bedrooms

4* villa with pool & sea view
Entire Place • 3 bedrooms
Sea view villa, beachfront, with small pool
Entire Place • 3 bedrooms

House by the sea, classified 3 stars.
Entire Place • 3 bedrooms
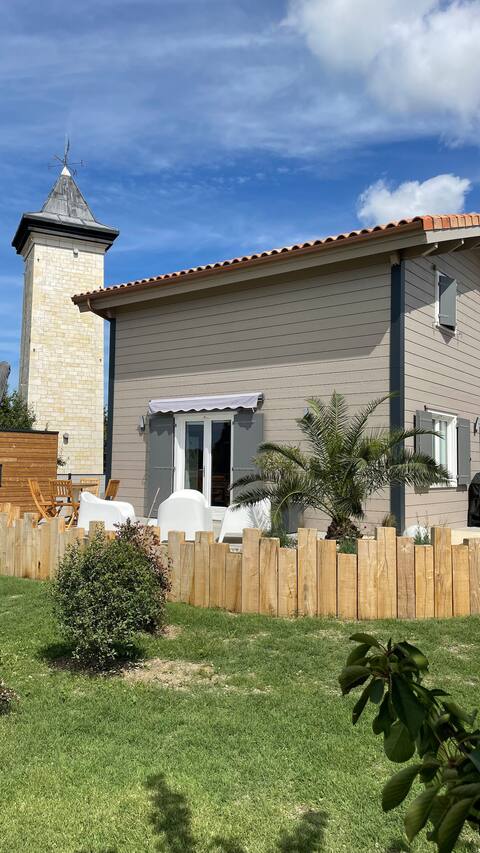
In the foot of the Lighthouse
Entire Place • 4 bedrooms
Note: Performance varies based on location, size, amenities, seasonality, and management quality. Data reflects the past 12 months.
Top Performing Airbnb Hosts in Port-des-Barques (2025)
Learn from the best! This table showcases top-performing Airbnb hosts in Port-des-Barques based on the number of properties managed and estimated total revenue over the past year. Analyze their scale and performance metrics.
| Host Name | Properties | Grossing Revenue | Stay Reviews | Avg Rating |
|---|---|---|---|---|
| Aurélia Et Sacha | 1 | $35,803 | 5 | 5.00/5.0 |
| Marie Catherine | 1 | $33,395 | 21 | 4.86/5.0 |
| Maryline | 1 | $27,012 | 15 | 4.87/5.0 |
| Jacques | 1 | $24,496 | 21 | 4.62/5.0 |
| Raphaël | 1 | $23,953 | 24 | 5.00/5.0 |
| Dominique Albert Marie | 1 | $23,383 | 53 | 4.98/5.0 |
| Charles Et Fatiha | 1 | $23,023 | 79 | 4.87/5.0 |
| Villa Foxy | 1 | $20,839 | 15 | 4.87/5.0 |
| Marc | 1 | $20,603 | 37 | 4.92/5.0 |
| Julie | 1 | $20,385 | 25 | 4.92/5.0 |
Analyzing the strategies of top hosts, such as their property selection, pricing, and guest communication, can offer valuable lessons for optimizing your own Airbnb operations in Port-des-Barques.
Dive Deeper: Advanced Port-des-Barques STR Market Data (2025)
Ready to unlock more insights? AirROI provides access to advanced metrics and comprehensive Airbnb data for Port-des-Barques. Explore detailed analytics beyond this report to refine your investment strategy, optimize pricing, and maximize your vacation rental profits.
Explore Advanced MetricsPort-des-Barques Short-Term Rental Market Composition (2025): Property & Room Types
Room Type Distribution
Property Type Distribution
Market Composition Insights for Port-des-Barques
- The Port-des-Barques Airbnb market composition is heavily skewed towards Entire Home/Apt listings, which make up 94.4% of the 54 active rentals. This indicates strong guest preference for privacy and space.
- Looking at the property type distribution in Port-des-Barques, House properties are the most common (83.3%), reflecting the local real estate landscape.
- Houses represent a significant 83.3% portion, catering likely to families or larger groups.
- Smaller segments like others, hotel/boutique, outdoor/unique (combined 5.7%) offer potential for unique stay experiences.
Port-des-Barques Airbnb Room Capacity Analysis (2025): Bedroom Distribution
Distribution of Listings by Number of Bedrooms
Room Capacity Insights for Port-des-Barques
- The dominant room capacity in Port-des-Barques is 3 bedrooms listings, making up 35.2% of the market. This suggests a strong demand for properties suitable for families or small groups.
- Together, 3 bedrooms and 2 bedrooms properties represent 66.7% of the active Airbnb listings in Port-des-Barques, indicating a high concentration in these sizes.
- A significant 44.5% of listings offer 3+ bedrooms, catering to larger groups and families seeking more space in Port-des-Barques.
Port-des-Barques Vacation Rental Guest Capacity Trends (2025)
Distribution of Listings by Guest Capacity
Guest Capacity Insights for Port-des-Barques
- The most common guest capacity trend in Port-des-Barques vacation rentals is listings accommodating 6 guests (33.3%). This suggests the primary traveler segment is likely larger groups.
- Properties designed for 6 guests and 4 guests dominate the Port-des-Barques STR market, accounting for 51.8% of listings.
- 48.2% of properties accommodate 6+ guests, serving the market segment for larger families or group travel in Port-des-Barques.
- On average, properties in Port-des-Barques are equipped to host 4.9 guests.
Port-des-Barques Airbnb Booking Patterns (2025): Available vs. Booked Days
Available Days Distribution
Booked Days Distribution
Booking Pattern Insights for Port-des-Barques
- The most common availability pattern in Port-des-Barques falls within the 271-366 days range, representing 48.1% of listings. This suggests many properties have significant open periods on their calendars.
- Approximately 81.4% of listings show high availability (181+ days open annually), indicating potential for increased bookings or specific owner usage patterns.
- For booked days, the 91-180 days range is most frequent in Port-des-Barques (33.3%), reflecting common guest stay durations or potential owner blocking patterns.
- A notable 24.1% of properties secure long booking periods (181+ days booked per year), highlighting successful long-term rental strategies or significant owner usage.
Port-des-Barques Airbnb Minimum Stay Requirements Analysis
Distribution of Listings by Minimum Night Requirement
1 Night
3 listings
7% of total
2 Nights
12 listings
27.9% of total
3 Nights
13 listings
30.2% of total
4-6 Nights
4 listings
9.3% of total
7-29 Nights
6 listings
14% of total
30+ Nights
5 listings
11.6% of total
Key Insights
- The most prevalent minimum stay requirement in Port-des-Barques is 3 Nights, adopted by 30.2% of listings. This highlights the market's preference for longer commitments.
- A significant segment (11.6%) caters to monthly stays (30+ nights) in Port-des-Barques, pointing to opportunities in the extended-stay market.
Recommendations
- Align with the market by considering a 3 Nights minimum stay, as 30.2% of Port-des-Barques hosts use this setting.
- If feasible, allowing 1-night stays, especially midweek or during low season, could capture last-minute bookings, as only 7% currently do.
- Explore offering discounts for stays of 30+ nights to attract the 11.6% of the market seeking extended stays.
- Adjust minimum nights based on seasonality – potentially shorter during low season and longer during peak demand periods in Port-des-Barques.
Port-des-Barques Airbnb Cancellation Policy Trends Analysis (2025)
Flexible
6 listings
13% of total
Moderate
13 listings
28.3% of total
Firm
15 listings
32.6% of total
Strict
12 listings
26.1% of total
Cancellation Policy Insights for Port-des-Barques
- The prevailing Airbnb cancellation policy trend in Port-des-Barques is Firm, used by 32.6% of listings.
- A majority (58.7%) of hosts in Port-des-Barques utilize Firm or Strict policies, indicating a market where hosts prioritize booking security.
Recommendations for Hosts
- Consider adopting a Firm policy to align with the 32.6% market standard in Port-des-Barques.
- Regularly review your cancellation policy against competitors and market demand shifts in Port-des-Barques.
Port-des-Barques STR Booking Lead Time Analysis (2025)
Average Booking Lead Time by Month
Booking Lead Time Insights for Port-des-Barques
- The overall average booking lead time for vacation rentals in Port-des-Barques is 62 days.
- Guests book furthest in advance for stays during July (average 117 days), likely coinciding with peak travel demand or local events.
- The shortest booking windows occur for stays in February (average 43 days), indicating more last-minute travel plans during this time.
- Seasonally, Summer (105 days avg.) sees the longest lead times, while Winter (48 days avg.) has the shortest, reflecting typical travel planning cycles.
Recommendations for Hosts
- Use the overall average lead time (62 days) as a baseline for your pricing and availability strategy in Port-des-Barques.
- For July stays, consider implementing length-of-stay discounts or slightly higher rates for bookings made less than 117 days out to capitalize on advance planning.
- Target marketing efforts for the Summer season well in advance (at least 105 days) to capture early planners.
- Monitor your own booking lead times against these Port-des-Barques averages to identify opportunities for dynamic pricing adjustments.
Popular & Essential Airbnb Amenities in Port-des-Barques (2025)
Amenity Prevalence
Amenity Insights for Port-des-Barques
- Essential amenities in Port-des-Barques that guests expect include: Kitchen. Lacking these (this) could significantly impact bookings.
- Popular amenities like Free parking on premises, Hot water, TV are common but not universal. Offering these can provide a competitive edge.
- Warning: Wifi is not universally provided but is considered essential globally. Ensure reliable Wifi is offered.
Recommendations for Hosts
- Ensure your listing includes all essential amenities for Port-des-Barques: Kitchen.
- Prioritize adding missing essentials: Kitchen.
- Consider adding popular differentiators like Free parking on premises or Hot water to increase appeal.
- Highlight unique or less common amenities you offer (e.g., hot tub, dedicated workspace, EV charger) in your listing description and photos.
- Regularly check competitor amenities in Port-des-Barques to stay competitive.
Port-des-Barques Airbnb Guest Demographics & Profile Analysis (2025)
Guest Profile Summary for Port-des-Barques
- The typical guest profile for Airbnb in Port-des-Barques consists of primarily domestic travelers (88%), often arriving from nearby Paris, typically belonging to the Post-2000s (Gen Z/Alpha) group (50%), primarily speaking French or English.
- Domestic travelers account for 88.0% of guests.
- Key international markets include France (88%) and Germany (3%).
- Top languages spoken are French (44.6%) followed by English (31.3%).
- A significant demographic segment is the Post-2000s (Gen Z/Alpha) group, representing 50% of guests.
Recommendations for Hosts
- Target domestic marketing efforts towards travelers from Paris and Angoulême.
- Tailor amenities and listing descriptions to appeal to the dominant Post-2000s (Gen Z/Alpha) demographic (e.g., highlight fast WiFi, smart home features, local guides).
- Highlight unique local experiences or amenities relevant to the primary guest profile.
- Consider seasonal promotions aligned with peak travel times for key origin markets.
Nearby Short-Term Rental Market Comparison
How does the Port-des-Barques Airbnb market stack up against its neighbors? Compare key performance metrics like average monthly revenue, ADR, and occupancy rates in surrounding areas to understand the broader regional STR landscape.
| Market | Active Properties | Monthly Revenue | Daily Rate | Avg. Occupancy |
|---|---|---|---|---|
| Saint-Laurent-des-Combes | 11 | $3,526 | $706.18 | 23% |
| Cénac | 18 | $2,773 | $268.58 | 53% |
| Bourneau | 11 | $2,747 | $442.07 | 35% |
| Nuaillé-d'Aunis | 10 | $2,741 | $373.83 | 37% |
| Cérons | 11 | $2,635 | $196.16 | 39% |
| Galgon | 12 | $2,599 | $210.34 | 48% |
| Le Bois-Plage-en-Ré | 303 | $2,528 | $284.63 | 45% |
| Sainte-Florence | 10 | $2,445 | $233.78 | 46% |
| Saint-Hippolyte | 10 | $2,443 | $204.98 | 44% |
| Lège-Cap-Ferret | 1,210 | $2,420 | $337.40 | 41% |