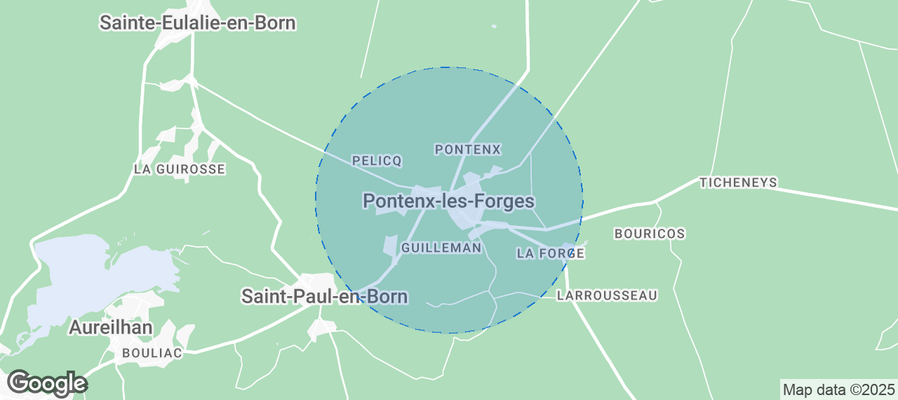
Pontenx-les-Forges Airbnb Market Analysis 2025: Short Term Rental Data & Vacation Rental Statistics in Nouvelle-Aquitaine, France
Is Airbnb profitable in Pontenx-les-Forges in 2025? Explore comprehensive Airbnb analytics for Pontenx-les-Forges, Nouvelle-Aquitaine, France to uncover income potential. This 2025 STR market report for Pontenx-les-Forges, based on AirROI data from April 2024 to March 2025, reveals key trends in the niche market of 35 active listings.
Whether you're considering an Airbnb investment in Pontenx-les-Forges, optimizing your existing vacation rental, or exploring rental arbitrage opportunities, understanding the Pontenx-les-Forges Airbnb data is crucial. Leveraging the low regulation environment is key to maximizing your short term rental income potential. Let's dive into the specifics.
Key Pontenx-les-Forges Airbnb Performance Metrics Overview
Monthly Airbnb Revenue Variations & Income Potential in Pontenx-les-Forges (2025)
Understanding the monthly revenue variations for Airbnb listings in Pontenx-les-Forges is key to maximizing your short term rental income potential. Seasonality significantly impacts earnings. Our analysis, based on data from the past 12 months, shows that the peak revenue month for STRs in Pontenx-les-Forges is typically August, while January often presents the lowest earnings, highlighting opportunities for strategic pricing adjustments during shoulder and low seasons. Explore the typical Airbnb income in Pontenx-les-Forges across different performance tiers:
- Best-in-class properties (Top 10%) achieve $3,044+ monthly, often utilizing dynamic pricing and superior guest experiences.
- Strong performing properties (Top 25%) earn $1,559 or more, indicating effective management and desirable locations/amenities.
- Typical properties (Median) generate around $767 per month, representing the average market performance.
- Entry-level properties (Bottom 25%) see earnings around $417, often with potential for optimization.
Average Monthly Airbnb Earnings Trend in Pontenx-les-Forges
Pontenx-les-Forges Airbnb Occupancy Rate Trends (2025)
Maximize your bookings by understanding the Pontenx-les-Forges STR occupancy trends. Seasonal demand shifts significantly influence how often properties are booked. Typically, Augustsees the highest demand (peak season occupancy), while November experiences the lowest (low season). Effective strategies, like adjusting minimum stays or offering promotions, can boost occupancy during slower periods. Here's how different property tiers perform in Pontenx-les-Forges:
- Best-in-class properties (Top 10%) achieve 57%+ occupancy, indicating high desirability and potentially optimized availability.
- Strong performing properties (Top 25%) maintain 43% or higher occupancy, suggesting good market fit and guest satisfaction.
- Typical properties (Median) have an occupancy rate around 23%.
- Entry-level properties (Bottom 25%) average 12% occupancy, potentially facing higher vacancy.
Average Monthly Occupancy Rate Trend in Pontenx-les-Forges
Average Daily Rate (ADR) Airbnb Trends in Pontenx-les-Forges (2025)
Effective short term rental pricing strategy in Pontenx-les-Forges involves understanding monthly ADR fluctuations. The Average Daily Rate (ADR) for Airbnb in Pontenx-les-Forges typically peaks in July and dips lowest during February. Leveraging Airbnb dynamic pricing tools or strategies based on this seasonality can significantly boost revenue. Here's a look at the typical nightly rates achieved:
- Best-in-class properties (Top 10%) command rates of $324+ per night, often due to premium features or locations.
- Strong performing properties (Top 25%) achieve nightly rates of $163 or more.
- Typical properties (Median) charge around $91 per night.
- Entry-level properties (Bottom 25%) earn around $60 per night.
Average Daily Rate (ADR) Trend by Month in Pontenx-les-Forges
Get Live Pontenx-les-Forges Market Intelligence 👇
Explore Real-time Analytics
Airbnb Seasonality Analysis & Trends in Pontenx-les-Forges (2025)
Peak Season (August, July, May)
- Revenue averages $2,463 per month
- Occupancy rates average 45.7%
- Daily rates average $149
Shoulder Season
- Revenue averages $1,068 per month
- Occupancy maintains around 21.6%
- Daily rates hold near $140
Low Season (January, February, March)
- Revenue drops to average $565 per month
- Occupancy decreases to average 22.9%
- Daily rates adjust to average $137
Seasonality Insights for Pontenx-les-Forges
- The Airbnb seasonality in Pontenx-les-Forges shows highly seasonal trends requiring careful strategy. While the sections above show seasonal averages, it's also insightful to look at the extremes:
- During the high season, the absolute peak month showcases Pontenx-les-Forges's highest earning potential, with monthly revenues capable of climbing to $3,429, occupancy reaching a high of 62.0%, and ADRs peaking at $154.
- Conversely, the slowest single month of the year, typically falling within the low season, marks the market's lowest point. In this month, revenue might dip to $528, occupancy could drop to 16.2%, and ADRs may adjust down to $137.
- Understanding both the seasonal averages and these monthly peaks and troughs in revenue, occupancy, and ADR is crucial for maximizing your Airbnb profit potential in Pontenx-les-Forges.
Seasonal Strategies for Maximizing Profit
- Peak Season: Maximize revenue through premium pricing and potentially longer minimum stays. Ensure high availability.
- Low Season: Offer competitive pricing, special promotions (e.g., extended stay discounts), and flexible cancellation policies. Target off-season travelers like remote workers or budget-conscious guests.
- Shoulder Seasons: Implement dynamic pricing that balances peak and low rates. Target weekend travelers or specific events. Offer slightly more flexible terms than peak season.
- Regularly analyze your own performance against these Pontenx-les-Forges seasonality benchmarks and adjust your pricing and availability strategy accordingly.
Best Areas for Airbnb Investment in Pontenx-les-Forges (2025)
Exploring the top neighborhoods for short-term rentals in Pontenx-les-Forges? This section highlights key areas, outlining why they are attractive for hosts and guests, along with notable local attractions. Consider these locations based on your target guest profile and investment strategy.
| Neighborhood / Area | Why Host Here? (Target Guests & Appeal) | Key Attractions & Landmarks |
|---|---|---|
| Plage de la Salie | A stunning beach area perfect for relaxation, water sports, and sunbathing. Attracts families and tourists looking for coastal leisure activities. | Plage de la Salie, Dune du Pilat, Bassin d'Arcachon, Water sports activities, Local seafood restaurants |
| Les Landes Forest | Known for its extensive pine forests, this area is great for hiking and nature lovers. Perfect for those seeking tranquility and outdoor adventures. | Bike trails, Hiking routes, Wildlife viewing, Canoeing on lakes, Picnic areas |
| Moustey Nature Reserve | A peaceful reserve offering natural beauty and biodiversity, appealing to eco-tourists and nature photographers. | Birdwatching, Nature trails, Photography opportunities, Floral diversity, Scenic landscape |
| Sanguinet Lake | A beautiful freshwater lake that offers swimming, fishing, and kayaking. A perfect spot for families and water sports enthusiasts. | Swimming, Kayaking, Fishing, Picnic spots, Scenic walking paths |
| Hostens | A charming village known for its serene environment and connection to local culture. Ideal for those seeking a quiet getaway with cultural experiences. | Local markets, Cultural festivals, Historical buildings, Scenic views, Nearby vineyards |
| Cazaux | A quaint area near the lake and ocean with beautiful landscapes and outdoor activities like sailing, biking, and hiking. | Cazaux Lake, Sailing, Biking trails, Local wineries, Historic sites |
| Arcachon | A popular beach town renowned for its oyster farms and stunning vistas. Attracts tourists all year round for its vibrant seaside attractions. | Oyster farms, Arcachon Bay, Beachfront promenades, Shopping areas, Cultural activities |
| Biscarrosse | Known for its beach and lake, this area offers a variety of outdoor recreational activities and is favored by tourists looking for adventure. | Biscarrosse Beach, Lake Biscarrosse, Water sports, Surfing, Camping areas |
Understanding Airbnb License Requirements & STR Laws in Pontenx-les-Forges (2025)
While Pontenx-les-Forges, Nouvelle-Aquitaine, France currently shows low STR regulations, specific Airbnb license requirements might still exist or change. Always verify the latest short term rental regulations and Airbnb license requirements directly with local government authorities for Pontenx-les-Forges to ensure full compliance before hosting.
(Source: AirROI data, 2025, based on 9% licensed listings)
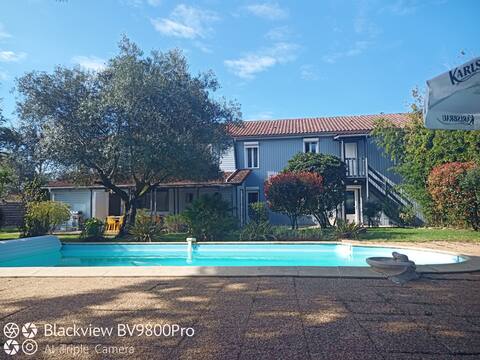
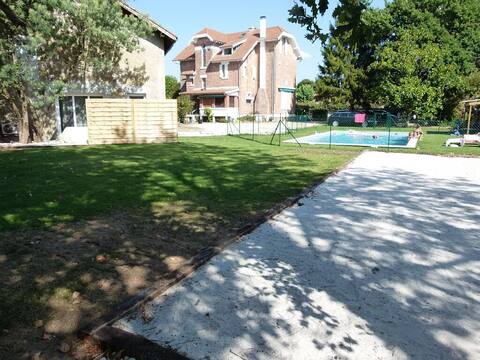
Top Performing Airbnb Properties in Pontenx-les-Forges (2025)
Benchmark your potential! Explore examples of top-performing Airbnb properties in Pontenx-les-Forgesbased on Trailing Twelve Month (TTM) revenue. Analyze their characteristics, revenue, occupancy rate, and ADR to understand what drives success in this market.
Large capacity rental - 1/20 people
Entire Place • 10 bedrooms
Arcachonnaise 9 ch, gîte T3, piscine, RARE
Entire Place • 11 bedrooms
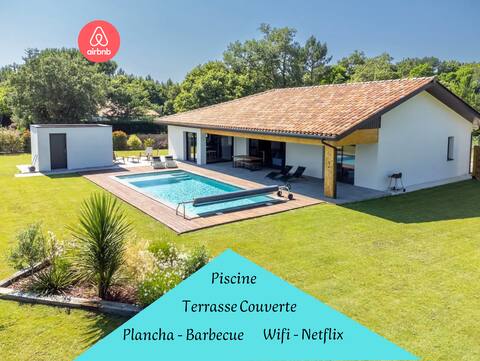
Stunning, quiet villa with a pool
Entire Place • 3 bedrooms
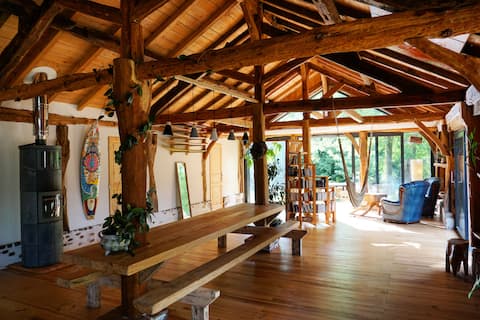
Unique "La Grange", near ocean
Entire Place • 5 bedrooms

Landes sheepfold in a park 1 ha
Entire Place • 2 bedrooms
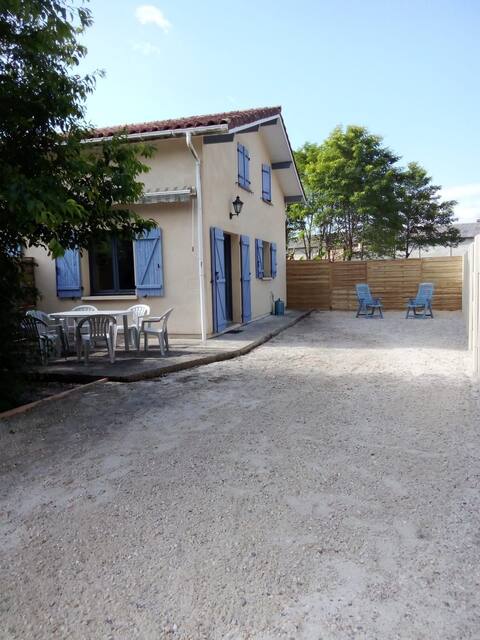
house with shaded terrace
Entire Place • 2 bedrooms
Note: Performance varies based on location, size, amenities, seasonality, and management quality. Data reflects the past 12 months.
Top Performing Airbnb Hosts in Pontenx-les-Forges (2025)
Learn from the best! This table showcases top-performing Airbnb hosts in Pontenx-les-Forges based on the number of properties managed and estimated total revenue over the past year. Analyze their scale and performance metrics.
| Host Name | Properties | Grossing Revenue | Stay Reviews | Avg Rating |
|---|---|---|---|---|
| Céline Et Nicolas | 1 | $52,941 | 38 | 4.82/5.0 |
| Nicolas | 3 | $47,154 | 50 | 4.77/5.0 |
| Amandine Et Maureen | 2 | $27,224 | 19 | 4.96/5.0 |
| Claire | 1 | $24,011 | 3 | 5.00/5.0 |
| Marie | 1 | $15,817 | 96 | 4.96/5.0 |
| Sylvie | 1 | $14,184 | 7 | 4.57/5.0 |
| Geneviève | 1 | $13,467 | 19 | 4.84/5.0 |
| Sarah | 2 | $10,810 | 21 | 4.87/5.0 |
| Élisabeth | 1 | $9,764 | 28 | 4.89/5.0 |
| Host #131412435 | 1 | $9,407 | 0 | 0.00/5.0 |
Analyzing the strategies of top hosts, such as their property selection, pricing, and guest communication, can offer valuable lessons for optimizing your own Airbnb operations in Pontenx-les-Forges.
Dive Deeper: Advanced Pontenx-les-Forges STR Market Data (2025)
Ready to unlock more insights? AirROI provides access to advanced metrics and comprehensive Airbnb data for Pontenx-les-Forges. Explore detailed analytics beyond this report to refine your investment strategy, optimize pricing, and maximize your vacation rental profits.
Explore Advanced MetricsPontenx-les-Forges Short-Term Rental Market Composition (2025): Property & Room Types
Room Type Distribution
Property Type Distribution
Market Composition Insights for Pontenx-les-Forges
- The Pontenx-les-Forges Airbnb market composition is heavily skewed towards Entire Home/Apt listings, which make up 80% of the 35 active rentals. This indicates strong guest preference for privacy and space.
- Looking at the property type distribution in Pontenx-les-Forges, House properties are the most common (71.4%), reflecting the local real estate landscape.
- Houses represent a significant 71.4% portion, catering likely to families or larger groups.
- The presence of 14.3% Hotel/Boutique listings indicates integration with traditional hospitality.
- Smaller segments like unique stays (combined 2.9%) offer potential for unique stay experiences.
Pontenx-les-Forges Airbnb Room Capacity Analysis (2025): Bedroom Distribution
Distribution of Listings by Number of Bedrooms
Room Capacity Insights for Pontenx-les-Forges
- The dominant room capacity in Pontenx-les-Forges is 2 bedrooms listings, making up 28.6% of the market. This suggests a strong demand for properties suitable for couples or solo travelers.
- Together, 2 bedrooms and 3 bedrooms properties represent 45.7% of the active Airbnb listings in Pontenx-les-Forges, indicating a high concentration in these sizes.
- A significant 34.2% of listings offer 3+ bedrooms, catering to larger groups and families seeking more space in Pontenx-les-Forges.
Pontenx-les-Forges Vacation Rental Guest Capacity Trends (2025)
Distribution of Listings by Guest Capacity
Guest Capacity Insights for Pontenx-les-Forges
- The most common guest capacity trend in Pontenx-les-Forges vacation rentals is listings accommodating 8+ guests (25.7%). This suggests the primary traveler segment is likely larger groups.
- Properties designed for 8+ guests and 6 guests dominate the Pontenx-les-Forges STR market, accounting for 45.7% of listings.
- 45.7% of properties accommodate 6+ guests, serving the market segment for larger families or group travel in Pontenx-les-Forges.
- On average, properties in Pontenx-les-Forges are equipped to host 4.5 guests.
Pontenx-les-Forges Airbnb Booking Patterns (2025): Available vs. Booked Days
Available Days Distribution
Booked Days Distribution
Booking Pattern Insights for Pontenx-les-Forges
- The most common availability pattern in Pontenx-les-Forges falls within the 271-366 days range, representing 82.9% of listings. This suggests many properties have significant open periods on their calendars.
- Approximately 100.0% of listings show high availability (181+ days open annually), indicating potential for increased bookings or specific owner usage patterns.
- For booked days, the 31-90 days range is most frequent in Pontenx-les-Forges (45.7%), reflecting common guest stay durations or potential owner blocking patterns.
Pontenx-les-Forges Airbnb Minimum Stay Requirements Analysis
Distribution of Listings by Minimum Night Requirement
1 Night
6 listings
17.1% of total
2 Nights
7 listings
20% of total
3 Nights
8 listings
22.9% of total
4-6 Nights
7 listings
20% of total
7-29 Nights
4 listings
11.4% of total
30+ Nights
3 listings
8.6% of total
Key Insights
- The most prevalent minimum stay requirement in Pontenx-les-Forges is 3 Nights, adopted by 22.9% of listings. This highlights the market's preference for longer commitments.
Recommendations
- Align with the market by considering a 3 Nights minimum stay, as 22.9% of Pontenx-les-Forges hosts use this setting.
- If feasible, allowing 1-night stays, especially midweek or during low season, could capture last-minute bookings, as only 17.1% currently do.
- Explore offering discounts for stays of 30+ nights to attract the 8.6% of the market seeking extended stays.
- Adjust minimum nights based on seasonality – potentially shorter during low season and longer during peak demand periods in Pontenx-les-Forges.
Pontenx-les-Forges Airbnb Cancellation Policy Trends Analysis (2025)
Flexible
2 listings
6.7% of total
Moderate
10 listings
33.3% of total
Firm
7 listings
23.3% of total
Strict
11 listings
36.7% of total
Cancellation Policy Insights for Pontenx-les-Forges
- The prevailing Airbnb cancellation policy trend in Pontenx-les-Forges is Strict, used by 36.7% of listings.
- A majority (60.0%) of hosts in Pontenx-les-Forges utilize Firm or Strict policies, indicating a market where hosts prioritize booking security.
Recommendations for Hosts
- Consider adopting a Strict policy to align with the 36.7% market standard in Pontenx-les-Forges.
- With 36.7% using Strict terms, this is a viable option in Pontenx-les-Forges, particularly for high-value properties or during peak demand periods.
- Regularly review your cancellation policy against competitors and market demand shifts in Pontenx-les-Forges.
Pontenx-les-Forges STR Booking Lead Time Analysis (2025)
Average Booking Lead Time by Month
Booking Lead Time Insights for Pontenx-les-Forges
- The overall average booking lead time for vacation rentals in Pontenx-les-Forges is 52 days.
- Guests book furthest in advance for stays during October (average 99 days), likely coinciding with peak travel demand or local events.
- The shortest booking windows occur for stays in March (average 13 days), indicating more last-minute travel plans during this time.
- Seasonally, Fall (74 days avg.) sees the longest lead times, while Spring (40 days avg.) has the shortest, reflecting typical travel planning cycles.
Recommendations for Hosts
- Use the overall average lead time (52 days) as a baseline for your pricing and availability strategy in Pontenx-les-Forges.
- For October stays, consider implementing length-of-stay discounts or slightly higher rates for bookings made less than 99 days out to capitalize on advance planning.
- During March, focus on last-minute booking availability and promotions, as guests book with very short notice (13 days avg.).
- Target marketing efforts for the Fall season well in advance (at least 74 days) to capture early planners.
- Monitor your own booking lead times against these Pontenx-les-Forges averages to identify opportunities for dynamic pricing adjustments.
Popular & Essential Airbnb Amenities in Pontenx-les-Forges (2025)
Amenity Prevalence
Amenity Insights for Pontenx-les-Forges
- Essential amenities in Pontenx-les-Forges that guests expect include: Free parking on premises. Lacking these (this) could significantly impact bookings.
- Popular amenities like Kitchen, Hot water, Heating are common but not universal. Offering these can provide a competitive edge.
- Warning: Wifi is not universally provided but is considered essential globally. Ensure reliable Wifi is offered.
Recommendations for Hosts
- Ensure your listing includes all essential amenities for Pontenx-les-Forges: Free parking on premises.
- Prioritize adding missing essentials: Free parking on premises.
- Consider adding popular differentiators like Kitchen or Hot water to increase appeal.
- Highlight unique or less common amenities you offer (e.g., hot tub, dedicated workspace, EV charger) in your listing description and photos.
- Regularly check competitor amenities in Pontenx-les-Forges to stay competitive.
Pontenx-les-Forges Airbnb Guest Demographics & Profile Analysis (2025)
Guest Profile Summary for Pontenx-les-Forges
- The typical guest profile for Airbnb in Pontenx-les-Forges consists of primarily domestic travelers (75%), often arriving from nearby Paris, typically belonging to the Post-2000s (Gen Z/Alpha) group (50%), primarily speaking English or French.
- Domestic travelers account for 74.8% of guests.
- Key international markets include France (74.8%) and Spain (6.9%).
- Top languages spoken are English (36.4%) followed by French (34.9%).
- A significant demographic segment is the Post-2000s (Gen Z/Alpha) group, representing 50% of guests.
Recommendations for Hosts
- Target domestic marketing efforts towards travelers from Paris and Bordeaux.
- Tailor amenities and listing descriptions to appeal to the dominant Post-2000s (Gen Z/Alpha) demographic (e.g., highlight fast WiFi, smart home features, local guides).
- Highlight unique local experiences or amenities relevant to the primary guest profile.
- Consider seasonal promotions aligned with peak travel times for key origin markets.
Nearby Short-Term Rental Market Comparison
How does the Pontenx-les-Forges Airbnb market stack up against its neighbors? Compare key performance metrics like average monthly revenue, ADR, and occupancy rates in surrounding areas to understand the broader regional STR landscape.
| Market | Active Properties | Monthly Revenue | Daily Rate | Avg. Occupancy |
|---|---|---|---|---|
| San Sebastián | 1,426 | $3,546 | $262.81 | 49% |
| Saint-Laurent-des-Combes | 11 | $3,526 | $706.18 | 23% |
| Gautegiz Arteaga | 21 | $2,865 | $293.66 | 38% |
| Cénac | 18 | $2,773 | $268.58 | 53% |
| Cérons | 11 | $2,635 | $196.16 | 39% |
| Barrika | 13 | $2,629 | $314.61 | 41% |
| Galgon | 12 | $2,599 | $210.34 | 48% |
| Hernani | 11 | $2,572 | $345.16 | 40% |
| Saint-Hippolyte | 10 | $2,443 | $204.98 | 44% |
| Dima | 11 | $2,422 | $332.91 | 42% |