Pons Airbnb Market Analysis 2025: Short Term Rental Data & Vacation Rental Statistics in Nouvelle-Aquitaine, France
Is Airbnb profitable in Pons in 2025? Explore comprehensive Airbnb analytics for Pons, Nouvelle-Aquitaine, France to uncover income potential. This 2025 STR market report for Pons, based on AirROI data from April 2024 to March 2025, reveals key trends in the niche market of 33 active listings.
Whether you're considering an Airbnb investment in Pons, optimizing your existing vacation rental, or exploring rental arbitrage opportunities, understanding the Pons Airbnb data is crucial. Leveraging the low regulation environment is key to maximizing your short term rental income potential. Let's dive into the specifics.
Key Pons Airbnb Performance Metrics Overview
Monthly Airbnb Revenue Variations & Income Potential in Pons (2025)
Understanding the monthly revenue variations for Airbnb listings in Pons is key to maximizing your short term rental income potential. Seasonality significantly impacts earnings. Our analysis, based on data from the past 12 months, shows that the peak revenue month for STRs in Pons is typically August, while March often presents the lowest earnings, highlighting opportunities for strategic pricing adjustments during shoulder and low seasons. Explore the typical Airbnb income in Pons across different performance tiers:
- Best-in-class properties (Top 10%) achieve $2,922+ monthly, often utilizing dynamic pricing and superior guest experiences.
- Strong performing properties (Top 25%) earn $1,726 or more, indicating effective management and desirable locations/amenities.
- Typical properties (Median) generate around $902 per month, representing the average market performance.
- Entry-level properties (Bottom 25%) see earnings around $462, often with potential for optimization.
Average Monthly Airbnb Earnings Trend in Pons
Pons Airbnb Occupancy Rate Trends (2025)
Maximize your bookings by understanding the Pons STR occupancy trends. Seasonal demand shifts significantly influence how often properties are booked. Typically, Augustsees the highest demand (peak season occupancy), while March experiences the lowest (low season). Effective strategies, like adjusting minimum stays or offering promotions, can boost occupancy during slower periods. Here's how different property tiers perform in Pons:
- Best-in-class properties (Top 10%) achieve 61%+ occupancy, indicating high desirability and potentially optimized availability.
- Strong performing properties (Top 25%) maintain 43% or higher occupancy, suggesting good market fit and guest satisfaction.
- Typical properties (Median) have an occupancy rate around 29%.
- Entry-level properties (Bottom 25%) average 14% occupancy, potentially facing higher vacancy.
Average Monthly Occupancy Rate Trend in Pons
Average Daily Rate (ADR) Airbnb Trends in Pons (2025)
Effective short term rental pricing strategy in Pons involves understanding monthly ADR fluctuations. The Average Daily Rate (ADR) for Airbnb in Pons typically peaks in July and dips lowest during March. Leveraging Airbnb dynamic pricing tools or strategies based on this seasonality can significantly boost revenue. Here's a look at the typical nightly rates achieved:
- Best-in-class properties (Top 10%) command rates of $195+ per night, often due to premium features or locations.
- Strong performing properties (Top 25%) achieve nightly rates of $146 or more.
- Typical properties (Median) charge around $107 per night.
- Entry-level properties (Bottom 25%) earn around $67 per night.
Average Daily Rate (ADR) Trend by Month in Pons
Get Live Pons Market Intelligence 👇

Explore Real-time Analytics
Airbnb Seasonality Analysis & Trends in Pons (2025)
Peak Season (August, July, April)
- Revenue averages $2,280 per month
- Occupancy rates average 46.2%
- Daily rates average $131
Shoulder Season
- Revenue averages $1,238 per month
- Occupancy maintains around 29.4%
- Daily rates hold near $127
Low Season (January, February, March)
- Revenue drops to average $687 per month
- Occupancy decreases to average 21.5%
- Daily rates adjust to average $123
Seasonality Insights for Pons
- The Airbnb seasonality in Pons shows highly seasonal trends requiring careful strategy. While the sections above show seasonal averages, it's also insightful to look at the extremes:
- During the high season, the absolute peak month showcases Pons's highest earning potential, with monthly revenues capable of climbing to $2,664, occupancy reaching a high of 60.3%, and ADRs peaking at $135.
- Conversely, the slowest single month of the year, typically falling within the low season, marks the market's lowest point. In this month, revenue might dip to $574, occupancy could drop to 16.9%, and ADRs may adjust down to $120.
- Understanding both the seasonal averages and these monthly peaks and troughs in revenue, occupancy, and ADR is crucial for maximizing your Airbnb profit potential in Pons.
Seasonal Strategies for Maximizing Profit
- Peak Season: Maximize revenue through premium pricing and potentially longer minimum stays. Ensure high availability.
- Low Season: Offer competitive pricing, special promotions (e.g., extended stay discounts), and flexible cancellation policies. Target off-season travelers like remote workers or budget-conscious guests.
- Shoulder Seasons: Implement dynamic pricing that balances peak and low rates. Target weekend travelers or specific events. Offer slightly more flexible terms than peak season.
- Regularly analyze your own performance against these Pons seasonality benchmarks and adjust your pricing and availability strategy accordingly.
Best Areas for Airbnb Investment in Pons (2025)
Exploring the top neighborhoods for short-term rentals in Pons? This section highlights key areas, outlining why they are attractive for hosts and guests, along with notable local attractions. Consider these locations based on your target guest profile and investment strategy.
| Neighborhood / Area | Why Host Here? (Target Guests & Appeal) | Key Attractions & Landmarks |
|---|---|---|
| Centre-ville de Pons | Historic town center with medieval architecture and charm. A great location for travelers interested in history and culture, with easy access to local attractions. | Église Saint-Vivien, Château de Pons, Place de la République, Musée de Pons, Les Halles |
| Cognac | Famous for its brandy production, Cognac attracts tourists interested in winery tours and tastings. An excellent choice for guests seeking a unique gastronomic experience. | Cognac Distilleries, Hennessy Visitor Center, Château de Cognac, Rue de l'Hotel de Ville, Public Garden |
| Saintes | An ancient city known for its Roman ruins and vibrant arts scene. Offers a mix of history and modern amenities, appealing to a diverse group of travelers. | Arch of Germanicus, Saintes Amphitheatre, Abbaye Aux Dames, Museum of Saintes, La Garonne promenade |
| Jonzac | A spa resort town featuring thermal baths and wellness facilities. Ideal for relaxation seekers and families looking for health-centered vacations. | Les Antilles de Jonzac, Thermes de Jonzac, Château de Jonzac, Parc de la Garonne, Eglise Saint-Germier |
| Mirambeau | A quaint town located between Bordeaux and Cognac, known for its beautiful countryside and vineyards. Perfect for rural retreats and wine tourism. | Château de Mirambeau, Wine estates, Local markets, Cultural festivals, Nature trails |
| Montendre | A picturesque small town close to the forest and natural parks. Great for outdoor enthusiasts and families seeking nature escapes. | Nature reserves, Local hiking trails, Château de Montendre, Market square, Lakeside parks |
| Smirnos | A developing area known for its natural beauty and tranquility. Attracts eco-tourists and those looking for a peaceful getaway. | Nature parks, Riverside activities, Local farms, Trails and biking routes, Wildlife watching |
| Tesson | A charming village known for its serene rural landscape and proximity to larger towns. Offers a rural atmosphere with modern conveniences. | Local farms, Organic markets, Hiking trails, Historical sites, Community events |
Understanding Airbnb License Requirements & STR Laws in Pons (2025)
While Pons, Nouvelle-Aquitaine, France currently shows low STR regulations, specific Airbnb license requirements might still exist or change. Always verify the latest short term rental regulations and Airbnb license requirements directly with local government authorities for Pons to ensure full compliance before hosting.
(Source: AirROI data, 2025, based on 9% licensed listings)
Top Performing Airbnb Properties in Pons (2025)
Benchmark your potential! Explore examples of top-performing Airbnb properties in Ponsbased on Trailing Twelve Month (TTM) revenue. Analyze their characteristics, revenue, occupancy rate, and ADR to understand what drives success in this market.

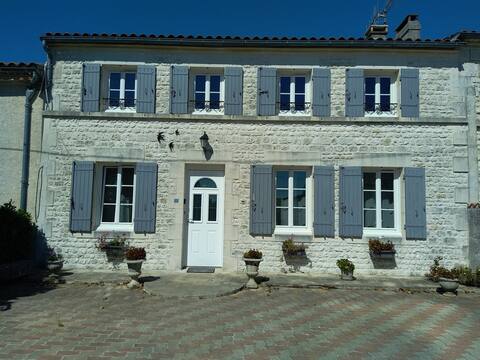
For you, a beautiful and large Charentaise home
Entire Place • 12 bedrooms

Cozy townhouse with pool
Entire Place • 3 bedrooms
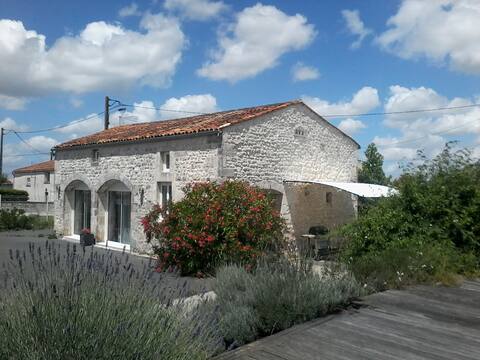
3-star air-conditioned pool cottage "Les Hirondelles"
Entire Place • 4 bedrooms

Beautiful Grand Villa to rent in South West France
Entire Place • 5 bedrooms
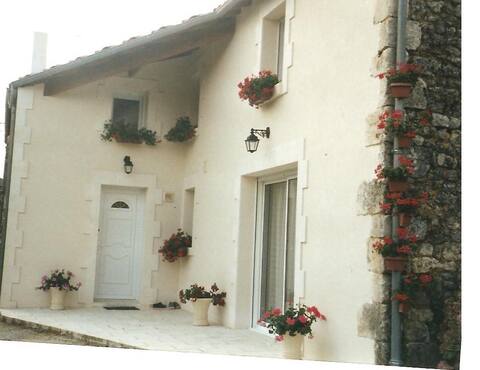
"Le Pigeonnier" air-conditioned cottage - classified 3 stars
Entire Place • 3 bedrooms
Welcome to André's!
Entire Place • 3 bedrooms
Note: Performance varies based on location, size, amenities, seasonality, and management quality. Data reflects the past 12 months.
Top Performing Airbnb Hosts in Pons (2025)
Learn from the best! This table showcases top-performing Airbnb hosts in Pons based on the number of properties managed and estimated total revenue over the past year. Analyze their scale and performance metrics.
| Host Name | Properties | Grossing Revenue | Stay Reviews | Avg Rating |
|---|---|---|---|---|
| François | 1 | $69,758 | 101 | 4.81/5.0 |
| Fabrice | 2 | $50,518 | 241 | 4.72/5.0 |
| Emmanuelle | 1 | $40,231 | 30 | 5.00/5.0 |
| Le Moulin Chaillou | 3 | $26,941 | 92 | 4.68/5.0 |
| Clarisse | 2 | $26,939 | 65 | 4.92/5.0 |
| Jacqueline | 1 | $25,089 | 5 | 5.00/5.0 |
| Bénédicte | 3 | $24,410 | 37 | 5.00/5.0 |
| Cyril | 3 | $22,837 | 317 | 4.75/5.0 |
| Dorothée | 1 | $16,844 | 4 | 4.75/5.0 |
| Florence | 1 | $13,181 | 21 | 5.00/5.0 |
Analyzing the strategies of top hosts, such as their property selection, pricing, and guest communication, can offer valuable lessons for optimizing your own Airbnb operations in Pons.
Dive Deeper: Advanced Pons STR Market Data (2025)
Ready to unlock more insights? AirROI provides access to advanced metrics and comprehensive Airbnb data for Pons. Explore detailed analytics beyond this report to refine your investment strategy, optimize pricing, and maximize your vacation rental profits.
Explore Advanced MetricsPons Short-Term Rental Market Composition (2025): Property & Room Types
Room Type Distribution
Property Type Distribution
Market Composition Insights for Pons
- The Pons Airbnb market composition is heavily skewed towards Entire Home/Apt listings, which make up 75.8% of the 33 active rentals. This indicates strong guest preference for privacy and space.
- Looking at the property type distribution in Pons, House properties are the most common (54.5%), reflecting the local real estate landscape.
- Houses represent a significant 54.5% portion, catering likely to families or larger groups.
- The presence of 21.2% Hotel/Boutique listings indicates integration with traditional hospitality.
- Smaller segments like outdoor/unique (combined 3.0%) offer potential for unique stay experiences.
Pons Airbnb Room Capacity Analysis (2025): Bedroom Distribution
Distribution of Listings by Number of Bedrooms
Room Capacity Insights for Pons
- The dominant room capacity in Pons is 2 bedrooms listings, making up 30.3% of the market. This suggests a strong demand for properties suitable for couples or solo travelers.
- Together, 2 bedrooms and 1 bedroom properties represent 57.6% of the active Airbnb listings in Pons, indicating a high concentration in these sizes.
- A significant 30.4% of listings offer 3+ bedrooms, catering to larger groups and families seeking more space in Pons.
Pons Vacation Rental Guest Capacity Trends (2025)
Distribution of Listings by Guest Capacity
Guest Capacity Insights for Pons
- The most common guest capacity trend in Pons vacation rentals is listings accommodating 8+ guests (21.2%). This suggests the primary traveler segment is likely larger groups.
- Properties designed for 8+ guests and 6 guests dominate the Pons STR market, accounting for 42.4% of listings.
- 45.4% of properties accommodate 6+ guests, serving the market segment for larger families or group travel in Pons.
- On average, properties in Pons are equipped to host 4.5 guests.
Pons Airbnb Booking Patterns (2025): Available vs. Booked Days
Available Days Distribution
Booked Days Distribution
Booking Pattern Insights for Pons
- The most common availability pattern in Pons falls within the 271-366 days range, representing 63.6% of listings. This suggests many properties have significant open periods on their calendars.
- Approximately 93.9% of listings show high availability (181+ days open annually), indicating potential for increased bookings or specific owner usage patterns.
- For booked days, the 31-90 days range is most frequent in Pons (51.5%), reflecting common guest stay durations or potential owner blocking patterns.
- A notable 12.1% of properties secure long booking periods (181+ days booked per year), highlighting successful long-term rental strategies or significant owner usage.
Pons Airbnb Minimum Stay Requirements Analysis
Distribution of Listings by Minimum Night Requirement
1 Night
17 listings
53.1% of total
2 Nights
8 listings
25% of total
3 Nights
2 listings
6.3% of total
4-6 Nights
2 listings
6.3% of total
7-29 Nights
3 listings
9.4% of total
Key Insights
- The most prevalent minimum stay requirement in Pons is 1 Night, adopted by 53.1% of listings. This highlights the market's preference for shorter, flexible bookings.
- A strong majority (78.1%) of the Pons Airbnb data shows acceptance of very short stays (1-2 nights), indicating a dynamic, high-turnover market.
Recommendations
- Align with the market by considering a 1 Night minimum stay, as 53.1% of Pons hosts use this setting.
- Adjust minimum nights based on seasonality – potentially shorter during low season and longer during peak demand periods in Pons.
Pons Airbnb Cancellation Policy Trends Analysis (2025)
Flexible
13 listings
41.9% of total
Moderate
9 listings
29% of total
Firm
4 listings
12.9% of total
Strict
5 listings
16.1% of total
Cancellation Policy Insights for Pons
- The prevailing Airbnb cancellation policy trend in Pons is Flexible, used by 41.9% of listings.
- The market strongly favors guest-friendly terms, with 70.9% of listings offering Flexible or Moderate policies. This suggests guests in Pons may expect booking flexibility.
Recommendations for Hosts
- Consider adopting a Flexible policy to align with the 41.9% market standard in Pons.
- Regularly review your cancellation policy against competitors and market demand shifts in Pons.
Pons STR Booking Lead Time Analysis (2025)
Average Booking Lead Time by Month
Booking Lead Time Insights for Pons
- The overall average booking lead time for vacation rentals in Pons is 57 days.
- Guests book furthest in advance for stays during May (average 105 days), likely coinciding with peak travel demand or local events.
- The shortest booking windows occur for stays in March (average 41 days), indicating more last-minute travel plans during this time.
- Seasonally, Spring (69 days avg.) sees the longest lead times, while Winter (49 days avg.) has the shortest, reflecting typical travel planning cycles.
Recommendations for Hosts
- Use the overall average lead time (57 days) as a baseline for your pricing and availability strategy in Pons.
- For May stays, consider implementing length-of-stay discounts or slightly higher rates for bookings made less than 105 days out to capitalize on advance planning.
- Target marketing efforts for the Spring season well in advance (at least 69 days) to capture early planners.
- Monitor your own booking lead times against these Pons averages to identify opportunities for dynamic pricing adjustments.
Popular & Essential Airbnb Amenities in Pons (2025)
Amenity Prevalence
Amenity Insights for Pons
- Essential amenities in Pons that guests expect include: Hot water. Lacking these (this) could significantly impact bookings.
- Popular amenities like Wifi, Smoke alarm, TV are common but not universal. Offering these can provide a competitive edge.
- Warning: Wifi is not universally provided but is considered essential globally. Ensure reliable Wifi is offered.
Recommendations for Hosts
- Ensure your listing includes all essential amenities for Pons: Hot water.
- Prioritize adding missing essentials: Hot water.
- Consider adding popular differentiators like Wifi or Smoke alarm to increase appeal.
- Highlight unique or less common amenities you offer (e.g., hot tub, dedicated workspace, EV charger) in your listing description and photos.
- Regularly check competitor amenities in Pons to stay competitive.
Pons Airbnb Guest Demographics & Profile Analysis (2025)
Guest Profile Summary for Pons
- The typical guest profile for Airbnb in Pons consists of primarily domestic travelers (82%), often arriving from nearby Paris, typically belonging to the Post-2000s (Gen Z/Alpha) group (50%), primarily speaking French or English.
- Domestic travelers account for 82.2% of guests.
- Key international markets include France (82.2%) and Belgium (3%).
- Top languages spoken are French (46.2%) followed by English (31.2%).
- A significant demographic segment is the Post-2000s (Gen Z/Alpha) group, representing 50% of guests.
Recommendations for Hosts
- Target domestic marketing efforts towards travelers from Paris and Toulouse.
- Tailor amenities and listing descriptions to appeal to the dominant Post-2000s (Gen Z/Alpha) demographic (e.g., highlight fast WiFi, smart home features, local guides).
- Highlight unique local experiences or amenities relevant to the primary guest profile.
- Consider seasonal promotions aligned with peak travel times for key origin markets.
Nearby Short-Term Rental Market Comparison
How does the Pons Airbnb market stack up against its neighbors? Compare key performance metrics like average monthly revenue, ADR, and occupancy rates in surrounding areas to understand the broader regional STR landscape.
| Market | Active Properties | Monthly Revenue | Daily Rate | Avg. Occupancy |
|---|---|---|---|---|
| Saint-Laurent-des-Combes | 11 | $3,526 | $706.18 | 23% |
| Astaffort | 10 | $3,393 | $314.20 | 35% |
| Cénac | 18 | $2,773 | $268.58 | 53% |
| Bourneau | 11 | $2,747 | $442.07 | 35% |
| Nuaillé-d'Aunis | 10 | $2,741 | $373.83 | 37% |
| Cérons | 11 | $2,635 | $196.16 | 39% |
| Galgon | 12 | $2,599 | $210.34 | 48% |
| Eynesse | 14 | $2,564 | $282.87 | 36% |
| Le Bois-Plage-en-Ré | 303 | $2,528 | $284.63 | 45% |
| Le Grand-Pressigny | 11 | $2,511 | $266.72 | 31% |