Pessac Airbnb Market Analysis 2025: Short Term Rental Data & Vacation Rental Statistics in Nouvelle-Aquitaine, France
Is Airbnb profitable in Pessac in 2025? Explore comprehensive Airbnb analytics for Pessac, Nouvelle-Aquitaine, France to uncover income potential. This 2025 STR market report for Pessac, based on AirROI data from April 2024 to March 2025, reveals key trends in the market of 325 active listings.
Whether you're considering an Airbnb investment in Pessac, optimizing your existing vacation rental, or exploring rental arbitrage opportunities, understanding the Pessac Airbnb data is crucial. Leveraging the low regulation environment is key to maximizing your short term rental income potential. Let's dive into the specifics.
Key Pessac Airbnb Performance Metrics Overview
Monthly Airbnb Revenue Variations & Income Potential in Pessac (2025)
Understanding the monthly revenue variations for Airbnb listings in Pessac is key to maximizing your short term rental income potential. Seasonality significantly impacts earnings. Our analysis, based on data from the past 12 months, shows that the peak revenue month for STRs in Pessac is typically August, while February often presents the lowest earnings, highlighting opportunities for strategic pricing adjustments during shoulder and low seasons. Explore the typical Airbnb income in Pessac across different performance tiers:
- Best-in-class properties (Top 10%) achieve $3,063+ monthly, often utilizing dynamic pricing and superior guest experiences.
- Strong performing properties (Top 25%) earn $1,763 or more, indicating effective management and desirable locations/amenities.
- Typical properties (Median) generate around $1,067 per month, representing the average market performance.
- Entry-level properties (Bottom 25%) see earnings around $576, often with potential for optimization.
Average Monthly Airbnb Earnings Trend in Pessac
Pessac Airbnb Occupancy Rate Trends (2025)
Maximize your bookings by understanding the Pessac STR occupancy trends. Seasonal demand shifts significantly influence how often properties are booked. Typically, Septembersees the highest demand (peak season occupancy), while March experiences the lowest (low season). Effective strategies, like adjusting minimum stays or offering promotions, can boost occupancy during slower periods. Here's how different property tiers perform in Pessac:
- Best-in-class properties (Top 10%) achieve 89%+ occupancy, indicating high desirability and potentially optimized availability.
- Strong performing properties (Top 25%) maintain 75% or higher occupancy, suggesting good market fit and guest satisfaction.
- Typical properties (Median) have an occupancy rate around 51%.
- Entry-level properties (Bottom 25%) average 24% occupancy, potentially facing higher vacancy.
Average Monthly Occupancy Rate Trend in Pessac
Average Daily Rate (ADR) Airbnb Trends in Pessac (2025)
Effective short term rental pricing strategy in Pessac involves understanding monthly ADR fluctuations. The Average Daily Rate (ADR) for Airbnb in Pessac typically peaks in July and dips lowest during March. Leveraging Airbnb dynamic pricing tools or strategies based on this seasonality can significantly boost revenue. Here's a look at the typical nightly rates achieved:
- Best-in-class properties (Top 10%) command rates of $264+ per night, often due to premium features or locations.
- Strong performing properties (Top 25%) achieve nightly rates of $111 or more.
- Typical properties (Median) charge around $67 per night.
- Entry-level properties (Bottom 25%) earn around $47 per night.
Average Daily Rate (ADR) Trend by Month in Pessac
Get Live Pessac Market Intelligence 👇

Explore Real-time Analytics
Airbnb Seasonality Analysis & Trends in Pessac (2025)
Peak Season (August, July, June)
- Revenue averages $2,018 per month
- Occupancy rates average 53.1%
- Daily rates average $114
Shoulder Season
- Revenue averages $1,520 per month
- Occupancy maintains around 52.2%
- Daily rates hold near $112
Low Season (January, February, March)
- Revenue drops to average $1,017 per month
- Occupancy decreases to average 43.5%
- Daily rates adjust to average $109
Seasonality Insights for Pessac
- The Airbnb seasonality in Pessac shows highly seasonal trends requiring careful strategy. While the sections above show seasonal averages, it's also insightful to look at the extremes:
- During the high season, the absolute peak month showcases Pessac's highest earning potential, with monthly revenues capable of climbing to $2,126, occupancy reaching a high of 62.3%, and ADRs peaking at $115.
- Conversely, the slowest single month of the year, typically falling within the low season, marks the market's lowest point. In this month, revenue might dip to $986, occupancy could drop to 40.1%, and ADRs may adjust down to $108.
- Understanding both the seasonal averages and these monthly peaks and troughs in revenue, occupancy, and ADR is crucial for maximizing your Airbnb profit potential in Pessac.
Seasonal Strategies for Maximizing Profit
- Peak Season: Maximize revenue through premium pricing and potentially longer minimum stays. Ensure high availability.
- Low Season: Offer competitive pricing, special promotions (e.g., extended stay discounts), and flexible cancellation policies. Target off-season travelers like remote workers or budget-conscious guests.
- Shoulder Seasons: Implement dynamic pricing that balances peak and low rates. Target weekend travelers or specific events. Offer slightly more flexible terms than peak season.
- Regularly analyze your own performance against these Pessac seasonality benchmarks and adjust your pricing and availability strategy accordingly.
Best Areas for Airbnb Investment in Pessac (2025)
Exploring the top neighborhoods for short-term rentals in Pessac? This section highlights key areas, outlining why they are attractive for hosts and guests, along with notable local attractions. Consider these locations based on your target guest profile and investment strategy.
| Neighborhood / Area | Why Host Here? (Target Guests & Appeal) | Key Attractions & Landmarks |
|---|---|---|
| Centre Ville | The city center of Pessac is vibrant with restaurants, shops, and cultural attractions. It's a prime location for visitors wanting to experience local life and access public transport easily. | Château Pape Clément, Pessac's historic market, Cité Frugès, Parc Bordelais, Local bistros and cafes |
| Pessac Léognan | Known for its wine production, this area attracts tourists looking for wine tours and tastings. It is perfect for those who enjoy gastronomic experiences and scenic vineyards. | Wine estates, Château Haut-Brion, Wine tasting tours, Vineyard walks, Local artisanal food shops |
| Parc Renaud | A family-friendly residential area with parks and recreational spaces. Ideal for family travelers seeking a peaceful environment with easy access to nature. | Parc Renaud, Children's playgrounds, Walking trails, Local markets, Community events |
| Pessac Alouette | A quiet suburb with a mix of urban and rural environments. It's appealing for those looking to escape the hustle and bustle while still being close to amenities. | Green spaces, Local parks, Small shops, Cafés, Community centers |
| Cité Frugès | An architectural site showcasing modernist houses designed by the famous architect Le Corbusier. Attracts architecture enthusiasts and cultural tourists. | Le Corbusier houses, Cultural tours, Architecture schools, Art exhibitions, Local galleries |
| Groupe Scolaire Pajol | An educational hub that sees many parents visiting for school activities. It could be appealing for families visiting for events or stays during school functions. | School events, Local family-friendly amenities, Parks nearby, Cafes, Family-oriented activities |
| Tramway Neighborhood | This area is well connected by tram to Bordeaux, making it a convenient spot for commuters and visitors looking to explore both cities easily. | Tram station access, Shopping areas, Cafés and restaurants, Proximity to Bordeaux, Local parks |
| Château de Pessac area | A picturesque area surrounding the historic château, perfect for tourists seeking charm and heritage, ideal for romantic getaways. | Château de Pessac, Historical tours, Gardens, Scenic walks, Event venues |
Understanding Airbnb License Requirements & STR Laws in Pessac (2025)
While Pessac, Nouvelle-Aquitaine, France currently shows low STR regulations, specific Airbnb license requirements might still exist or change. Always verify the latest short term rental regulations and Airbnb license requirements directly with local government authorities for Pessac to ensure full compliance before hosting.
(Source: AirROI data, 2025, based on 4% licensed listings)
Top Performing Airbnb Properties in Pessac (2025)
Benchmark your potential! Explore examples of top-performing Airbnb properties in Pessacbased on Trailing Twelve Month (TTM) revenue. Analyze their characteristics, revenue, occupancy rate, and ADR to understand what drives success in this market.

Villa with heated pool, Jacuzzi & sauna
Entire Place • 4 bedrooms
Villa Copincabana
Entire Place • 4 bedrooms
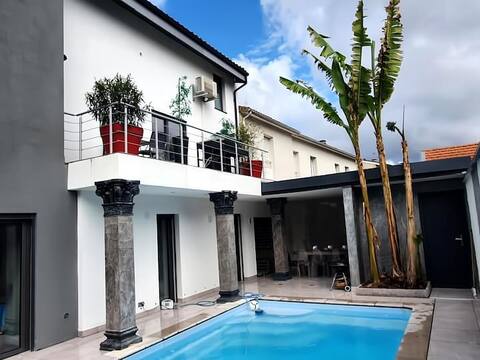
Beautiful architect house with pool
Entire Place • 6 bedrooms
Favorite house 200m2
Entire Place • 7 bedrooms

House and garden at Domaine Universitaire Pessac
Entire Place • 4 bedrooms

Ideal home for the holidays
Entire Place • 6 bedrooms
Note: Performance varies based on location, size, amenities, seasonality, and management quality. Data reflects the past 12 months.
Top Performing Airbnb Hosts in Pessac (2025)
Learn from the best! This table showcases top-performing Airbnb hosts in Pessac based on the number of properties managed and estimated total revenue over the past year. Analyze their scale and performance metrics.
| Host Name | Properties | Grossing Revenue | Stay Reviews | Avg Rating |
|---|---|---|---|---|
| Romain | 1 | $162,883 | 61 | 4.92/5.0 |
| Veronique | 1 | $89,490 | 21 | 5.00/5.0 |
| Naima | 1 | $73,705 | 110 | 4.44/5.0 |
| Charles | 1 | $69,245 | 102 | 4.71/5.0 |
| Florian | 2 | $66,106 | 621 | 4.84/5.0 |
| Vincent | 9 | $63,531 | 290 | 4.56/5.0 |
| Hontas | 1 | $62,001 | 10 | 4.80/5.0 |
| Nathalie | 4 | $60,900 | 476 | 4.90/5.0 |
| Ozcan | 5 | $57,017 | 234 | 4.76/5.0 |
| Aloy | 2 | $56,937 | 15 | 4.78/5.0 |
Analyzing the strategies of top hosts, such as their property selection, pricing, and guest communication, can offer valuable lessons for optimizing your own Airbnb operations in Pessac.
Dive Deeper: Advanced Pessac STR Market Data (2025)
Ready to unlock more insights? AirROI provides access to advanced metrics and comprehensive Airbnb data for Pessac. Explore detailed analytics beyond this report to refine your investment strategy, optimize pricing, and maximize your vacation rental profits.
Explore Advanced MetricsPessac Short-Term Rental Market Composition (2025): Property & Room Types
Room Type Distribution
Property Type Distribution
Market Composition Insights for Pessac
- The Pessac Airbnb market composition is heavily skewed towards Entire Home/Apt listings, which make up 73.8% of the 325 active rentals. This indicates strong guest preference for privacy and space.
- Looking at the property type distribution in Pessac, House properties are the most common (50.2%), reflecting the local real estate landscape.
- Houses represent a significant 50.2% portion, catering likely to families or larger groups.
- The presence of 11.1% Hotel/Boutique listings indicates integration with traditional hospitality.
- Smaller segments like others (combined 3.1%) offer potential for unique stay experiences.
Pessac Airbnb Room Capacity Analysis (2025): Bedroom Distribution
Distribution of Listings by Number of Bedrooms
Room Capacity Insights for Pessac
- The dominant room capacity in Pessac is 1 bedroom listings, making up 37.5% of the market. This suggests a strong demand for properties suitable for couples or solo travelers.
- Together, 1 bedroom and 3 bedrooms properties represent 50.1% of the active Airbnb listings in Pessac, indicating a high concentration in these sizes.
- A significant 21.8% of listings offer 3+ bedrooms, catering to larger groups and families seeking more space in Pessac.
Pessac Vacation Rental Guest Capacity Trends (2025)
Distribution of Listings by Guest Capacity
Guest Capacity Insights for Pessac
- The most common guest capacity trend in Pessac vacation rentals is listings accommodating 2 guests (32.9%). This suggests the primary traveler segment is likely couples or solo travelers.
- Properties designed for 2 guests and 4 guests dominate the Pessac STR market, accounting for 49.8% of listings.
- 19.6% of properties accommodate 6+ guests, serving the market segment for larger families or group travel in Pessac.
- On average, properties in Pessac are equipped to host 3.1 guests.
Pessac Airbnb Booking Patterns (2025): Available vs. Booked Days
Available Days Distribution
Booked Days Distribution
Booking Pattern Insights for Pessac
- The most common availability pattern in Pessac falls within the 271-366 days range, representing 38.2% of listings. This suggests many properties have significant open periods on their calendars.
- Approximately 66.8% of listings show high availability (181+ days open annually), indicating potential for increased bookings or specific owner usage patterns.
- For booked days, the 91-180 days range is most frequent in Pessac (27.7%), reflecting common guest stay durations or potential owner blocking patterns.
- A notable 34.5% of properties secure long booking periods (181+ days booked per year), highlighting successful long-term rental strategies or significant owner usage.
Pessac Airbnb Minimum Stay Requirements Analysis
Distribution of Listings by Minimum Night Requirement
1 Night
80 listings
27% of total
2 Nights
96 listings
32.4% of total
3 Nights
36 listings
12.2% of total
4-6 Nights
44 listings
14.9% of total
7-29 Nights
21 listings
7.1% of total
30+ Nights
19 listings
6.4% of total
Key Insights
- The most prevalent minimum stay requirement in Pessac is 2 Nights, adopted by 32.4% of listings. This highlights the market's preference for shorter, flexible bookings.
Recommendations
- Align with the market by considering a 2 Nights minimum stay, as 32.4% of Pessac hosts use this setting.
- If feasible, allowing 1-night stays, especially midweek or during low season, could capture last-minute bookings, as only 27% currently do.
- Explore offering discounts for stays of 30+ nights to attract the 6.4% of the market seeking extended stays.
- Adjust minimum nights based on seasonality – potentially shorter during low season and longer during peak demand periods in Pessac.
Pessac Airbnb Cancellation Policy Trends Analysis (2025)
Flexible
82 listings
29.6% of total
Moderate
102 listings
36.8% of total
Firm
36 listings
13% of total
Strict
57 listings
20.6% of total
Cancellation Policy Insights for Pessac
- The prevailing Airbnb cancellation policy trend in Pessac is Moderate, used by 36.8% of listings.
- There's a relatively balanced mix between guest-friendly (66.4%) and stricter (33.6%) policies, offering choices for different guest needs.
Recommendations for Hosts
- Consider adopting a Moderate policy to align with the 36.8% market standard in Pessac.
- Regularly review your cancellation policy against competitors and market demand shifts in Pessac.
Pessac STR Booking Lead Time Analysis (2025)
Average Booking Lead Time by Month
Booking Lead Time Insights for Pessac
- The overall average booking lead time for vacation rentals in Pessac is 46 days.
- Guests book furthest in advance for stays during June (average 71 days), likely coinciding with peak travel demand or local events.
- The shortest booking windows occur for stays in February (average 36 days), indicating more last-minute travel plans during this time.
- Seasonally, Summer (63 days avg.) sees the longest lead times, while Winter (37 days avg.) has the shortest, reflecting typical travel planning cycles.
Recommendations for Hosts
- Use the overall average lead time (46 days) as a baseline for your pricing and availability strategy in Pessac.
- For June stays, consider implementing length-of-stay discounts or slightly higher rates for bookings made less than 71 days out to capitalize on advance planning.
- Target marketing efforts for the Summer season well in advance (at least 63 days) to capture early planners.
- Monitor your own booking lead times against these Pessac averages to identify opportunities for dynamic pricing adjustments.
Popular & Essential Airbnb Amenities in Pessac (2025)
Amenity Prevalence
Amenity Insights for Pessac
- Essential amenities in Pessac that guests expect include: Heating. Lacking these (this) could significantly impact bookings.
- Popular amenities like Hot water, Wifi, Kitchen are common but not universal. Offering these can provide a competitive edge.
- Warning: Wifi is not universally provided but is considered essential globally. Ensure reliable Wifi is offered.
Recommendations for Hosts
- Ensure your listing includes all essential amenities for Pessac: Heating.
- Prioritize adding missing essentials: Heating.
- Consider adding popular differentiators like Hot water or Wifi to increase appeal.
- Highlight unique or less common amenities you offer (e.g., hot tub, dedicated workspace, EV charger) in your listing description and photos.
- Regularly check competitor amenities in Pessac to stay competitive.
Pessac Airbnb Guest Demographics & Profile Analysis (2025)
Guest Profile Summary for Pessac
- The typical guest profile for Airbnb in Pessac consists of primarily domestic travelers (80%), often arriving from nearby Paris, typically belonging to the Post-2000s (Gen Z/Alpha) group (50%), primarily speaking French or English.
- Domestic travelers account for 80.0% of guests.
- Key international markets include France (80%) and United Kingdom (3.3%).
- Top languages spoken are French (40.4%) followed by English (33.6%).
- A significant demographic segment is the Post-2000s (Gen Z/Alpha) group, representing 50% of guests.
Recommendations for Hosts
- Target domestic marketing efforts towards travelers from Paris and Bordeaux.
- Tailor amenities and listing descriptions to appeal to the dominant Post-2000s (Gen Z/Alpha) demographic (e.g., highlight fast WiFi, smart home features, local guides).
- Highlight unique local experiences or amenities relevant to the primary guest profile.
- Consider seasonal promotions aligned with peak travel times for key origin markets.
Nearby Short-Term Rental Market Comparison
How does the Pessac Airbnb market stack up against its neighbors? Compare key performance metrics like average monthly revenue, ADR, and occupancy rates in surrounding areas to understand the broader regional STR landscape.
| Market | Active Properties | Monthly Revenue | Daily Rate | Avg. Occupancy |
|---|---|---|---|---|
| San Sebastián | 1,426 | $3,546 | $262.81 | 49% |
| Saint-Laurent-des-Combes | 11 | $3,526 | $706.18 | 23% |
| Astaffort | 10 | $3,393 | $314.20 | 35% |
| Cénac | 18 | $2,773 | $268.58 | 53% |
| Cérons | 11 | $2,635 | $196.16 | 39% |
| Galgon | 12 | $2,599 | $210.34 | 48% |
| Hernani | 11 | $2,572 | $345.16 | 40% |
| Eynesse | 14 | $2,564 | $282.87 | 36% |
| Bourrou | 10 | $2,475 | $247.57 | 36% |
| Saint-Hippolyte | 10 | $2,443 | $204.98 | 44% |