Pau Airbnb Market Analysis 2025: Short Term Rental Data & Vacation Rental Statistics in Nouvelle-Aquitaine, France
Is Airbnb profitable in Pau in 2025? Explore comprehensive Airbnb analytics for Pau, Nouvelle-Aquitaine, France to uncover income potential. This 2025 STR market report for Pau, based on AirROI data from April 2024 to March 2025, reveals key trends in the market of 654 active listings.
Whether you're considering an Airbnb investment in Pau, optimizing your existing vacation rental, or exploring rental arbitrage opportunities, understanding the Pau Airbnb data is crucial. Leveraging the low regulation environment is key to maximizing your short term rental income potential. Let's dive into the specifics.
Key Pau Airbnb Performance Metrics Overview
Monthly Airbnb Revenue Variations & Income Potential in Pau (2025)
Understanding the monthly revenue variations for Airbnb listings in Pau is key to maximizing your short term rental income potential. Seasonality significantly impacts earnings. Our analysis, based on data from the past 12 months, shows that the peak revenue month for STRs in Pau is typically May, while March often presents the lowest earnings, highlighting opportunities for strategic pricing adjustments during shoulder and low seasons. Explore the typical Airbnb income in Pau across different performance tiers:
- Best-in-class properties (Top 10%) achieve $2,038+ monthly, often utilizing dynamic pricing and superior guest experiences.
- Strong performing properties (Top 25%) earn $1,409 or more, indicating effective management and desirable locations/amenities.
- Typical properties (Median) generate around $924 per month, representing the average market performance.
- Entry-level properties (Bottom 25%) see earnings around $506, often with potential for optimization.
Average Monthly Airbnb Earnings Trend in Pau
Pau Airbnb Occupancy Rate Trends (2025)
Maximize your bookings by understanding the Pau STR occupancy trends. Seasonal demand shifts significantly influence how often properties are booked. Typically, Augustsees the highest demand (peak season occupancy), while March experiences the lowest (low season). Effective strategies, like adjusting minimum stays or offering promotions, can boost occupancy during slower periods. Here's how different property tiers perform in Pau:
- Best-in-class properties (Top 10%) achieve 85%+ occupancy, indicating high desirability and potentially optimized availability.
- Strong performing properties (Top 25%) maintain 72% or higher occupancy, suggesting good market fit and guest satisfaction.
- Typical properties (Median) have an occupancy rate around 50%.
- Entry-level properties (Bottom 25%) average 27% occupancy, potentially facing higher vacancy.
Average Monthly Occupancy Rate Trend in Pau
Average Daily Rate (ADR) Airbnb Trends in Pau (2025)
Effective short term rental pricing strategy in Pau involves understanding monthly ADR fluctuations. The Average Daily Rate (ADR) for Airbnb in Pau typically peaks in July and dips lowest during March. Leveraging Airbnb dynamic pricing tools or strategies based on this seasonality can significantly boost revenue. Here's a look at the typical nightly rates achieved:
- Best-in-class properties (Top 10%) command rates of $108+ per night, often due to premium features or locations.
- Strong performing properties (Top 25%) achieve nightly rates of $77 or more.
- Typical properties (Median) charge around $55 per night.
- Entry-level properties (Bottom 25%) earn around $42 per night.
Average Daily Rate (ADR) Trend by Month in Pau
Get Live Pau Market Intelligence 👇

Explore Real-time Analytics
Airbnb Seasonality Analysis & Trends in Pau (2025)
Peak Season (May, April, August)
- Revenue averages $1,336 per month
- Occupancy rates average 52.7%
- Daily rates average $68
Shoulder Season
- Revenue averages $1,104 per month
- Occupancy maintains around 50.8%
- Daily rates hold near $68
Low Season (January, February, March)
- Revenue drops to average $812 per month
- Occupancy decreases to average 42.6%
- Daily rates adjust to average $65
Seasonality Insights for Pau
- The Airbnb seasonality in Pau shows moderate seasonality with distinct peak and low periods. While the sections above show seasonal averages, it's also insightful to look at the extremes:
- During the high season, the absolute peak month showcases Pau's highest earning potential, with monthly revenues capable of climbing to $1,368, occupancy reaching a high of 60.4%, and ADRs peaking at $70.
- Conversely, the slowest single month of the year, typically falling within the low season, marks the market's lowest point. In this month, revenue might dip to $744, occupancy could drop to 39.1%, and ADRs may adjust down to $65.
- Understanding both the seasonal averages and these monthly peaks and troughs in revenue, occupancy, and ADR is crucial for maximizing your Airbnb profit potential in Pau.
Seasonal Strategies for Maximizing Profit
- Peak Season: Maximize revenue through premium pricing and potentially longer minimum stays. Ensure high availability.
- Low Season: Offer competitive pricing, special promotions (e.g., extended stay discounts), and flexible cancellation policies. Target off-season travelers like remote workers or budget-conscious guests.
- Shoulder Seasons: Implement dynamic pricing that balances peak and low rates. Target weekend travelers or specific events. Offer slightly more flexible terms than peak season.
- Regularly analyze your own performance against these Pau seasonality benchmarks and adjust your pricing and availability strategy accordingly.
Best Areas for Airbnb Investment in Pau (2025)
Exploring the top neighborhoods for short-term rentals in Pau? This section highlights key areas, outlining why they are attractive for hosts and guests, along with notable local attractions. Consider these locations based on your target guest profile and investment strategy.
| Neighborhood / Area | Why Host Here? (Target Guests & Appeal) | Key Attractions & Landmarks |
|---|---|---|
| Pau City Centre | The heart of Pau, showcasing the Château de Pau and vibrant local culture. It's ideal for tourists wanting to explore historical sites and local cuisine. | Château de Pau, Boulevard des Pyrénées, Parc Beaumont, Funiculaire de Pau, Pau Museum of Fine Arts |
| Gaves Valley | A picturesque area ideal for outdoor enthusiasts, with stunning views of the Pyrenees. Perfect for those looking for nature and adventure activities. | Gorges de Kakuetta, Kayaking on the Gave River, Hiking trails, VTT biking, Scenic viewpoints |
| Billère | A charming suburb close to Pau city, known for its family-friendly atmosphere and proximity to parks and local amenities. | Parc de la Chênaie, Billère market, Cultural events, Local cafes, Community activities |
| Izaux | A quaint village providing a peaceful retreat while still being close to Pau, offering a taste of rural French life. | Countryside walks, Local vineyards, Rural markets, Traditional French cuisine, Community festivals |
| Lacq | Known for industrial heritage and nearby natural parks, this area appeals to both business travelers and nature lovers. | Lacq's industrial heritage sites, Nature parks, Walking trails, Local farms, Cultural tours |
| Artiguelouve | A suburban area popular with families and professionals, offering a mix of residential comfort and accessibility to Pau's amenities. | Local parks, Community events, Cafes and shops, Family activities, Cultural sites |
| Lescar | A historical town with medieval architecture, attracting visitors interested in history and local culture, also offers beautiful landscapes. | Lescar Cathedral, Historical old town, Scenic viewpoints, Local markets, Cultural heritage sites |
| Nay | A small town that gives access to both Pau and the Pyrénées, appealing to those looking for outdoor adventure and local culture. | Nay's historical sites, River Gave de Pau, Local festivals, Hiking routes, Charming village ambiance |
Understanding Airbnb License Requirements & STR Laws in Pau (2025)
While Pau, Nouvelle-Aquitaine, France currently shows low STR regulations, specific Airbnb license requirements might still exist or change. Always verify the latest short term rental regulations and Airbnb license requirements directly with local government authorities for Pau to ensure full compliance before hosting.
(Source: AirROI data, 2025, based on 3% licensed listings)
Top Performing Airbnb Properties in Pau (2025)
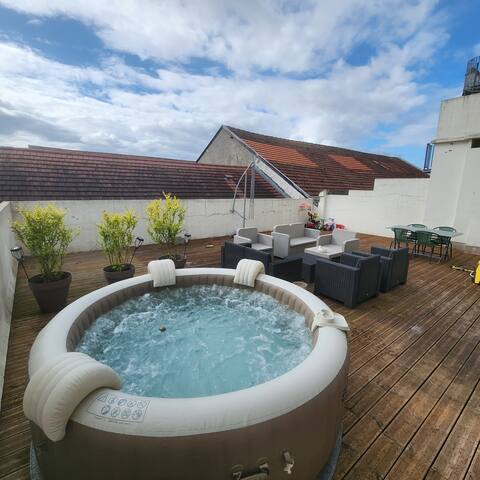
Benchmark your potential! Explore examples of top-performing Airbnb properties in Paubased on Trailing Twelve Month (TTM) revenue. Analyze their characteristics, revenue, occupancy rate, and ADR to understand what drives success in this market.

Hyper center accommodation 160m2
Entire Place • 3 bedrooms

Spacious Villa-Quartier Quiet-Free Parking
Entire Place • 8 bedrooms
Magnifique triplex centre, sauna, spa, billard
Entire Place • 6 bedrooms
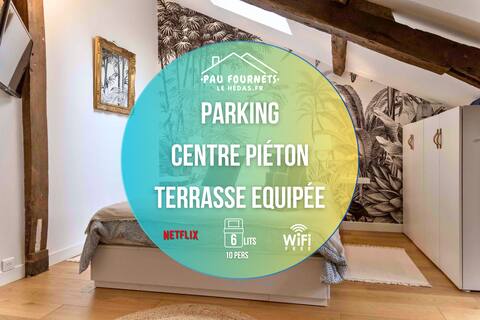
TOP-Maison&Apt-Hyper Centre-Parking-Terrasse-Calme
Entire Place • 5 bedrooms
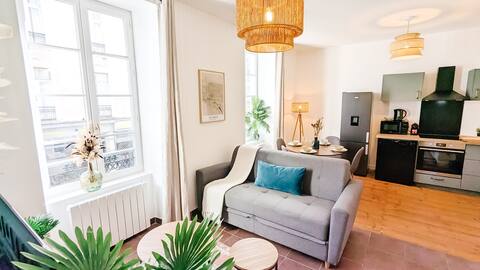
Perle & Calypso - Centre 4 Ch -10 pers-2 Parking
Entire Place • 4 bedrooms
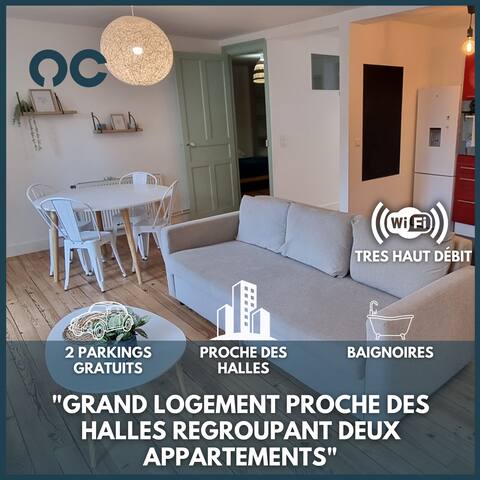
Large accommodation near Halles - 10 people- 2 parking lots
Entire Place • 4 bedrooms
Note: Performance varies based on location, size, amenities, seasonality, and management quality. Data reflects the past 12 months.
Top Performing Airbnb Hosts in Pau (2025)
Learn from the best! This table showcases top-performing Airbnb hosts in Pau based on the number of properties managed and estimated total revenue over the past year. Analyze their scale and performance metrics.
| Host Name | Properties | Grossing Revenue | Stay Reviews | Avg Rating |
|---|---|---|---|---|
| Yasmine | 24 | $497,634 | 547 | 4.17/5.0 |
| Benoît | 17 | $199,962 | 296 | 4.18/5.0 |
| Jérôme | 10 | $164,120 | 263 | 4.75/5.0 |
| Kévin | 15 | $159,771 | 633 | 4.72/5.0 |
| Benoît | 5 | $113,636 | 963 | 4.87/5.0 |
| Pierre-Antoine | 3 | $108,154 | 265 | 4.85/5.0 |
| Jean-Baptiste | 6 | $102,031 | 387 | 4.94/5.0 |
| Myra | 8 | $92,450 | 129 | 3.93/5.0 |
| Mikael | 2 | $87,624 | 132 | 4.65/5.0 |
| Yan | 7 | $85,841 | 511 | 4.86/5.0 |
Analyzing the strategies of top hosts, such as their property selection, pricing, and guest communication, can offer valuable lessons for optimizing your own Airbnb operations in Pau.
Dive Deeper: Advanced Pau STR Market Data (2025)
Ready to unlock more insights? AirROI provides access to advanced metrics and comprehensive Airbnb data for Pau. Explore detailed analytics beyond this report to refine your investment strategy, optimize pricing, and maximize your vacation rental profits.
Explore Advanced MetricsPau Short-Term Rental Market Composition (2025): Property & Room Types
Room Type Distribution
Property Type Distribution
Market Composition Insights for Pau
- The Pau Airbnb market composition is heavily skewed towards Entire Home/Apt listings, which make up 87.3% of the 654 active rentals. This indicates strong guest preference for privacy and space.
- Looking at the property type distribution in Pau, Apartment/Condo properties are the most common (87.6%), reflecting the local real estate landscape.
- Smaller segments like hotel/boutique, others, unique stays (combined 3.6%) offer potential for unique stay experiences.
Pau Airbnb Room Capacity Analysis (2025): Bedroom Distribution
Distribution of Listings by Number of Bedrooms
Room Capacity Insights for Pau
- The dominant room capacity in Pau is 1 bedroom listings, making up 52.3% of the market. This suggests a strong demand for properties suitable for couples or solo travelers.
- Together, 1 bedroom and 2 bedrooms properties represent 69.0% of the active Airbnb listings in Pau, indicating a high concentration in these sizes.
- With over half the market (52.3%) consisting of studios or 1-bedroom units, Pau is particularly well-suited for individuals or couples.
Pau Vacation Rental Guest Capacity Trends (2025)
Distribution of Listings by Guest Capacity
Guest Capacity Insights for Pau
- The most common guest capacity trend in Pau vacation rentals is listings accommodating 2 guests (41.3%). This suggests the primary traveler segment is likely couples or solo travelers.
- Properties designed for 2 guests and 4 guests dominate the Pau STR market, accounting for 67.1% of listings.
- A significant 43.6% of listings cater specifically to 1-2 guests, highlighting strong demand from couples and solo travelers in Pau.
- 15.1% of properties accommodate 6+ guests, serving the market segment for larger families or group travel in Pau.
- On average, properties in Pau are equipped to host 3.2 guests.
Pau Airbnb Booking Patterns (2025): Available vs. Booked Days
Available Days Distribution
Booked Days Distribution
Booking Pattern Insights for Pau
- The most common availability pattern in Pau falls within the 181-270 days range, representing 32.9% of listings. This suggests many properties have significant open periods on their calendars.
- Approximately 62.7% of listings show high availability (181+ days open annually), indicating potential for increased bookings or specific owner usage patterns.
- For booked days, the 91-180 days range is most frequent in Pau (33.2%), reflecting common guest stay durations or potential owner blocking patterns.
- A notable 38.4% of properties secure long booking periods (181+ days booked per year), highlighting successful long-term rental strategies or significant owner usage.
Pau Airbnb Minimum Stay Requirements Analysis
Distribution of Listings by Minimum Night Requirement
1 Night
175 listings
29.4% of total
2 Nights
209 listings
35.1% of total
3 Nights
46 listings
7.7% of total
4-6 Nights
36 listings
6% of total
7-29 Nights
11 listings
1.8% of total
30+ Nights
119 listings
20% of total
Key Insights
- The most prevalent minimum stay requirement in Pau is 2 Nights, adopted by 35.1% of listings. This highlights the market's preference for shorter, flexible bookings.
- A strong majority (64.5%) of the Pau Airbnb data shows acceptance of very short stays (1-2 nights), indicating a dynamic, high-turnover market.
- A significant segment (20%) caters to monthly stays (30+ nights) in Pau, pointing to opportunities in the extended-stay market.
Recommendations
- Align with the market by considering a 2 Nights minimum stay, as 35.1% of Pau hosts use this setting.
- If feasible, allowing 1-night stays, especially midweek or during low season, could capture last-minute bookings, as only 29.4% currently do.
- Explore offering discounts for stays of 30+ nights to attract the 20% of the market seeking extended stays.
- Adjust minimum nights based on seasonality – potentially shorter during low season and longer during peak demand periods in Pau.
Pau Airbnb Cancellation Policy Trends Analysis (2025)
Flexible
240 listings
42% of total
Moderate
240 listings
42% of total
Firm
41 listings
7.2% of total
Strict
51 listings
8.9% of total
Cancellation Policy Insights for Pau
- The prevailing Airbnb cancellation policy trend in Pau is Flexible, used by 42% of listings.
- The market strongly favors guest-friendly terms, with 84.0% of listings offering Flexible or Moderate policies. This suggests guests in Pau may expect booking flexibility.
- Strict cancellation policies are quite rare (8.9%), potentially making listings with this policy less competitive unless justified by high demand or property type.
Recommendations for Hosts
- Consider adopting a Flexible policy to align with the 42% market standard in Pau.
- Using a Strict policy might deter some guests, as only 8.9% of listings use it. Evaluate if potential revenue protection outweighs possible lower booking rates.
- Regularly review your cancellation policy against competitors and market demand shifts in Pau.
Pau STR Booking Lead Time Analysis (2025)
Average Booking Lead Time by Month
Booking Lead Time Insights for Pau
- The overall average booking lead time for vacation rentals in Pau is 37 days.
- Guests book furthest in advance for stays during July (average 63 days), likely coinciding with peak travel demand or local events.
- The shortest booking windows occur for stays in March (average 31 days), indicating more last-minute travel plans during this time.
- Seasonally, Summer (52 days avg.) sees the longest lead times, while Winter (34 days avg.) has the shortest, reflecting typical travel planning cycles.
Recommendations for Hosts
- Use the overall average lead time (37 days) as a baseline for your pricing and availability strategy in Pau.
- For July stays, consider implementing length-of-stay discounts or slightly higher rates for bookings made less than 63 days out to capitalize on advance planning.
- Target marketing efforts for the Summer season well in advance (at least 52 days) to capture early planners.
- Monitor your own booking lead times against these Pau averages to identify opportunities for dynamic pricing adjustments.
Popular & Essential Airbnb Amenities in Pau (2025)
Amenity Prevalence
Amenity Insights for Pau
- Essential amenities in Pau that guests expect include: Kitchen, Heating. Lacking these (any) could significantly impact bookings.
- Popular amenities like Wifi, Hot water, TV are common but not universal. Offering these can provide a competitive edge.
- Warning: Wifi is not universally provided but is considered essential globally. Ensure reliable Wifi is offered.
Recommendations for Hosts
- Ensure your listing includes all essential amenities for Pau: Kitchen, Heating.
- Prioritize adding missing essentials: Kitchen, Heating.
- Consider adding popular differentiators like Wifi or Hot water to increase appeal.
- Highlight unique or less common amenities you offer (e.g., hot tub, dedicated workspace, EV charger) in your listing description and photos.
- Regularly check competitor amenities in Pau to stay competitive.
Pau Airbnb Guest Demographics & Profile Analysis (2025)
Guest Profile Summary for Pau
- The typical guest profile for Airbnb in Pau consists of primarily domestic travelers (77%), often arriving from nearby Paris, typically belonging to the Post-2000s (Gen Z/Alpha) group (50%), primarily speaking French or English.
- Domestic travelers account for 77.1% of guests.
- Key international markets include France (77.1%) and Spain (7.7%).
- Top languages spoken are French (39.6%) followed by English (32%).
- A significant demographic segment is the Post-2000s (Gen Z/Alpha) group, representing 50% of guests.
Recommendations for Hosts
- Target domestic marketing efforts towards travelers from Paris and Pau.
- Tailor amenities and listing descriptions to appeal to the dominant Post-2000s (Gen Z/Alpha) demographic (e.g., highlight fast WiFi, smart home features, local guides).
- Highlight unique local experiences or amenities relevant to the primary guest profile.
- Consider seasonal promotions aligned with peak travel times for key origin markets.
Nearby Short-Term Rental Market Comparison
How does the Pau Airbnb market stack up against its neighbors? Compare key performance metrics like average monthly revenue, ADR, and occupancy rates in surrounding areas to understand the broader regional STR landscape.
| Market | Active Properties | Monthly Revenue | Daily Rate | Avg. Occupancy |
|---|---|---|---|---|
| San Sebastián | 1,426 | $3,546 | $262.81 | 49% |
| Saint-Laurent-des-Combes | 11 | $3,526 | $706.18 | 23% |
| Astaffort | 10 | $3,393 | $314.20 | 35% |
| Cénac | 18 | $2,773 | $268.58 | 53% |
| Cérons | 11 | $2,635 | $196.16 | 39% |
| Galgon | 12 | $2,599 | $210.34 | 48% |
| Esteribar | 20 | $2,574 | $276.81 | 32% |
| Hernani | 11 | $2,572 | $345.16 | 40% |
| Eynesse | 14 | $2,564 | $282.87 | 36% |
| Azet | 13 | $2,500 | $245.55 | 43% |