Mios Airbnb Market Analysis 2025: Short Term Rental Data & Vacation Rental Statistics in Nouvelle-Aquitaine, France
Is Airbnb profitable in Mios in 2025? Explore comprehensive Airbnb analytics for Mios, Nouvelle-Aquitaine, France to uncover income potential. This 2025 STR market report for Mios, based on AirROI data from April 2024 to March 2025, reveals key trends in the niche market of 139 active listings.
Whether you're considering an Airbnb investment in Mios, optimizing your existing vacation rental, or exploring rental arbitrage opportunities, understanding the Mios Airbnb data is crucial. Navigating the high regulation landscape is key to maximizing your short term rental income potential. Let's dive into the specifics.
Key Mios Airbnb Performance Metrics Overview
Monthly Airbnb Revenue Variations & Income Potential in Mios (2025)
Understanding the monthly revenue variations for Airbnb listings in Mios is key to maximizing your short term rental income potential. Seasonality significantly impacts earnings. Our analysis, based on data from the past 12 months, shows that the peak revenue month for STRs in Mios is typically August, while January often presents the lowest earnings, highlighting opportunities for strategic pricing adjustments during shoulder and low seasons. Explore the typical Airbnb income in Mios across different performance tiers:
- Best-in-class properties (Top 10%) achieve $3,948+ monthly, often utilizing dynamic pricing and superior guest experiences.
- Strong performing properties (Top 25%) earn $2,300 or more, indicating effective management and desirable locations/amenities.
- Typical properties (Median) generate around $1,225 per month, representing the average market performance.
- Entry-level properties (Bottom 25%) see earnings around $611, often with potential for optimization.
Average Monthly Airbnb Earnings Trend in Mios
Mios Airbnb Occupancy Rate Trends (2025)
Maximize your bookings by understanding the Mios STR occupancy trends. Seasonal demand shifts significantly influence how often properties are booked. Typically, Augustsees the highest demand (peak season occupancy), while January experiences the lowest (low season). Effective strategies, like adjusting minimum stays or offering promotions, can boost occupancy during slower periods. Here's how different property tiers perform in Mios:
- Best-in-class properties (Top 10%) achieve 74%+ occupancy, indicating high desirability and potentially optimized availability.
- Strong performing properties (Top 25%) maintain 60% or higher occupancy, suggesting good market fit and guest satisfaction.
- Typical properties (Median) have an occupancy rate around 39%.
- Entry-level properties (Bottom 25%) average 19% occupancy, potentially facing higher vacancy.
Average Monthly Occupancy Rate Trend in Mios
Average Daily Rate (ADR) Airbnb Trends in Mios (2025)
Effective short term rental pricing strategy in Mios involves understanding monthly ADR fluctuations. The Average Daily Rate (ADR) for Airbnb in Mios typically peaks in July and dips lowest during March. Leveraging Airbnb dynamic pricing tools or strategies based on this seasonality can significantly boost revenue. Here's a look at the typical nightly rates achieved:
- Best-in-class properties (Top 10%) command rates of $305+ per night, often due to premium features or locations.
- Strong performing properties (Top 25%) achieve nightly rates of $207 or more.
- Typical properties (Median) charge around $108 per night.
- Entry-level properties (Bottom 25%) earn around $72 per night.
Average Daily Rate (ADR) Trend by Month in Mios
Get Live Mios Market Intelligence 👇

Explore Real-time Analytics
Airbnb Seasonality Analysis & Trends in Mios (2025)
Peak Season (August, July, June)
- Revenue averages $3,098 per month
- Occupancy rates average 57.3%
- Daily rates average $164
Shoulder Season
- Revenue averages $1,562 per month
- Occupancy maintains around 37.2%
- Daily rates hold near $154
Low Season (January, February, March)
- Revenue drops to average $819 per month
- Occupancy decreases to average 28.6%
- Daily rates adjust to average $143
Seasonality Insights for Mios
- The Airbnb seasonality in Mios shows highly seasonal trends requiring careful strategy. While the sections above show seasonal averages, it's also insightful to look at the extremes:
- During the high season, the absolute peak month showcases Mios's highest earning potential, with monthly revenues capable of climbing to $3,840, occupancy reaching a high of 73.9%, and ADRs peaking at $165.
- Conversely, the slowest single month of the year, typically falling within the low season, marks the market's lowest point. In this month, revenue might dip to $700, occupancy could drop to 25.2%, and ADRs may adjust down to $142.
- Understanding both the seasonal averages and these monthly peaks and troughs in revenue, occupancy, and ADR is crucial for maximizing your Airbnb profit potential in Mios.
Seasonal Strategies for Maximizing Profit
- Peak Season: Maximize revenue through premium pricing and potentially longer minimum stays. Ensure high availability.
- Low Season: Offer competitive pricing, special promotions (e.g., extended stay discounts), and flexible cancellation policies. Target off-season travelers like remote workers or budget-conscious guests.
- Shoulder Seasons: Implement dynamic pricing that balances peak and low rates. Target weekend travelers or specific events. Offer slightly more flexible terms than peak season.
- Regularly analyze your own performance against these Mios seasonality benchmarks and adjust your pricing and availability strategy accordingly.
Best Areas for Airbnb Investment in Mios (2025)
Exploring the top neighborhoods for short-term rentals in Mios? This section highlights key areas, outlining why they are attractive for hosts and guests, along with notable local attractions. Consider these locations based on your target guest profile and investment strategy.
| Neighborhood / Area | Why Host Here? (Target Guests & Appeal) | Key Attractions & Landmarks |
|---|---|---|
| Centre-ville de Mios | The heart of Mios, featuring charming streets and close proximity to local shops and restaurants. Ideal for guests looking for a relaxing stay with easy access to amenities. | Église Saint-Maurice, Restaurants locaux, Marché de Mios, Événements culturels locaux |
| Mios Lakes | A picturesque area surrounded by lakes, perfect for nature lovers and those seeking tranquility. Popular for outdoor activities like fishing and hiking. | Lac de Mios, Sentiers de randonnée, Activités nautiques, Espaces de pique-nique |
| La Brède | A vibrant suburb known for its historic chateau and lush vineyards. A great choice for wine enthusiasts and those exploring the local culture. | Château de La Brède, Vignobles locaux, Marché artisanal, Parcs et jardins |
| Arcachon Bay | Nearby coastal region famous for its stunning bay and beaches, attracting beachgoers and tourists seeking a seaside getaway. | Plages d'Arcachon, Dune du Pilat, Croisières dans la baie, Restaurants de fruits de mer |
| Bordeaux | The nearby city provides a bustling urban atmosphere with rich history and wine culture, ideal for travelers looking for city experiences combined with day trips. | Place de la Bourse, Cité du Vin, Quartier des Chartrons, Jardin Public |
| Le Teich | A charming nearby town known for its nature reserves and bird watching opportunities, appealing to eco-tourists and nature enthusiasts. | Parc Ornithologique du Teich, Sentiers nature, Lac du Teich, Activités en plein air |
| Lège-Cap-Ferret | A beautiful area known for its beaches and natural environment, popular for travelers seeking relaxation and outdoor activities. | Plages de Lège-Cap-Ferret, Réserve Naturelle des Prés Salés, Cyclisme et randonnée |
| Sanguinet | A quiet area with a lovely lake, ideal for families and those wanting a peaceful escape close to nature. | Lac de Sanguinet, Activités nautiques, Randonnées, Espaces de détente |
Understanding Airbnb License Requirements & STR Laws in Mios (2025)
Yes, Mios, Nouvelle-Aquitaine, France enforces high STR regulations. Obtaining a license and ensuring compliance is almost certainly required according to current 2025 STR laws. Always verify the latest short term rental regulations and Airbnb license requirements directly with local government authorities for Mios to ensure full compliance before hosting.
(Source: AirROI data, 2025, based on 66% licensed listings)
Top Performing Airbnb Properties in Mios (2025)
Benchmark your potential! Explore examples of top-performing Airbnb properties in Miosbased on Trailing Twelve Month (TTM) revenue. Analyze their characteristics, revenue, occupancy rate, and ADR to understand what drives success in this market.
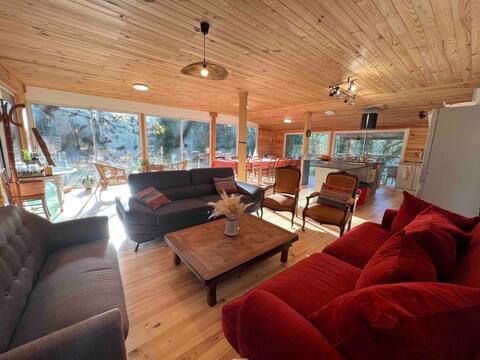
The Pas de l 'âne group cottage
Entire Place • 6 bedrooms
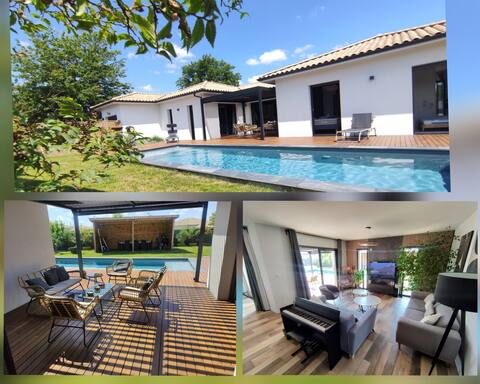
Pretty Villa with Pool Bassin d 'Arcachon
Entire Place • 4 bedrooms
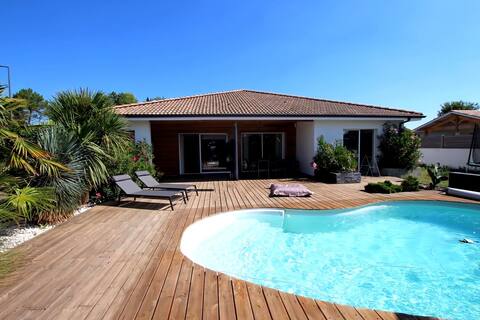
Beautiful villa with pool, outdoor kitchen
Entire Place • 5 bedrooms
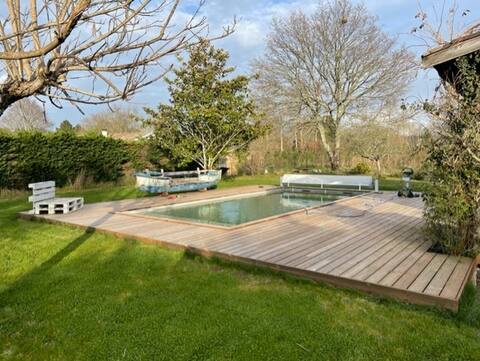
Villa heart of the pool_Heated pool and pétanque
Entire Place • 4 bedrooms
Spacious family home with a pool
Entire Place • 4 bedrooms

Pool and nature hot tub on Arcachon basin
Entire Place • 4 bedrooms
Note: Performance varies based on location, size, amenities, seasonality, and management quality. Data reflects the past 12 months.
Top Performing Airbnb Hosts in Mios (2025)
Learn from the best! This table showcases top-performing Airbnb hosts in Mios based on the number of properties managed and estimated total revenue over the past year. Analyze their scale and performance metrics.
| Host Name | Properties | Grossing Revenue | Stay Reviews | Avg Rating |
|---|---|---|---|---|
| Celia | 5 | $93,185 | 76 | 4.84/5.0 |
| Ornella | 1 | $58,716 | 16 | 5.00/5.0 |
| Anna | 2 | $55,447 | 26 | 4.96/5.0 |
| Jerome | 1 | $50,712 | 10 | 4.50/5.0 |
| Christophe | 1 | $48,280 | 11 | 4.91/5.0 |
| Frenchy | 1 | $45,577 | 57 | 4.56/5.0 |
| Aurore | 1 | $43,868 | 11 | 5.00/5.0 |
| Matthieu | 1 | $40,295 | 11 | 4.45/5.0 |
| Magali | 1 | $32,634 | 16 | 4.94/5.0 |
| Julie | 1 | $30,889 | 8 | 4.88/5.0 |
Analyzing the strategies of top hosts, such as their property selection, pricing, and guest communication, can offer valuable lessons for optimizing your own Airbnb operations in Mios.
Dive Deeper: Advanced Mios STR Market Data (2025)
Ready to unlock more insights? AirROI provides access to advanced metrics and comprehensive Airbnb data for Mios. Explore detailed analytics beyond this report to refine your investment strategy, optimize pricing, and maximize your vacation rental profits.
Explore Advanced MetricsMios Short-Term Rental Market Composition (2025): Property & Room Types
Room Type Distribution
Property Type Distribution
Market Composition Insights for Mios
- The Mios Airbnb market composition is heavily skewed towards Entire Home/Apt listings, which make up 82% of the 139 active rentals. This indicates strong guest preference for privacy and space.
- Looking at the property type distribution in Mios, House properties are the most common (71.9%), reflecting the local real estate landscape.
- Houses represent a significant 71.9% portion, catering likely to families or larger groups.
- The presence of 7.2% Hotel/Boutique listings indicates integration with traditional hospitality.
- Smaller segments like unique stays, outdoor/unique (combined 4.3%) offer potential for unique stay experiences.
Mios Airbnb Room Capacity Analysis (2025): Bedroom Distribution
Distribution of Listings by Number of Bedrooms
Room Capacity Insights for Mios
- The dominant room capacity in Mios is 1 bedroom listings, making up 32.4% of the market. This suggests a strong demand for properties suitable for couples or solo travelers.
- Together, 1 bedroom and 3 bedrooms properties represent 58.3% of the active Airbnb listings in Mios, indicating a high concentration in these sizes.
- A significant 42.4% of listings offer 3+ bedrooms, catering to larger groups and families seeking more space in Mios.
Mios Vacation Rental Guest Capacity Trends (2025)
Distribution of Listings by Guest Capacity
Guest Capacity Insights for Mios
- The most common guest capacity trend in Mios vacation rentals is listings accommodating 2 guests (23.7%). This suggests the primary traveler segment is likely couples or solo travelers.
- Properties designed for 2 guests and 6 guests dominate the Mios STR market, accounting for 44.6% of listings.
- 44.0% of properties accommodate 6+ guests, serving the market segment for larger families or group travel in Mios.
- On average, properties in Mios are equipped to host 4.5 guests.
Mios Airbnb Booking Patterns (2025): Available vs. Booked Days
Available Days Distribution
Booked Days Distribution
Booking Pattern Insights for Mios
- The most common availability pattern in Mios falls within the 271-366 days range, representing 48.9% of listings. This suggests many properties have significant open periods on their calendars.
- Approximately 86.3% of listings show high availability (181+ days open annually), indicating potential for increased bookings or specific owner usage patterns.
- For booked days, the 91-180 days range is most frequent in Mios (40.3%), reflecting common guest stay durations or potential owner blocking patterns.
- A notable 15.1% of properties secure long booking periods (181+ days booked per year), highlighting successful long-term rental strategies or significant owner usage.
Mios Airbnb Minimum Stay Requirements Analysis
Distribution of Listings by Minimum Night Requirement
1 Night
29 listings
22% of total
2 Nights
30 listings
22.7% of total
3 Nights
13 listings
9.8% of total
4-6 Nights
20 listings
15.2% of total
7-29 Nights
18 listings
13.6% of total
30+ Nights
22 listings
16.7% of total
Key Insights
- The most prevalent minimum stay requirement in Mios is 2 Nights, adopted by 22.7% of listings. This highlights the market's preference for shorter, flexible bookings.
- A significant segment (16.7%) caters to monthly stays (30+ nights) in Mios, pointing to opportunities in the extended-stay market.
Recommendations
- Align with the market by considering a 2 Nights minimum stay, as 22.7% of Mios hosts use this setting.
- If feasible, allowing 1-night stays, especially midweek or during low season, could capture last-minute bookings, as only 22% currently do.
- Explore offering discounts for stays of 30+ nights to attract the 16.7% of the market seeking extended stays.
- Adjust minimum nights based on seasonality – potentially shorter during low season and longer during peak demand periods in Mios.
Mios Airbnb Cancellation Policy Trends Analysis (2025)
Super Strict 60 Days
1 listings
0.8% of total
Flexible
18 listings
14.6% of total
Moderate
48 listings
39% of total
Firm
23 listings
18.7% of total
Strict
33 listings
26.8% of total
Cancellation Policy Insights for Mios
- The prevailing Airbnb cancellation policy trend in Mios is Moderate, used by 39% of listings.
- There's a relatively balanced mix between guest-friendly (53.6%) and stricter (45.5%) policies, offering choices for different guest needs.
Recommendations for Hosts
- Consider adopting a Moderate policy to align with the 39% market standard in Mios.
- Regularly review your cancellation policy against competitors and market demand shifts in Mios.
Mios STR Booking Lead Time Analysis (2025)
Average Booking Lead Time by Month
Booking Lead Time Insights for Mios
- The overall average booking lead time for vacation rentals in Mios is 60 days.
- Guests book furthest in advance for stays during June (average 96 days), likely coinciding with peak travel demand or local events.
- The shortest booking windows occur for stays in November (average 31 days), indicating more last-minute travel plans during this time.
- Seasonally, Summer (87 days avg.) sees the longest lead times, while Winter (42 days avg.) has the shortest, reflecting typical travel planning cycles.
Recommendations for Hosts
- Use the overall average lead time (60 days) as a baseline for your pricing and availability strategy in Mios.
- For June stays, consider implementing length-of-stay discounts or slightly higher rates for bookings made less than 96 days out to capitalize on advance planning.
- Target marketing efforts for the Summer season well in advance (at least 87 days) to capture early planners.
- Monitor your own booking lead times against these Mios averages to identify opportunities for dynamic pricing adjustments.
Popular & Essential Airbnb Amenities in Mios (2025)
Amenity Prevalence
Amenity Insights for Mios
- Essential amenities in Mios that guests expect include: Free parking on premises. Lacking these (this) could significantly impact bookings.
- Popular amenities like Hot water, Kitchen, Heating are common but not universal. Offering these can provide a competitive edge.
- Warning: Wifi is not universally provided but is considered essential globally. Ensure reliable Wifi is offered.
Recommendations for Hosts
- Ensure your listing includes all essential amenities for Mios: Free parking on premises.
- Prioritize adding missing essentials: Free parking on premises.
- Consider adding popular differentiators like Hot water or Kitchen to increase appeal.
- Highlight unique or less common amenities you offer (e.g., hot tub, dedicated workspace, EV charger) in your listing description and photos.
- Regularly check competitor amenities in Mios to stay competitive.
Mios Airbnb Guest Demographics & Profile Analysis (2025)
Guest Profile Summary for Mios
- The typical guest profile for Airbnb in Mios consists of primarily domestic travelers (87%), often arriving from nearby Paris, typically belonging to the Post-2000s (Gen Z/Alpha) group (50%), primarily speaking French or English.
- Domestic travelers account for 87.2% of guests.
- Key international markets include France (87.2%) and Spain (2.8%).
- Top languages spoken are French (48.1%) followed by English (28.7%).
- A significant demographic segment is the Post-2000s (Gen Z/Alpha) group, representing 50% of guests.
Recommendations for Hosts
- Target domestic marketing efforts towards travelers from Paris and Bordeaux.
- Tailor amenities and listing descriptions to appeal to the dominant Post-2000s (Gen Z/Alpha) demographic (e.g., highlight fast WiFi, smart home features, local guides).
- Highlight unique local experiences or amenities relevant to the primary guest profile.
- Consider seasonal promotions aligned with peak travel times for key origin markets.
Nearby Short-Term Rental Market Comparison
How does the Mios Airbnb market stack up against its neighbors? Compare key performance metrics like average monthly revenue, ADR, and occupancy rates in surrounding areas to understand the broader regional STR landscape.
| Market | Active Properties | Monthly Revenue | Daily Rate | Avg. Occupancy |
|---|---|---|---|---|
| San Sebastián | 1,426 | $3,546 | $262.81 | 49% |
| Saint-Laurent-des-Combes | 11 | $3,526 | $706.18 | 23% |
| Astaffort | 10 | $3,393 | $314.20 | 35% |
| Cénac | 18 | $2,773 | $268.58 | 53% |
| Cérons | 11 | $2,635 | $196.16 | 39% |
| Galgon | 12 | $2,599 | $210.34 | 48% |
| Hernani | 11 | $2,572 | $345.16 | 40% |
| Eynesse | 14 | $2,564 | $282.87 | 36% |
| Bourrou | 10 | $2,475 | $247.57 | 36% |
| Saint-Hippolyte | 10 | $2,443 | $204.98 | 44% |