Marmande Airbnb Market Analysis 2025: Short Term Rental Data & Vacation Rental Statistics in Nouvelle-Aquitaine, France
Is Airbnb profitable in Marmande in 2025? Explore comprehensive Airbnb analytics for Marmande, Nouvelle-Aquitaine, France to uncover income potential. This 2025 STR market report for Marmande, based on AirROI data from April 2024 to March 2025, reveals key trends in the niche market of 108 active listings.
Whether you're considering an Airbnb investment in Marmande, optimizing your existing vacation rental, or exploring rental arbitrage opportunities, understanding the Marmande Airbnb data is crucial. Leveraging the low regulation environment is key to maximizing your short term rental income potential. Let's dive into the specifics.
Key Marmande Airbnb Performance Metrics Overview
Monthly Airbnb Revenue Variations & Income Potential in Marmande (2025)
Understanding the monthly revenue variations for Airbnb listings in Marmande is key to maximizing your short term rental income potential. Seasonality significantly impacts earnings. Our analysis, based on data from the past 12 months, shows that the peak revenue month for STRs in Marmande is typically August, while March often presents the lowest earnings, highlighting opportunities for strategic pricing adjustments during shoulder and low seasons. Explore the typical Airbnb income in Marmande across different performance tiers:
- Best-in-class properties (Top 10%) achieve $1,976+ monthly, often utilizing dynamic pricing and superior guest experiences.
- Strong performing properties (Top 25%) earn $1,289 or more, indicating effective management and desirable locations/amenities.
- Typical properties (Median) generate around $796 per month, representing the average market performance.
- Entry-level properties (Bottom 25%) see earnings around $389, often with potential for optimization.
Average Monthly Airbnb Earnings Trend in Marmande
Marmande Airbnb Occupancy Rate Trends (2025)
Maximize your bookings by understanding the Marmande STR occupancy trends. Seasonal demand shifts significantly influence how often properties are booked. Typically, Augustsees the highest demand (peak season occupancy), while October experiences the lowest (low season). Effective strategies, like adjusting minimum stays or offering promotions, can boost occupancy during slower periods. Here's how different property tiers perform in Marmande:
- Best-in-class properties (Top 10%) achieve 73%+ occupancy, indicating high desirability and potentially optimized availability.
- Strong performing properties (Top 25%) maintain 53% or higher occupancy, suggesting good market fit and guest satisfaction.
- Typical properties (Median) have an occupancy rate around 33%.
- Entry-level properties (Bottom 25%) average 19% occupancy, potentially facing higher vacancy.
Average Monthly Occupancy Rate Trend in Marmande
Average Daily Rate (ADR) Airbnb Trends in Marmande (2025)
Effective short term rental pricing strategy in Marmande involves understanding monthly ADR fluctuations. The Average Daily Rate (ADR) for Airbnb in Marmande typically peaks in July and dips lowest during February. Leveraging Airbnb dynamic pricing tools or strategies based on this seasonality can significantly boost revenue. Here's a look at the typical nightly rates achieved:
- Best-in-class properties (Top 10%) command rates of $151+ per night, often due to premium features or locations.
- Strong performing properties (Top 25%) achieve nightly rates of $96 or more.
- Typical properties (Median) charge around $63 per night.
- Entry-level properties (Bottom 25%) earn around $45 per night.
Average Daily Rate (ADR) Trend by Month in Marmande
Get Live Marmande Market Intelligence 👇

Explore Real-time Analytics
Airbnb Seasonality Analysis & Trends in Marmande (2025)
Peak Season (August, May, June)
- Revenue averages $1,356 per month
- Occupancy rates average 42.9%
- Daily rates average $85
Shoulder Season
- Revenue averages $1,021 per month
- Occupancy maintains around 37.1%
- Daily rates hold near $82
Low Season (February, March, October)
- Revenue drops to average $785 per month
- Occupancy decreases to average 32.8%
- Daily rates adjust to average $80
Seasonality Insights for Marmande
- The Airbnb seasonality in Marmande shows moderate seasonality with distinct peak and low periods. While the sections above show seasonal averages, it's also insightful to look at the extremes:
- During the high season, the absolute peak month showcases Marmande's highest earning potential, with monthly revenues capable of climbing to $1,406, occupancy reaching a high of 51.1%, and ADRs peaking at $85.
- Conversely, the slowest single month of the year, typically falling within the low season, marks the market's lowest point. In this month, revenue might dip to $747, occupancy could drop to 31.5%, and ADRs may adjust down to $78.
- Understanding both the seasonal averages and these monthly peaks and troughs in revenue, occupancy, and ADR is crucial for maximizing your Airbnb profit potential in Marmande.
Seasonal Strategies for Maximizing Profit
- Peak Season: Maximize revenue through premium pricing and potentially longer minimum stays. Ensure high availability.
- Low Season: Offer competitive pricing, special promotions (e.g., extended stay discounts), and flexible cancellation policies. Target off-season travelers like remote workers or budget-conscious guests.
- Shoulder Seasons: Implement dynamic pricing that balances peak and low rates. Target weekend travelers or specific events. Offer slightly more flexible terms than peak season.
- Regularly analyze your own performance against these Marmande seasonality benchmarks and adjust your pricing and availability strategy accordingly.
Best Areas for Airbnb Investment in Marmande (2025)
Exploring the top neighborhoods for short-term rentals in Marmande? This section highlights key areas, outlining why they are attractive for hosts and guests, along with notable local attractions. Consider these locations based on your target guest profile and investment strategy.
| Neighborhood / Area | Why Host Here? (Target Guests & Appeal) | Key Attractions & Landmarks |
|---|---|---|
| Centre Ville | Marmande’s city center is lively and vibrant, ideal for those who want to experience local culture, dining, and shopping. It attracts both tourists and business travelers. | Marmande Cathedral, Place de la Mairie, Local markets, Cafés and restaurants, Shops |
| Parc Naturel Régional des Landes de Gascogne | This natural park attracts nature lovers and outdoor enthusiasts. Offering beautiful landscapes, it is perfect for visitors looking for tranquility and adventure. | Hiking trails, Birdwatching, Bicycle routes, Picnic areas, Wildlife watching |
| Le Mas d'Agenais | Charming village known for its historical buildings and a relaxed atmosphere. It’s great for visitors seeking a peaceful getaway with cultural experiences. | Historical sites, Local wineries, Canal de Garonne, Quaint restaurants |
| Société Nautique Marmande | Located by the water, this area is popular among boating enthusiasts. It provides leisure activities and attracts visitors looking for water sports. | Boat rentals, Water sports activities, Scenic views, Fishing opportunities |
| Auradou | A suburban area of Marmande that offers a quieter residential feel while still being close to the city center, appealing to families and longer-stay guests. | Parks, Family-friendly amenities, Local shops |
| Marmande vineyards | Region famous for its vineyards, attracting wine enthusiasts and tourists looking for wine tasting experiences and tours. | Vineyard tours, Wine tastings, Grapevine landscapes, Culinary experiences |
| Stadium de Marmande | This area is great for sports fans and hosts local events. It’s popular during match days and events, drawing visitors to the vicinity. | Local sporting events, Events and matches, Recreational facilities |
| Cafés et Restaurants de la Rue Nationale | This area is the dining hub of Marmande, famous for its variety of eateries and cafés that cater to all kinds of tourists and locals alike. | Diverse dining options, Cafés, Local cuisine experiences, Social atmosphere |
Understanding Airbnb License Requirements & STR Laws in Marmande (2025)
While Marmande, Nouvelle-Aquitaine, France currently shows low STR regulations, specific Airbnb license requirements might still exist or change. Always verify the latest short term rental regulations and Airbnb license requirements directly with local government authorities for Marmande to ensure full compliance before hosting.
(Source: AirROI data, 2025, based on 5% licensed listings)
Top Performing Airbnb Properties in Marmande (2025)
Benchmark your potential! Explore examples of top-performing Airbnb properties in Marmandebased on Trailing Twelve Month (TTM) revenue. Analyze their characteristics, revenue, occupancy rate, and ADR to understand what drives success in this market.
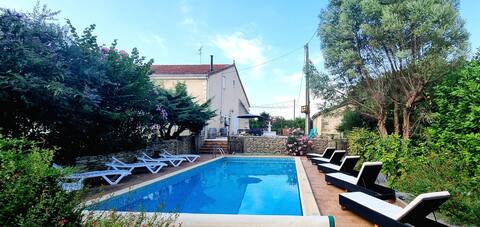
Maison Bel Air
Entire Place • 4 bedrooms
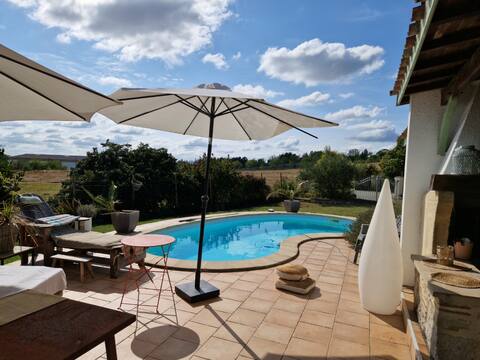
La Maison de Campagne
Entire Place • 4 bedrooms

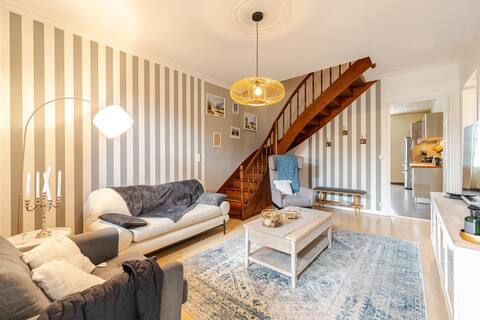
Renovated modern home
Entire Place • 2 bedrooms
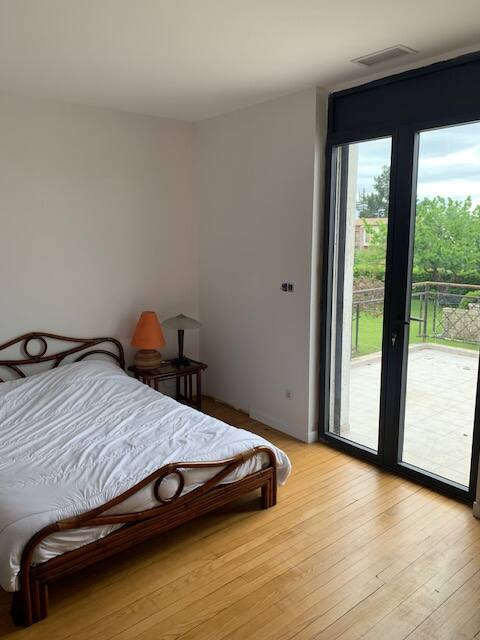
Large-format apartment
Entire Place • 3 bedrooms
Room and terrace in Marmande
Private Room • N/A
Adorable little house
Entire Place • 2 bedrooms
Note: Performance varies based on location, size, amenities, seasonality, and management quality. Data reflects the past 12 months.
Top Performing Airbnb Hosts in Marmande (2025)
Learn from the best! This table showcases top-performing Airbnb hosts in Marmande based on the number of properties managed and estimated total revenue over the past year. Analyze their scale and performance metrics.
| Host Name | Properties | Grossing Revenue | Stay Reviews | Avg Rating |
|---|---|---|---|---|
| Justine Et Lucas | 5 | $85,562 | 241 | 4.88/5.0 |
| Jessie | 1 | $62,275 | 9 | 5.00/5.0 |
| Abou | 4 | $57,815 | 7 | 1.25/5.0 |
| Host #107277041 | 1 | $44,686 | 13 | 4.92/5.0 |
| Virginie | 3 | $29,255 | 291 | 4.89/5.0 |
| Stéphan | 3 | $28,420 | 210 | 4.94/5.0 |
| Christine | 4 | $27,301 | 408 | 4.78/5.0 |
| Rudy | 2 | $27,164 | 47 | 4.92/5.0 |
| Cedric | 1 | $25,002 | 46 | 4.98/5.0 |
| Elizabeth | 4 | $24,481 | 801 | 4.81/5.0 |
Analyzing the strategies of top hosts, such as their property selection, pricing, and guest communication, can offer valuable lessons for optimizing your own Airbnb operations in Marmande.
Dive Deeper: Advanced Marmande STR Market Data (2025)
Ready to unlock more insights? AirROI provides access to advanced metrics and comprehensive Airbnb data for Marmande. Explore detailed analytics beyond this report to refine your investment strategy, optimize pricing, and maximize your vacation rental profits.
Explore Advanced MetricsMarmande Short-Term Rental Market Composition (2025): Property & Room Types
Room Type Distribution
Property Type Distribution
Market Composition Insights for Marmande
- The Marmande Airbnb market composition is heavily skewed towards Entire Home/Apt listings, which make up 51.9% of the 108 active rentals. This indicates strong guest preference for privacy and space.
- However, a notable 46.3% share for Private Rooms suggests opportunities for budget-conscious travelers or hosts renting out spare rooms.
- Looking at the property type distribution in Marmande, House properties are the most common (54.6%), reflecting the local real estate landscape.
- Houses represent a significant 54.6% portion, catering likely to families or larger groups.
- The presence of 8.3% Hotel/Boutique listings indicates integration with traditional hospitality.
- Smaller segments like others, unique stays (combined 1.8%) offer potential for unique stay experiences.
Marmande Airbnb Room Capacity Analysis (2025): Bedroom Distribution
Distribution of Listings by Number of Bedrooms
Room Capacity Insights for Marmande
- The dominant room capacity in Marmande is 1 bedroom listings, making up 39.8% of the market. This suggests a strong demand for properties suitable for couples or solo travelers.
- Together, 1 bedroom and 2 bedrooms properties represent 50.9% of the active Airbnb listings in Marmande, indicating a high concentration in these sizes.
Marmande Vacation Rental Guest Capacity Trends (2025)
Distribution of Listings by Guest Capacity
Guest Capacity Insights for Marmande
- The most common guest capacity trend in Marmande vacation rentals is listings accommodating 4 guests (21.3%). This suggests the primary traveler segment is likely small families or groups.
- Properties designed for 4 guests and 2 guests dominate the Marmande STR market, accounting for 39.8% of listings.
- 16.7% of properties accommodate 6+ guests, serving the market segment for larger families or group travel in Marmande.
- On average, properties in Marmande are equipped to host 2.7 guests.
Marmande Airbnb Booking Patterns (2025): Available vs. Booked Days
Available Days Distribution
Booked Days Distribution
Booking Pattern Insights for Marmande
- The most common availability pattern in Marmande falls within the 271-366 days range, representing 45.4% of listings. This suggests many properties have significant open periods on their calendars.
- Approximately 86.1% of listings show high availability (181+ days open annually), indicating potential for increased bookings or specific owner usage patterns.
- For booked days, the 91-180 days range is most frequent in Marmande (43.5%), reflecting common guest stay durations or potential owner blocking patterns.
- A notable 13.9% of properties secure long booking periods (181+ days booked per year), highlighting successful long-term rental strategies or significant owner usage.
Marmande Airbnb Minimum Stay Requirements Analysis
Distribution of Listings by Minimum Night Requirement
1 Night
54 listings
55.1% of total
2 Nights
21 listings
21.4% of total
3 Nights
12 listings
12.2% of total
4-6 Nights
3 listings
3.1% of total
30+ Nights
8 listings
8.2% of total
Key Insights
- The most prevalent minimum stay requirement in Marmande is 1 Night, adopted by 55.1% of listings. This highlights the market's preference for shorter, flexible bookings.
- A strong majority (76.5%) of the Marmande Airbnb data shows acceptance of very short stays (1-2 nights), indicating a dynamic, high-turnover market.
Recommendations
- Align with the market by considering a 1 Night minimum stay, as 55.1% of Marmande hosts use this setting.
- Explore offering discounts for stays of 30+ nights to attract the 8.2% of the market seeking extended stays.
- Adjust minimum nights based on seasonality – potentially shorter during low season and longer during peak demand periods in Marmande.
Marmande Airbnb Cancellation Policy Trends Analysis (2025)
Flexible
34 listings
39.5% of total
Moderate
29 listings
33.7% of total
Firm
10 listings
11.6% of total
Strict
13 listings
15.1% of total
Cancellation Policy Insights for Marmande
- The prevailing Airbnb cancellation policy trend in Marmande is Flexible, used by 39.5% of listings.
- The market strongly favors guest-friendly terms, with 73.2% of listings offering Flexible or Moderate policies. This suggests guests in Marmande may expect booking flexibility.
Recommendations for Hosts
- Consider adopting a Flexible policy to align with the 39.5% market standard in Marmande.
- Regularly review your cancellation policy against competitors and market demand shifts in Marmande.
Marmande STR Booking Lead Time Analysis (2025)
Average Booking Lead Time by Month
Booking Lead Time Insights for Marmande
- The overall average booking lead time for vacation rentals in Marmande is 39 days.
- Guests book furthest in advance for stays during June (average 119 days), likely coinciding with peak travel demand or local events.
- The shortest booking windows occur for stays in February (average 23 days), indicating more last-minute travel plans during this time.
- Seasonally, Summer (73 days avg.) sees the longest lead times, while Winter (28 days avg.) has the shortest, reflecting typical travel planning cycles.
Recommendations for Hosts
- Use the overall average lead time (39 days) as a baseline for your pricing and availability strategy in Marmande.
- For June stays, consider implementing length-of-stay discounts or slightly higher rates for bookings made less than 119 days out to capitalize on advance planning.
- Target marketing efforts for the Summer season well in advance (at least 73 days) to capture early planners.
- Monitor your own booking lead times against these Marmande averages to identify opportunities for dynamic pricing adjustments.
Popular & Essential Airbnb Amenities in Marmande (2025)
Amenity Prevalence
Amenity Insights for Marmande
- Popular amenities like Heating, Wifi, Smoke alarm are common but not universal. Offering these can provide a competitive edge.
- Warning: Wifi is not universally provided but is considered essential globally. Ensure reliable Wifi is offered.
Recommendations for Hosts
- Consider adding popular differentiators like Heating or Wifi to increase appeal.
- Highlight unique or less common amenities you offer (e.g., hot tub, dedicated workspace, EV charger) in your listing description and photos.
- Regularly check competitor amenities in Marmande to stay competitive.
Marmande Airbnb Guest Demographics & Profile Analysis (2025)
Guest Profile Summary for Marmande
- The typical guest profile for Airbnb in Marmande consists of primarily domestic travelers (87%), often arriving from nearby Paris, typically belonging to the Post-2000s (Gen Z/Alpha) group (50%), primarily speaking French or English.
- Domestic travelers account for 87.3% of guests.
- Key international markets include France (87.3%) and United Kingdom (3.1%).
- Top languages spoken are French (42.5%) followed by English (30.3%).
- A significant demographic segment is the Post-2000s (Gen Z/Alpha) group, representing 50% of guests.
Recommendations for Hosts
- Target domestic marketing efforts towards travelers from Paris and Bordeaux.
- Tailor amenities and listing descriptions to appeal to the dominant Post-2000s (Gen Z/Alpha) demographic (e.g., highlight fast WiFi, smart home features, local guides).
- Highlight unique local experiences or amenities relevant to the primary guest profile.
- Consider seasonal promotions aligned with peak travel times for key origin markets.
Nearby Short-Term Rental Market Comparison
How does the Marmande Airbnb market stack up against its neighbors? Compare key performance metrics like average monthly revenue, ADR, and occupancy rates in surrounding areas to understand the broader regional STR landscape.
| Market | Active Properties | Monthly Revenue | Daily Rate | Avg. Occupancy |
|---|---|---|---|---|
| Saint-Laurent-des-Combes | 11 | $3,526 | $706.18 | 23% |
| Astaffort | 10 | $3,393 | $314.20 | 35% |
| Cénac | 18 | $2,773 | $268.58 | 53% |
| Cérons | 11 | $2,635 | $196.16 | 39% |
| Galgon | 12 | $2,599 | $210.34 | 48% |
| Eynesse | 14 | $2,564 | $282.87 | 36% |
| Bourrou | 10 | $2,475 | $247.57 | 36% |
| Saint-Hippolyte | 10 | $2,443 | $204.98 | 44% |
| Carignan-de-Bordeaux | 30 | $2,418 | $236.77 | 48% |
| Abzac | 12 | $2,415 | $349.03 | 36% |