Lévignacq Airbnb Market Analysis 2025: Short Term Rental Data & Vacation Rental Statistics in Nouvelle-Aquitaine, France
Is Airbnb profitable in Lévignacq in 2025? Explore comprehensive Airbnb analytics for Lévignacq, Nouvelle-Aquitaine, France to uncover income potential. This 2025 STR market report for Lévignacq, based on AirROI data from April 2024 to March 2025, reveals key trends in the niche market of 19 active listings.
Whether you're considering an Airbnb investment in Lévignacq, optimizing your existing vacation rental, or exploring rental arbitrage opportunities, understanding the Lévignacq Airbnb data is crucial. Understanding the local regulations is key to maximizing your short term rental income potential. Let's dive into the specifics.
Key Lévignacq Airbnb Performance Metrics Overview
Monthly Airbnb Revenue Variations & Income Potential in Lévignacq (2025)
Understanding the monthly revenue variations for Airbnb listings in Lévignacq is key to maximizing your short term rental income potential. Seasonality significantly impacts earnings. Our analysis, based on data from the past 12 months, shows that the peak revenue month for STRs in Lévignacq is typically August, while January often presents the lowest earnings, highlighting opportunities for strategic pricing adjustments during shoulder and low seasons. Explore the typical Airbnb income in Lévignacq across different performance tiers:
- Best-in-class properties (Top 10%) achieve $4,229+ monthly, often utilizing dynamic pricing and superior guest experiences.
- Strong performing properties (Top 25%) earn $2,833 or more, indicating effective management and desirable locations/amenities.
- Typical properties (Median) generate around $1,452 per month, representing the average market performance.
- Entry-level properties (Bottom 25%) see earnings around $580, often with potential for optimization.
Average Monthly Airbnb Earnings Trend in Lévignacq
Lévignacq Airbnb Occupancy Rate Trends (2025)
Maximize your bookings by understanding the Lévignacq STR occupancy trends. Seasonal demand shifts significantly influence how often properties are booked. Typically, Augustsees the highest demand (peak season occupancy), while January experiences the lowest (low season). Effective strategies, like adjusting minimum stays or offering promotions, can boost occupancy during slower periods. Here's how different property tiers perform in Lévignacq:
- Best-in-class properties (Top 10%) achieve 63%+ occupancy, indicating high desirability and potentially optimized availability.
- Strong performing properties (Top 25%) maintain 44% or higher occupancy, suggesting good market fit and guest satisfaction.
- Typical properties (Median) have an occupancy rate around 29%.
- Entry-level properties (Bottom 25%) average 17% occupancy, potentially facing higher vacancy.
Average Monthly Occupancy Rate Trend in Lévignacq
Average Daily Rate (ADR) Airbnb Trends in Lévignacq (2025)
Effective short term rental pricing strategy in Lévignacq involves understanding monthly ADR fluctuations. The Average Daily Rate (ADR) for Airbnb in Lévignacq typically peaks in July and dips lowest during February. Leveraging Airbnb dynamic pricing tools or strategies based on this seasonality can significantly boost revenue. Here's a look at the typical nightly rates achieved:
- Best-in-class properties (Top 10%) command rates of $264+ per night, often due to premium features or locations.
- Strong performing properties (Top 25%) achieve nightly rates of $200 or more.
- Typical properties (Median) charge around $145 per night.
- Entry-level properties (Bottom 25%) earn around $86 per night.
Average Daily Rate (ADR) Trend by Month in Lévignacq
Get Live Lévignacq Market Intelligence 👇

Explore Real-time Analytics
Airbnb Seasonality Analysis & Trends in Lévignacq (2025)
Peak Season (August, July, June)
- Revenue averages $3,064 per month
- Occupancy rates average 56.3%
- Daily rates average $183
Shoulder Season
- Revenue averages $1,864 per month
- Occupancy maintains around 28.2%
- Daily rates hold near $162
Low Season (January, February, March)
- Revenue drops to average $806 per month
- Occupancy decreases to average 20.1%
- Daily rates adjust to average $136
Seasonality Insights for Lévignacq
- The Airbnb seasonality in Lévignacq shows highly seasonal trends requiring careful strategy. While the sections above show seasonal averages, it's also insightful to look at the extremes:
- During the high season, the absolute peak month showcases Lévignacq's highest earning potential, with monthly revenues capable of climbing to $3,713, occupancy reaching a high of 72.4%, and ADRs peaking at $184.
- Conversely, the slowest single month of the year, typically falling within the low season, marks the market's lowest point. In this month, revenue might dip to $558, occupancy could drop to 13.9%, and ADRs may adjust down to $136.
- Understanding both the seasonal averages and these monthly peaks and troughs in revenue, occupancy, and ADR is crucial for maximizing your Airbnb profit potential in Lévignacq.
Seasonal Strategies for Maximizing Profit
- Peak Season: Maximize revenue through premium pricing and potentially longer minimum stays. Ensure high availability.
- Low Season: Offer competitive pricing, special promotions (e.g., extended stay discounts), and flexible cancellation policies. Target off-season travelers like remote workers or budget-conscious guests.
- Shoulder Seasons: Implement dynamic pricing that balances peak and low rates. Target weekend travelers or specific events. Offer slightly more flexible terms than peak season.
- Regularly analyze your own performance against these Lévignacq seasonality benchmarks and adjust your pricing and availability strategy accordingly.
Best Areas for Airbnb Investment in Lévignacq (2025)
Exploring the top neighborhoods for short-term rentals in Lévignacq? This section highlights key areas, outlining why they are attractive for hosts and guests, along with notable local attractions. Consider these locations based on your target guest profile and investment strategy.
| Neighborhood / Area | Why Host Here? (Target Guests & Appeal) | Key Attractions & Landmarks |
|---|---|---|
| Lévignacq Village | A charming and tranquil village atmosphere beckons visitors looking for a genuine French countryside experience. Ideal for guests seeking peace and natural beauty, with local markets and friendly inhabitants. | Local farmers markets, Scenic walking trails, Nearby forests and lakes, Cultural festivals, Historic churches |
| Arcachon Bay | Known for its beautiful beaches and vibrant atmosphere, Arcachon Bay is a hotspot for beach lovers and water sports enthusiasts. Visitors are attracted to the stunning scenery and abundance of outdoor activities. | Dune du Pilat, Arcachon beaches, Boat tours, Oyster farms, Nature parks |
| Biarritz | A luxurious coastal city renowned for its surf culture and elegant architecture. It's a favorite among tourists who enjoy beach life and upscale dining and shopping. | Grande Plage, Biarritz Lighthouse, Cité de l'Océan, Surf spots, High-end boutiques |
| Mimizan | A coastal town famous for its long sandy beaches and surf culture. Its family-friendly atmosphere makes it popular among summer vacationers seeking beach activities and relaxation. | Mimizan Plage, Cycle paths, Nature reserves, Beachfront restaurants, Surf schools |
| Dax | Known for its thermal baths and wellness culture, Dax attracts visitors looking for relaxation and health treatments. The town also has a rich history and vibrant local culture. | Thermal spas, Historic architecture, Cultural events, Local gastronomy, Parks and gardens |
| Saint-Jean-de-Luz | A picturesque fishing town with Basque influence, offering beautiful beaches and a vibrant town center. Ideal for those looking to experience local cuisine and seaside charm. | Saint-Jean-de-Luz beach, Old town, Basque cuisine, Fishing harbor, Cultural festivals |
| Pau | Nestled in the foothills of the Pyrenees, Pau is known for its historical significance and stunning views. It attracts tourists interested in history, culture, and outdoor activities. | Château de Pau, Boulevards of Pau, Pic du Midi d'Ossau views, Museums, Golf courses |
| Capbreton | A popular surf destination featuring beautiful beaches and lively harbor activities. It attracts both adventure seekers and families looking to enjoy the sun and sea. | Capbreton beaches, Surf schools, Marina activities, Nature walks, Cycling routes |
Understanding Airbnb License Requirements & STR Laws in Lévignacq (2025)
With 11% of listings showing registration in 2025, understanding potential Airbnb license requirements is crucial in Lévignacq. Always verify the latest short term rental regulations and Airbnb license requirements directly with local government authorities for Lévignacq to ensure full compliance before hosting.
(Source: AirROI data, 2025, based on 11% licensed listings)
Top Performing Airbnb Properties in Lévignacq (2025)
Benchmark your potential! Explore examples of top-performing Airbnb properties in Lévignacqbased on Trailing Twelve Month (TTM) revenue. Analyze their characteristics, revenue, occupancy rate, and ADR to understand what drives success in this market.
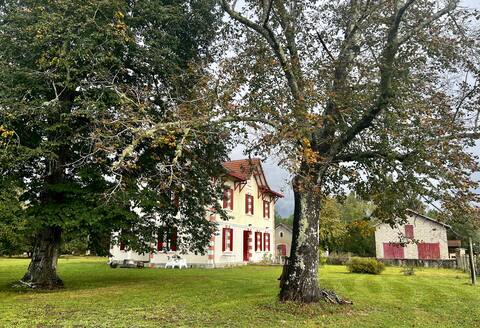
Charming French Country Home from 1928
Entire Place • 5 bedrooms

Happiness is in the Landes
Entire Place • 4 bedrooms

Landes house close to beaches
Entire Place • 3 bedrooms

Wine Cellar from 1835, Design renovation in 2011
Entire Place • 5 bedrooms
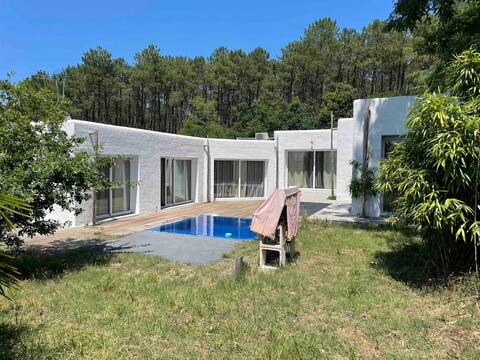
La Casba Atypical House
Entire Place • 2 bedrooms
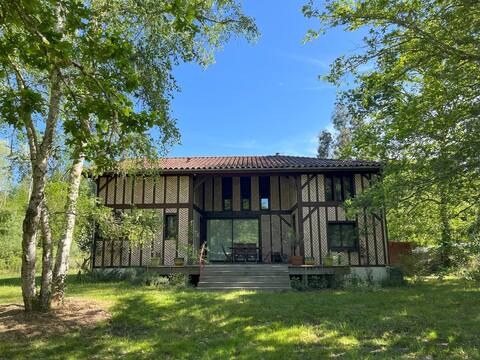
Architect's house in the Landes
Entire Place • 4 bedrooms
Note: Performance varies based on location, size, amenities, seasonality, and management quality. Data reflects the past 12 months.
Top Performing Airbnb Hosts in Lévignacq (2025)
Learn from the best! This table showcases top-performing Airbnb hosts in Lévignacq based on the number of properties managed and estimated total revenue over the past year. Analyze their scale and performance metrics.
| Host Name | Properties | Grossing Revenue | Stay Reviews | Avg Rating |
|---|---|---|---|---|
| Gudi Et Stéphane | 2 | $67,374 | 99 | 4.99/5.0 |
| Delphine | 2 | $36,992 | 20 | 2.50/5.0 |
| Guillaume | 1 | $33,572 | 16 | 4.94/5.0 |
| Alain | 1 | $24,733 | 14 | 4.29/5.0 |
| Jean Et Irène | 2 | $18,598 | 13 | 2.41/5.0 |
| Ariane | 1 | $18,335 | 3 | 5.00/5.0 |
| Clotilde / Denys | 1 | $17,088 | 7 | 5.00/5.0 |
| Adrien | 1 | $9,378 | 7 | 5.00/5.0 |
| Host #132946057 | 1 | $9,190 | 0 | 0.00/5.0 |
| Sonia | 2 | $8,994 | 11 | 4.33/5.0 |
Analyzing the strategies of top hosts, such as their property selection, pricing, and guest communication, can offer valuable lessons for optimizing your own Airbnb operations in Lévignacq.
Dive Deeper: Advanced Lévignacq STR Market Data (2025)
Ready to unlock more insights? AirROI provides access to advanced metrics and comprehensive Airbnb data for Lévignacq. Explore detailed analytics beyond this report to refine your investment strategy, optimize pricing, and maximize your vacation rental profits.
Explore Advanced MetricsLévignacq Short-Term Rental Market Composition (2025): Property & Room Types
Room Type Distribution
Property Type Distribution
Market Composition Insights for Lévignacq
- The Lévignacq Airbnb market composition is heavily skewed towards Entire Home/Apt listings, which make up 100% of the 19 active rentals. This indicates strong guest preference for privacy and space.
- Looking at the property type distribution in Lévignacq, House properties are the most common (84.2%), reflecting the local real estate landscape.
- Houses represent a significant 84.2% portion, catering likely to families or larger groups.
- The presence of 5.3% Hotel/Boutique listings indicates integration with traditional hospitality.
Lévignacq Airbnb Room Capacity Analysis (2025): Bedroom Distribution
Distribution of Listings by Number of Bedrooms
Room Capacity Insights for Lévignacq
- The dominant room capacity in Lévignacq is 4 bedrooms listings, making up 26.3% of the market. This suggests a strong demand for properties suitable for families or small groups.
- Together, 4 bedrooms and 1 bedroom properties represent 52.6% of the active Airbnb listings in Lévignacq, indicating a high concentration in these sizes.
- A significant 57.9% of listings offer 3+ bedrooms, catering to larger groups and families seeking more space in Lévignacq.
Lévignacq Vacation Rental Guest Capacity Trends (2025)
Distribution of Listings by Guest Capacity
Guest Capacity Insights for Lévignacq
- The most common guest capacity trend in Lévignacq vacation rentals is listings accommodating 8+ guests (31.6%). This suggests the primary traveler segment is likely larger groups.
- Properties designed for 8+ guests and 6 guests dominate the Lévignacq STR market, accounting for 57.9% of listings.
- 63.2% of properties accommodate 6+ guests, serving the market segment for larger families or group travel in Lévignacq.
- On average, properties in Lévignacq are equipped to host 5.7 guests.
Lévignacq Airbnb Booking Patterns (2025): Available vs. Booked Days
Available Days Distribution
Booked Days Distribution
Booking Pattern Insights for Lévignacq
- The most common availability pattern in Lévignacq falls within the 271-366 days range, representing 52.6% of listings. This suggests many properties have significant open periods on their calendars.
- Approximately 94.7% of listings show high availability (181+ days open annually), indicating potential for increased bookings or specific owner usage patterns.
- For booked days, the 91-180 days range is most frequent in Lévignacq (47.4%), reflecting common guest stay durations or potential owner blocking patterns.
- A notable 5.3% of properties secure long booking periods (181+ days booked per year), highlighting successful long-term rental strategies or significant owner usage.
Lévignacq Airbnb Minimum Stay Requirements Analysis
Distribution of Listings by Minimum Night Requirement
1 Night
1 listings
5.3% of total
2 Nights
5 listings
26.3% of total
3 Nights
7 listings
36.8% of total
4-6 Nights
3 listings
15.8% of total
7-29 Nights
3 listings
15.8% of total
Key Insights
- The most prevalent minimum stay requirement in Lévignacq is 3 Nights, adopted by 36.8% of listings. This highlights the market's preference for longer commitments.
Recommendations
- Align with the market by considering a 3 Nights minimum stay, as 36.8% of Lévignacq hosts use this setting.
- If feasible, allowing 1-night stays, especially midweek or during low season, could capture last-minute bookings, as only 5.3% currently do.
- Adjust minimum nights based on seasonality – potentially shorter during low season and longer during peak demand periods in Lévignacq.
Lévignacq Airbnb Cancellation Policy Trends Analysis (2025)
Flexible
4 listings
25% of total
Moderate
3 listings
18.8% of total
Firm
4 listings
25% of total
Strict
5 listings
31.3% of total
Cancellation Policy Insights for Lévignacq
- The prevailing Airbnb cancellation policy trend in Lévignacq is Strict, used by 31.3% of listings.
- A majority (56.3%) of hosts in Lévignacq utilize Firm or Strict policies, indicating a market where hosts prioritize booking security.
Recommendations for Hosts
- Consider adopting a Strict policy to align with the 31.3% market standard in Lévignacq.
- With 31.3% using Strict terms, this is a viable option in Lévignacq, particularly for high-value properties or during peak demand periods.
- Regularly review your cancellation policy against competitors and market demand shifts in Lévignacq.
Lévignacq STR Booking Lead Time Analysis (2025)
Average Booking Lead Time by Month
Booking Lead Time Insights for Lévignacq
- The overall average booking lead time for vacation rentals in Lévignacq is 57 days.
- Guests book furthest in advance for stays during October (average 145 days), likely coinciding with peak travel demand or local events.
- The shortest booking windows occur for stays in February (average 3 days), indicating more last-minute travel plans during this time.
- Seasonally, Summer (112 days avg.) sees the longest lead times, while Winter (21 days avg.) has the shortest, reflecting typical travel planning cycles.
Recommendations for Hosts
- Use the overall average lead time (57 days) as a baseline for your pricing and availability strategy in Lévignacq.
- For October stays, consider implementing length-of-stay discounts or slightly higher rates for bookings made less than 145 days out to capitalize on advance planning.
- During February, focus on last-minute booking availability and promotions, as guests book with very short notice (3 days avg.).
- Target marketing efforts for the Summer season well in advance (at least 112 days) to capture early planners.
- Monitor your own booking lead times against these Lévignacq averages to identify opportunities for dynamic pricing adjustments.
Popular & Essential Airbnb Amenities in Lévignacq (2025)
Amenity Prevalence
Amenity Insights for Lévignacq
- Popular amenities like Kitchen, Heating, Washer are common but not universal. Offering these can provide a competitive edge.
- Warning: Wifi is not universally provided but is considered essential globally. Ensure reliable Wifi is offered.
Recommendations for Hosts
- Consider adding popular differentiators like Kitchen or Heating to increase appeal.
- Highlight unique or less common amenities you offer (e.g., hot tub, dedicated workspace, EV charger) in your listing description and photos.
- Regularly check competitor amenities in Lévignacq to stay competitive.
Lévignacq Airbnb Guest Demographics & Profile Analysis (2025)
Guest Profile Summary for Lévignacq
- The typical guest profile for Airbnb in Lévignacq consists of primarily domestic travelers (68%), often arriving from nearby Toulouse, typically belonging to the Post-2000s (Gen Z/Alpha) group (50%), primarily speaking French or English.
- Domestic travelers account for 67.7% of guests.
- Key international markets include France (67.7%) and Germany (13.8%).
- Top languages spoken are French (33.3%) followed by English (33.3%).
- A significant demographic segment is the Post-2000s (Gen Z/Alpha) group, representing 50% of guests.
Recommendations for Hosts
- Target domestic marketing efforts towards travelers from Toulouse and Paris.
- Tailor amenities and listing descriptions to appeal to the dominant Post-2000s (Gen Z/Alpha) demographic (e.g., highlight fast WiFi, smart home features, local guides).
- Highlight unique local experiences or amenities relevant to the primary guest profile.
- Consider seasonal promotions aligned with peak travel times for key origin markets.
Nearby Short-Term Rental Market Comparison
How does the Lévignacq Airbnb market stack up against its neighbors? Compare key performance metrics like average monthly revenue, ADR, and occupancy rates in surrounding areas to understand the broader regional STR landscape.
| Market | Active Properties | Monthly Revenue | Daily Rate | Avg. Occupancy |
|---|---|---|---|---|
| San Sebastián | 1,426 | $3,546 | $262.81 | 49% |
| Saint-Laurent-des-Combes | 11 | $3,526 | $706.18 | 23% |
| Gautegiz Arteaga | 21 | $2,865 | $293.66 | 38% |
| Cénac | 18 | $2,773 | $268.58 | 53% |
| Cérons | 11 | $2,635 | $196.16 | 39% |
| Barrika | 13 | $2,629 | $314.61 | 41% |
| Galgon | 12 | $2,599 | $210.34 | 48% |
| Hernani | 11 | $2,572 | $345.16 | 40% |
| Saint-Hippolyte | 10 | $2,443 | $204.98 | 44% |
| Dima | 11 | $2,422 | $332.91 | 42% |