Lège-Cap-Ferret Airbnb Market Analysis 2025: Short Term Rental Data & Vacation Rental Statistics in Nouvelle-Aquitaine, France
Is Airbnb profitable in Lège-Cap-Ferret in 2025? Explore comprehensive Airbnb analytics for Lège-Cap-Ferret, Nouvelle-Aquitaine, France to uncover income potential. This 2025 STR market report for Lège-Cap-Ferret, based on AirROI data from April 2024 to March 2025, reveals key trends in the bustling market of 1,210 active listings.
Whether you're considering an Airbnb investment in Lège-Cap-Ferret, optimizing your existing vacation rental, or exploring rental arbitrage opportunities, understanding the Lège-Cap-Ferret Airbnb data is crucial. Navigating the high regulation landscape is key to maximizing your short term rental income potential. Let's dive into the specifics.
Key Lège-Cap-Ferret Airbnb Performance Metrics Overview
Monthly Airbnb Revenue Variations & Income Potential in Lège-Cap-Ferret (2025)
Understanding the monthly revenue variations for Airbnb listings in Lège-Cap-Ferret is key to maximizing your short term rental income potential. Seasonality significantly impacts earnings. Our analysis, based on data from the past 12 months, shows that the peak revenue month for STRs in Lège-Cap-Ferret is typically August, while March often presents the lowest earnings, highlighting opportunities for strategic pricing adjustments during shoulder and low seasons. Explore the typical Airbnb income in Lège-Cap-Ferret across different performance tiers:
- Best-in-class properties (Top 10%) achieve $7,807+ monthly, often utilizing dynamic pricing and superior guest experiences.
- Strong performing properties (Top 25%) earn $4,507 or more, indicating effective management and desirable locations/amenities.
- Typical properties (Median) generate around $2,364 per month, representing the average market performance.
- Entry-level properties (Bottom 25%) see earnings around $1,136, often with potential for optimization.
Average Monthly Airbnb Earnings Trend in Lège-Cap-Ferret
Lège-Cap-Ferret Airbnb Occupancy Rate Trends (2025)
Maximize your bookings by understanding the Lège-Cap-Ferret STR occupancy trends. Seasonal demand shifts significantly influence how often properties are booked. Typically, Augustsees the highest demand (peak season occupancy), while January experiences the lowest (low season). Effective strategies, like adjusting minimum stays or offering promotions, can boost occupancy during slower periods. Here's how different property tiers perform in Lège-Cap-Ferret:
- Best-in-class properties (Top 10%) achieve 68%+ occupancy, indicating high desirability and potentially optimized availability.
- Strong performing properties (Top 25%) maintain 51% or higher occupancy, suggesting good market fit and guest satisfaction.
- Typical properties (Median) have an occupancy rate around 31%.
- Entry-level properties (Bottom 25%) average 16% occupancy, potentially facing higher vacancy.
Average Monthly Occupancy Rate Trend in Lège-Cap-Ferret
Average Daily Rate (ADR) Airbnb Trends in Lège-Cap-Ferret (2025)
Effective short term rental pricing strategy in Lège-Cap-Ferret involves understanding monthly ADR fluctuations. The Average Daily Rate (ADR) for Airbnb in Lège-Cap-Ferret typically peaks in July and dips lowest during March. Leveraging Airbnb dynamic pricing tools or strategies based on this seasonality can significantly boost revenue. Here's a look at the typical nightly rates achieved:
- Best-in-class properties (Top 10%) command rates of $703+ per night, often due to premium features or locations.
- Strong performing properties (Top 25%) achieve nightly rates of $451 or more.
- Typical properties (Median) charge around $260 per night.
- Entry-level properties (Bottom 25%) earn around $147 per night.
Average Daily Rate (ADR) Trend by Month in Lège-Cap-Ferret
Get Live Lège-Cap-Ferret Market Intelligence 👇

Explore Real-time Analytics
Airbnb Seasonality Analysis & Trends in Lège-Cap-Ferret (2025)
Peak Season (August, July, May)
- Revenue averages $6,579 per month
- Occupancy rates average 53.9%
- Daily rates average $387
Shoulder Season
- Revenue averages $3,140 per month
- Occupancy maintains around 32.1%
- Daily rates hold near $351
Low Season (January, February, March)
- Revenue drops to average $1,676 per month
- Occupancy decreases to average 21.3%
- Daily rates adjust to average $321
Seasonality Insights for Lège-Cap-Ferret
- The Airbnb seasonality in Lège-Cap-Ferret shows highly seasonal trends requiring careful strategy. While the sections above show seasonal averages, it's also insightful to look at the extremes:
- During the high season, the absolute peak month showcases Lège-Cap-Ferret's highest earning potential, with monthly revenues capable of climbing to $8,232, occupancy reaching a high of 68.3%, and ADRs peaking at $397.
- Conversely, the slowest single month of the year, typically falling within the low season, marks the market's lowest point. In this month, revenue might dip to $1,544, occupancy could drop to 20.5%, and ADRs may adjust down to $315.
- Understanding both the seasonal averages and these monthly peaks and troughs in revenue, occupancy, and ADR is crucial for maximizing your Airbnb profit potential in Lège-Cap-Ferret.
Seasonal Strategies for Maximizing Profit
- Peak Season: Maximize revenue through premium pricing and potentially longer minimum stays. Ensure high availability.
- Low Season: Offer competitive pricing, special promotions (e.g., extended stay discounts), and flexible cancellation policies. Target off-season travelers like remote workers or budget-conscious guests.
- Shoulder Seasons: Implement dynamic pricing that balances peak and low rates. Target weekend travelers or specific events. Offer slightly more flexible terms than peak season.
- Regularly analyze your own performance against these Lège-Cap-Ferret seasonality benchmarks and adjust your pricing and availability strategy accordingly.
Best Areas for Airbnb Investment in Lège-Cap-Ferret (2025)
Exploring the top neighborhoods for short-term rentals in Lège-Cap-Ferret? This section highlights key areas, outlining why they are attractive for hosts and guests, along with notable local attractions. Consider these locations based on your target guest profile and investment strategy.
| Neighborhood / Area | Why Host Here? (Target Guests & Appeal) | Key Attractions & Landmarks |
|---|---|---|
| Lège Beach | A beautiful stretch of sandy beach that attracts sunbathers and water sports enthusiasts. Ideal for those looking to enjoy the seaside and local seafood. | Lège Beach, Water sports rentals, Café de la Plage, Coastal hiking trails, Local seafood restaurants |
| Cap Ferret Village | A charming village atmosphere with local shops and restaurants. This area is perfect for tourists seeking an authentic French coastal experience with a laid-back vibe. | Cap Ferret Lighthouse, Local oyster farms, Bicycle rental paths, Café du Cap Ferret, Beachfront restaurants |
| Bassin d'Arcachon | The Bassin d'Arcachon is famous for its stunning views, oysters, and nature. It is a hotspot for tourists interested in gastronomy and outdoor activities. | Dune du Pilat, Oyster tasting tours, Boat excursions, Bird watching spots, Nature reserves |
| Petit Piquey | A quiet, residential area known for its family-friendly atmosphere and proximity to the beach. Great for those looking for a peaceful getaway with local charm. | Quiet beaches, Local parks, Bike paths, Traditional markets, Family-friendly activities |
| Piraillan | Offers a mix of nature and local culture with its heritage oyster farming. A perfect spot for eco-tourism and those interested in local culinary experiences. | Oyster farms, Biking routes, Food markets, Local artisanal shops, Scenic waterfront walks |
| L'Herbe | This quaint fishing village is known for its picturesque views and relaxing atmosphere. It's perfect for vacationers seeking tranquility and nature. | L'Herbe beach, Fishing port, Bird watching, Local markets, Seaside cafés |
| Claouey | Known for its scenic views and family-friendly beaches, Claouey is ideal for families and those looking for a fun summer getaway. | Beaches, Kids' play parks, Cycling paths, Local eateries, Fishing spots |
| Le Canon | A unique spot that combines the charm of traditional fishing villages with beautiful beaches. Attracts those interested in outdoor activities and local culture. | Le Canon beach, Traditional wooden houses, Local artisan shops, Kayaking opportunities, Dining on the waterfront |
Understanding Airbnb License Requirements & STR Laws in Lège-Cap-Ferret (2025)
Yes, Lège-Cap-Ferret, Nouvelle-Aquitaine, France enforces high STR regulations. Obtaining a license and ensuring compliance is almost certainly required according to current 2025 STR laws. Always verify the latest short term rental regulations and Airbnb license requirements directly with local government authorities for Lège-Cap-Ferret to ensure full compliance before hosting.
(Source: AirROI data, 2025, based on 72% licensed listings)
Top Performing Airbnb Properties in Lège-Cap-Ferret (2025)
Benchmark your potential! Explore examples of top-performing Airbnb properties in Lège-Cap-Ferretbased on Trailing Twelve Month (TTM) revenue. Analyze their characteristics, revenue, occupancy rate, and ADR to understand what drives success in this market.
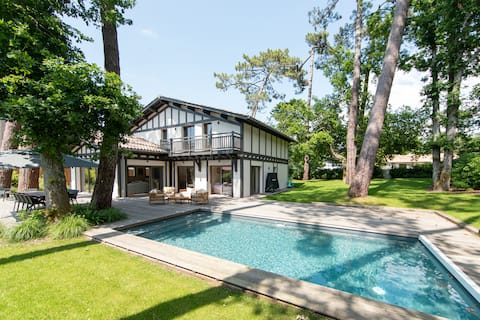
Villa Palombes au Cap Ferret charming villa with h
Entire Place • 5 bedrooms
Le 144 Ferret: 8 bedrooms, 8 baths, pool & air conditioning
Entire Place • 8 bedrooms
Stunning BARMS Cap Ferret villa
Entire Place • 6 bedrooms
Villa Madeleine 1st line for 17 people
Entire Place • 7 bedrooms
Beautiful Villa with Pool on the Side of the Basin
Entire Place • 6 bedrooms
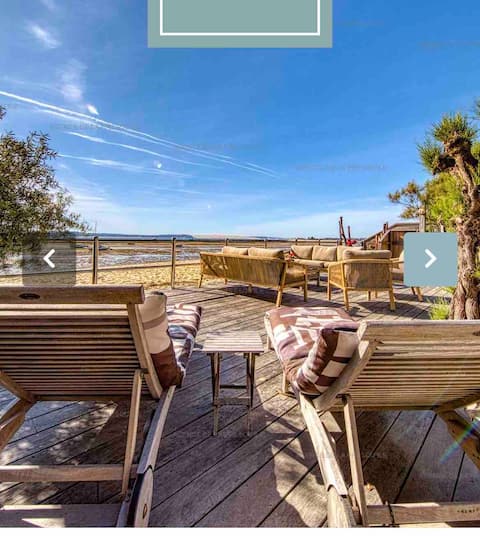
Amazing sea side location, best in Cap Ferret
Entire Place • 5 bedrooms
Note: Performance varies based on location, size, amenities, seasonality, and management quality. Data reflects the past 12 months.
Top Performing Airbnb Hosts in Lège-Cap-Ferret (2025)
Learn from the best! This table showcases top-performing Airbnb hosts in Lège-Cap-Ferret based on the number of properties managed and estimated total revenue over the past year. Analyze their scale and performance metrics.
| Host Name | Properties | Grossing Revenue | Stay Reviews | Avg Rating |
|---|---|---|---|---|
| Rémi | 16 | $950,815 | 240 | 3.62/5.0 |
| Christel & Marie | 17 | $755,403 | 109 | 2.58/5.0 |
| Sophie | 6 | $583,218 | 77 | 4.83/5.0 |
| Conciergerie CL | 13 | $500,276 | 11 | 0.37/5.0 |
| Jérôme | 8 | $491,486 | 27 | 2.44/5.0 |
| Julien | 3 | $423,750 | 35 | 5.00/5.0 |
| Marc | 2 | $365,093 | 8 | 4.50/5.0 |
| Valentine | 10 | $332,519 | 261 | 3.77/5.0 |
| Charles | 6 | $323,445 | 164 | 4.73/5.0 |
| J | 5 | $310,000 | 220 | 4.94/5.0 |
Analyzing the strategies of top hosts, such as their property selection, pricing, and guest communication, can offer valuable lessons for optimizing your own Airbnb operations in Lège-Cap-Ferret.
Dive Deeper: Advanced Lège-Cap-Ferret STR Market Data (2025)
Ready to unlock more insights? AirROI provides access to advanced metrics and comprehensive Airbnb data for Lège-Cap-Ferret. Explore detailed analytics beyond this report to refine your investment strategy, optimize pricing, and maximize your vacation rental profits.
Explore Advanced MetricsLège-Cap-Ferret Short-Term Rental Market Composition (2025): Property & Room Types
Room Type Distribution
Property Type Distribution
Market Composition Insights for Lège-Cap-Ferret
- The Lège-Cap-Ferret Airbnb market composition is heavily skewed towards Entire Home/Apt listings, which make up 93.6% of the 1,210 active rentals. This indicates strong guest preference for privacy and space.
- Looking at the property type distribution in Lège-Cap-Ferret, House properties are the most common (69.8%), reflecting the local real estate landscape.
- Houses represent a significant 69.8% portion, catering likely to families or larger groups.
- Smaller segments like hotel/boutique, others, unique stays (combined 7.1%) offer potential for unique stay experiences.
Lège-Cap-Ferret Airbnb Room Capacity Analysis (2025): Bedroom Distribution
Distribution of Listings by Number of Bedrooms
Room Capacity Insights for Lège-Cap-Ferret
- The dominant room capacity in Lège-Cap-Ferret is 3 bedrooms listings, making up 28.4% of the market. This suggests a strong demand for properties suitable for families or small groups.
- Together, 3 bedrooms and 4 bedrooms properties represent 47.1% of the active Airbnb listings in Lège-Cap-Ferret, indicating a high concentration in these sizes.
- A significant 63.3% of listings offer 3+ bedrooms, catering to larger groups and families seeking more space in Lège-Cap-Ferret.
Lège-Cap-Ferret Vacation Rental Guest Capacity Trends (2025)
Distribution of Listings by Guest Capacity
Guest Capacity Insights for Lège-Cap-Ferret
- The most common guest capacity trend in Lège-Cap-Ferret vacation rentals is listings accommodating 8+ guests (40%). This suggests the primary traveler segment is likely larger groups.
- Properties designed for 8+ guests and 6 guests dominate the Lège-Cap-Ferret STR market, accounting for 63.1% of listings.
- 67.3% of properties accommodate 6+ guests, serving the market segment for larger families or group travel in Lège-Cap-Ferret.
- On average, properties in Lège-Cap-Ferret are equipped to host 5.9 guests.
Lège-Cap-Ferret Airbnb Booking Patterns (2025): Available vs. Booked Days
Available Days Distribution
Booked Days Distribution
Booking Pattern Insights for Lège-Cap-Ferret
- The most common availability pattern in Lège-Cap-Ferret falls within the 271-366 days range, representing 56.9% of listings. This suggests many properties have significant open periods on their calendars.
- Approximately 90.9% of listings show high availability (181+ days open annually), indicating potential for increased bookings or specific owner usage patterns.
- For booked days, the 31-90 days range is most frequent in Lège-Cap-Ferret (39%), reflecting common guest stay durations or potential owner blocking patterns.
- A notable 10.1% of properties secure long booking periods (181+ days booked per year), highlighting successful long-term rental strategies or significant owner usage.
Lège-Cap-Ferret Airbnb Minimum Stay Requirements Analysis
Distribution of Listings by Minimum Night Requirement
1 Night
101 listings
9% of total
2 Nights
303 listings
26.9% of total
3 Nights
157 listings
13.9% of total
4-6 Nights
200 listings
17.7% of total
7-29 Nights
183 listings
16.2% of total
30+ Nights
184 listings
16.3% of total
Key Insights
- The most prevalent minimum stay requirement in Lège-Cap-Ferret is 2 Nights, adopted by 26.9% of listings. This highlights the market's preference for shorter, flexible bookings.
- A significant segment (16.3%) caters to monthly stays (30+ nights) in Lège-Cap-Ferret, pointing to opportunities in the extended-stay market.
Recommendations
- Align with the market by considering a 2 Nights minimum stay, as 26.9% of Lège-Cap-Ferret hosts use this setting.
- If feasible, allowing 1-night stays, especially midweek or during low season, could capture last-minute bookings, as only 9% currently do.
- Explore offering discounts for stays of 30+ nights to attract the 16.3% of the market seeking extended stays.
- Adjust minimum nights based on seasonality – potentially shorter during low season and longer during peak demand periods in Lège-Cap-Ferret.
Lège-Cap-Ferret Airbnb Cancellation Policy Trends Analysis (2025)
Super Strict 60 Days
10 listings
1% of total
Super Strict 30 Days
13 listings
1.3% of total
Flexible
124 listings
12.5% of total
Moderate
145 listings
14.6% of total
Firm
261 listings
26.3% of total
Strict
440 listings
44.3% of total
Cancellation Policy Insights for Lège-Cap-Ferret
- The prevailing Airbnb cancellation policy trend in Lège-Cap-Ferret is Strict, used by 44.3% of listings.
- A majority (70.6%) of hosts in Lège-Cap-Ferret utilize Firm or Strict policies, indicating a market where hosts prioritize booking security.
Recommendations for Hosts
- Consider adopting a Strict policy to align with the 44.3% market standard in Lège-Cap-Ferret.
- With 44.3% using Strict terms, this is a viable option in Lège-Cap-Ferret, particularly for high-value properties or during peak demand periods.
- Regularly review your cancellation policy against competitors and market demand shifts in Lège-Cap-Ferret.
Lège-Cap-Ferret STR Booking Lead Time Analysis (2025)
Average Booking Lead Time by Month
Booking Lead Time Insights for Lège-Cap-Ferret
- The overall average booking lead time for vacation rentals in Lège-Cap-Ferret is 69 days.
- Guests book furthest in advance for stays during July (average 119 days), likely coinciding with peak travel demand or local events.
- The shortest booking windows occur for stays in February (average 33 days), indicating more last-minute travel plans during this time.
- Seasonally, Summer (104 days avg.) sees the longest lead times, while Winter (44 days avg.) has the shortest, reflecting typical travel planning cycles.
Recommendations for Hosts
- Use the overall average lead time (69 days) as a baseline for your pricing and availability strategy in Lège-Cap-Ferret.
- For July stays, consider implementing length-of-stay discounts or slightly higher rates for bookings made less than 119 days out to capitalize on advance planning.
- Target marketing efforts for the Summer season well in advance (at least 104 days) to capture early planners.
- Monitor your own booking lead times against these Lège-Cap-Ferret averages to identify opportunities for dynamic pricing adjustments.
Popular & Essential Airbnb Amenities in Lège-Cap-Ferret (2025)
Amenity Prevalence
Amenity Insights for Lège-Cap-Ferret
- Essential amenities in Lège-Cap-Ferret that guests expect include: Kitchen. Lacking these (this) could significantly impact bookings.
- Popular amenities like Heating, TV, Hot water are common but not universal. Offering these can provide a competitive edge.
Recommendations for Hosts
- Ensure your listing includes all essential amenities for Lège-Cap-Ferret: Kitchen.
- Prioritize adding missing essentials: Kitchen.
- Consider adding popular differentiators like Heating or TV to increase appeal.
- Highlight unique or less common amenities you offer (e.g., hot tub, dedicated workspace, EV charger) in your listing description and photos.
- Regularly check competitor amenities in Lège-Cap-Ferret to stay competitive.
Lège-Cap-Ferret Airbnb Guest Demographics & Profile Analysis (2025)
Guest Profile Summary for Lège-Cap-Ferret
- The typical guest profile for Airbnb in Lège-Cap-Ferret consists of primarily domestic travelers (79%), often arriving from nearby Paris, typically belonging to the Post-2000s (Gen Z/Alpha) group (50%), primarily speaking French or English.
- Domestic travelers account for 78.5% of guests.
- Key international markets include France (78.5%) and Germany (4.7%).
- Top languages spoken are French (40.4%) followed by English (35.5%).
- A significant demographic segment is the Post-2000s (Gen Z/Alpha) group, representing 50% of guests.
Recommendations for Hosts
- Target domestic marketing efforts towards travelers from Paris and Bordeaux.
- Tailor amenities and listing descriptions to appeal to the dominant Post-2000s (Gen Z/Alpha) demographic (e.g., highlight fast WiFi, smart home features, local guides).
- Highlight unique local experiences or amenities relevant to the primary guest profile.
- Consider seasonal promotions aligned with peak travel times for key origin markets.
Nearby Short-Term Rental Market Comparison
How does the Lège-Cap-Ferret Airbnb market stack up against its neighbors? Compare key performance metrics like average monthly revenue, ADR, and occupancy rates in surrounding areas to understand the broader regional STR landscape.
| Market | Active Properties | Monthly Revenue | Daily Rate | Avg. Occupancy |
|---|---|---|---|---|
| San Sebastián | 1,426 | $3,546 | $262.81 | 49% |
| Saint-Laurent-des-Combes | 11 | $3,526 | $706.18 | 23% |
| Gautegiz Arteaga | 21 | $2,865 | $293.66 | 38% |
| Cénac | 18 | $2,773 | $268.58 | 53% |
| Cérons | 11 | $2,635 | $196.16 | 39% |
| Barrika | 13 | $2,629 | $314.61 | 41% |
| Galgon | 12 | $2,599 | $210.34 | 48% |
| Hernani | 11 | $2,572 | $345.16 | 40% |
| Saint-Hippolyte | 10 | $2,443 | $204.98 | 44% |
| Dima | 11 | $2,422 | $332.91 | 42% |