Lignan-de-Bordeaux Airbnb Market Analysis 2025: Short Term Rental Data & Vacation Rental Statistics in Nouvelle-Aquitaine, France
Is Airbnb profitable in Lignan-de-Bordeaux in 2025? Explore comprehensive Airbnb analytics for Lignan-de-Bordeaux, Nouvelle-Aquitaine, France to uncover income potential. This 2025 STR market report for Lignan-de-Bordeaux, based on AirROI data from April 2024 to March 2025, reveals key trends in the niche market of 20 active listings.
Whether you're considering an Airbnb investment in Lignan-de-Bordeaux, optimizing your existing vacation rental, or exploring rental arbitrage opportunities, understanding the Lignan-de-Bordeaux Airbnb data is crucial. Leveraging the low regulation environment is key to maximizing your short term rental income potential. Let's dive into the specifics.
Key Lignan-de-Bordeaux Airbnb Performance Metrics Overview
Monthly Airbnb Revenue Variations & Income Potential in Lignan-de-Bordeaux (2025)
Understanding the monthly revenue variations for Airbnb listings in Lignan-de-Bordeaux is key to maximizing your short term rental income potential. Seasonality significantly impacts earnings. Our analysis, based on data from the past 12 months, shows that the peak revenue month for STRs in Lignan-de-Bordeaux is typically August, while January often presents the lowest earnings, highlighting opportunities for strategic pricing adjustments during shoulder and low seasons. Explore the typical Airbnb income in Lignan-de-Bordeaux across different performance tiers:
- Best-in-class properties (Top 10%) achieve $6,118+ monthly, often utilizing dynamic pricing and superior guest experiences.
- Strong performing properties (Top 25%) earn $2,236 or more, indicating effective management and desirable locations/amenities.
- Typical properties (Median) generate around $1,129 per month, representing the average market performance.
- Entry-level properties (Bottom 25%) see earnings around $426, often with potential for optimization.
Average Monthly Airbnb Earnings Trend in Lignan-de-Bordeaux
Lignan-de-Bordeaux Airbnb Occupancy Rate Trends (2025)
Maximize your bookings by understanding the Lignan-de-Bordeaux STR occupancy trends. Seasonal demand shifts significantly influence how often properties are booked. Typically, Augustsees the highest demand (peak season occupancy), while January experiences the lowest (low season). Effective strategies, like adjusting minimum stays or offering promotions, can boost occupancy during slower periods. Here's how different property tiers perform in Lignan-de-Bordeaux:
- Best-in-class properties (Top 10%) achieve 57%+ occupancy, indicating high desirability and potentially optimized availability.
- Strong performing properties (Top 25%) maintain 46% or higher occupancy, suggesting good market fit and guest satisfaction.
- Typical properties (Median) have an occupancy rate around 31%.
- Entry-level properties (Bottom 25%) average 18% occupancy, potentially facing higher vacancy.
Average Monthly Occupancy Rate Trend in Lignan-de-Bordeaux
Average Daily Rate (ADR) Airbnb Trends in Lignan-de-Bordeaux (2025)
Effective short term rental pricing strategy in Lignan-de-Bordeaux involves understanding monthly ADR fluctuations. The Average Daily Rate (ADR) for Airbnb in Lignan-de-Bordeaux typically peaks in July and dips lowest during January. Leveraging Airbnb dynamic pricing tools or strategies based on this seasonality can significantly boost revenue. Here's a look at the typical nightly rates achieved:
- Best-in-class properties (Top 10%) command rates of $385+ per night, often due to premium features or locations.
- Strong performing properties (Top 25%) achieve nightly rates of $289 or more.
- Typical properties (Median) charge around $119 per night.
- Entry-level properties (Bottom 25%) earn around $80 per night.
Average Daily Rate (ADR) Trend by Month in Lignan-de-Bordeaux
Get Live Lignan-de-Bordeaux Market Intelligence 👇

Explore Real-time Analytics
Airbnb Seasonality Analysis & Trends in Lignan-de-Bordeaux (2025)
Peak Season (August, July, June)
- Revenue averages $3,373 per month
- Occupancy rates average 51.2%
- Daily rates average $219
Shoulder Season
- Revenue averages $1,940 per month
- Occupancy maintains around 29.2%
- Daily rates hold near $210
Low Season (January, March, November)
- Revenue drops to average $1,000 per month
- Occupancy decreases to average 22.5%
- Daily rates adjust to average $199
Seasonality Insights for Lignan-de-Bordeaux
- The Airbnb seasonality in Lignan-de-Bordeaux shows highly seasonal trends requiring careful strategy. While the sections above show seasonal averages, it's also insightful to look at the extremes:
- During the high season, the absolute peak month showcases Lignan-de-Bordeaux's highest earning potential, with monthly revenues capable of climbing to $3,932, occupancy reaching a high of 66.3%, and ADRs peaking at $221.
- Conversely, the slowest single month of the year, typically falling within the low season, marks the market's lowest point. In this month, revenue might dip to $426, occupancy could drop to 14.5%, and ADRs may adjust down to $190.
- Understanding both the seasonal averages and these monthly peaks and troughs in revenue, occupancy, and ADR is crucial for maximizing your Airbnb profit potential in Lignan-de-Bordeaux.
Seasonal Strategies for Maximizing Profit
- Peak Season: Maximize revenue through premium pricing and potentially longer minimum stays. Ensure high availability.
- Low Season: Offer competitive pricing, special promotions (e.g., extended stay discounts), and flexible cancellation policies. Target off-season travelers like remote workers or budget-conscious guests.
- Shoulder Seasons: Implement dynamic pricing that balances peak and low rates. Target weekend travelers or specific events. Offer slightly more flexible terms than peak season.
- Regularly analyze your own performance against these Lignan-de-Bordeaux seasonality benchmarks and adjust your pricing and availability strategy accordingly.
Best Areas for Airbnb Investment in Lignan-de-Bordeaux (2025)
Exploring the top neighborhoods for short-term rentals in Lignan-de-Bordeaux? This section highlights key areas, outlining why they are attractive for hosts and guests, along with notable local attractions. Consider these locations based on your target guest profile and investment strategy.
| Neighborhood / Area | Why Host Here? (Target Guests & Appeal) | Key Attractions & Landmarks |
|---|---|---|
| Lignan-sur-Orb | A charming village surrounded by vineyards and nature, ideal for those who enjoy wine tourism and a peaceful atmosphere. Popular with tourists looking to explore the scenic landscapes of the South of France. | Vineyard Tours, Canal du Midi, Local Markets, Historic Churches, Cycling Routes |
| Bordeaux City Centre | The vibrant heart of Bordeaux known for its beautiful architecture, restaurants, and cultural attractions. Perfect for tourists wanting to experience the urban life of Bordeaux along with its rich history. | Place de la Bourse, La Cité du Vin, Bordeaux Cathedral, Rue Sainte-Catherine, Jardin Public |
| Saint-Émilion | Famous for its wine production, this historic town attracts wine lovers and tourists alike. The picturesque streets and vineyards make it a perfect getaway destination. | Vineyards, Monolithic Church, Wine Estates, Historic Walled Town, Château Ausone |
| Cap Ferret | A stunning coastal village on the Atlantic Ocean, known for its beaches and fresh seafood. A great destination for those seeking a seaside experience away from the hustle of city life. | Dune du Pilat, Basin of Arcachon, Beachfront restaurants, Cycling paths, Lighthouse of Cap Ferret |
| Pessac | Home to beautiful parks and a significant amount of green space, this suburb of Bordeaux is attractive for families and those looking for a quieter stay while still close to the city. | Château Pape Clément, Parc Bordelais, Wine Cellars, Public Parks, Local Cafés |
| Mérignac | Located near Bordeaux, it's known for its international airport and accessibility, appealing to business travelers and those seeking easy connections. | Mérignac Airport, Shopping Centers, Local Parks, Cultural Events, Family-friendly Atmosphere |
| Arcachon | A beautiful coastal town famous for its beaches, the Dune du Pilat, and seafood cuisine. Attracts tourists interested in outdoor activities and relaxation by the sea. | Arcachon Bay, Dune du Pilat, Seafood Restaurants, Water Sports, Beach Activities |
| Cérons | A quaint village near Bordeaux known for wine production and its charming rural setting. Attracts those looking for a peaceful retreat in the French countryside. | Local Vineyards, Cérons Wine Production, Seine River Views, Nature Walks, Historic Charm |
Understanding Airbnb License Requirements & STR Laws in Lignan-de-Bordeaux (2025)
While Lignan-de-Bordeaux, Nouvelle-Aquitaine, France currently shows low STR regulations, specific Airbnb license requirements might still exist or change. Always verify the latest short term rental regulations and Airbnb license requirements directly with local government authorities for Lignan-de-Bordeaux to ensure full compliance before hosting.
(Source: AirROI data, 2025, based on 5% licensed listings)
Top Performing Airbnb Properties in Lignan-de-Bordeaux (2025)
Benchmark your potential! Explore examples of top-performing Airbnb properties in Lignan-de-Bordeauxbased on Trailing Twelve Month (TTM) revenue. Analyze their characteristics, revenue, occupancy rate, and ADR to understand what drives success in this market.
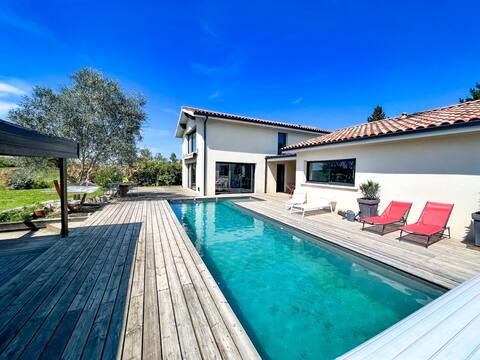
large villa, heated pool, near Bordeaux
Entire Place • 4 bedrooms
Gîte-de France-Ensuite-Countryside view
Entire Place • 6 bedrooms
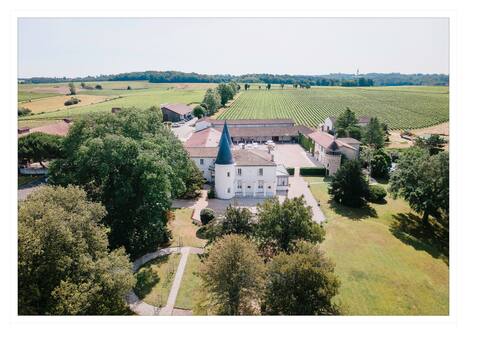
Domaine de Mondet, surrounded by vineyards!
Entire Place • 4 bedrooms

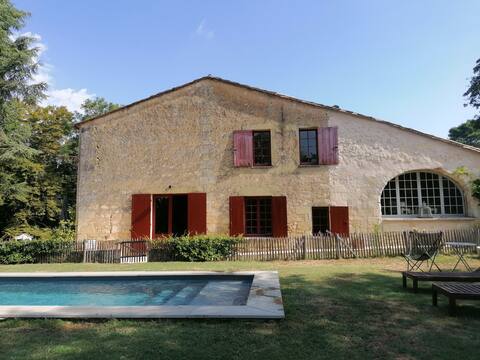
Holiday home la maison de la pimpine
Entire Place • 3 bedrooms
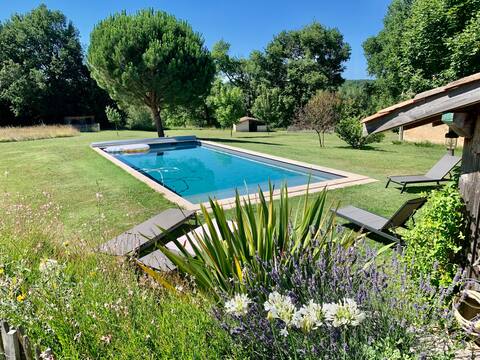
Vineyard house with a pool
Entire Place • 3 bedrooms

Rest and relaxation in the heart of the vineyards
Entire Place • 1 bedroom
Note: Performance varies based on location, size, amenities, seasonality, and management quality. Data reflects the past 12 months.
Top Performing Airbnb Hosts in Lignan-de-Bordeaux (2025)
Learn from the best! This table showcases top-performing Airbnb hosts in Lignan-de-Bordeaux based on the number of properties managed and estimated total revenue over the past year. Analyze their scale and performance metrics.
| Host Name | Properties | Grossing Revenue | Stay Reviews | Avg Rating |
|---|---|---|---|---|
| Stéphane | 5 | $80,908 | 18 | 2.43/5.0 |
| Stéphanie | 1 | $58,979 | 11 | 4.82/5.0 |
| Axelle | 1 | $36,944 | 13 | 5.00/5.0 |
| Frank | 1 | $35,441 | 25 | 4.96/5.0 |
| Marie Amélie | 1 | $29,033 | 5 | 5.00/5.0 |
| Marie-Noëlle | 2 | $25,699 | 34 | 4.99/5.0 |
| Simone & JC | 1 | $16,755 | 27 | 4.89/5.0 |
| Host #448714054 | 1 | $13,272 | 155 | 4.95/5.0 |
| Malia | 1 | $12,029 | 22 | 4.91/5.0 |
| Cendra | 1 | $7,907 | 4 | 5.00/5.0 |
Analyzing the strategies of top hosts, such as their property selection, pricing, and guest communication, can offer valuable lessons for optimizing your own Airbnb operations in Lignan-de-Bordeaux.
Dive Deeper: Advanced Lignan-de-Bordeaux STR Market Data (2025)
Ready to unlock more insights? AirROI provides access to advanced metrics and comprehensive Airbnb data for Lignan-de-Bordeaux. Explore detailed analytics beyond this report to refine your investment strategy, optimize pricing, and maximize your vacation rental profits.
Explore Advanced MetricsLignan-de-Bordeaux Short-Term Rental Market Composition (2025): Property & Room Types
Room Type Distribution
Property Type Distribution
Market Composition Insights for Lignan-de-Bordeaux
- The Lignan-de-Bordeaux Airbnb market composition is heavily skewed towards Entire Home/Apt listings, which make up 55% of the 20 active rentals. This indicates strong guest preference for privacy and space.
- However, a notable 40% share for Private Rooms suggests opportunities for budget-conscious travelers or hosts renting out spare rooms.
- Looking at the property type distribution in Lignan-de-Bordeaux, House properties are the most common (65%), reflecting the local real estate landscape.
- Houses represent a significant 65% portion, catering likely to families or larger groups.
- The presence of 20% Hotel/Boutique listings indicates integration with traditional hospitality.
Lignan-de-Bordeaux Airbnb Room Capacity Analysis (2025): Bedroom Distribution
Distribution of Listings by Number of Bedrooms
Room Capacity Insights for Lignan-de-Bordeaux
- The dominant room capacity in Lignan-de-Bordeaux is 1 bedroom listings, making up 25% of the market. This suggests a strong demand for properties suitable for couples or solo travelers.
- Together, 1 bedroom and 3 bedrooms properties represent 40.0% of the active Airbnb listings in Lignan-de-Bordeaux, indicating a high concentration in these sizes.
- A significant 35.0% of listings offer 3+ bedrooms, catering to larger groups and families seeking more space in Lignan-de-Bordeaux.
Lignan-de-Bordeaux Vacation Rental Guest Capacity Trends (2025)
Distribution of Listings by Guest Capacity
Guest Capacity Insights for Lignan-de-Bordeaux
- The most common guest capacity trend in Lignan-de-Bordeaux vacation rentals is listings accommodating 8+ guests (25%). This suggests the primary traveler segment is likely larger groups.
- Properties designed for 8+ guests and 4 guests dominate the Lignan-de-Bordeaux STR market, accounting for 45.0% of listings.
- 30.0% of properties accommodate 6+ guests, serving the market segment for larger families or group travel in Lignan-de-Bordeaux.
- On average, properties in Lignan-de-Bordeaux are equipped to host 3.5 guests.
Lignan-de-Bordeaux Airbnb Booking Patterns (2025): Available vs. Booked Days
Available Days Distribution
Booked Days Distribution
Booking Pattern Insights for Lignan-de-Bordeaux
- The most common availability pattern in Lignan-de-Bordeaux falls within the 271-366 days range, representing 60% of listings. This suggests many properties have significant open periods on their calendars.
- Approximately 95.0% of listings show high availability (181+ days open annually), indicating potential for increased bookings or specific owner usage patterns.
- For booked days, the 91-180 days range is most frequent in Lignan-de-Bordeaux (45%), reflecting common guest stay durations or potential owner blocking patterns.
- A notable 10.0% of properties secure long booking periods (181+ days booked per year), highlighting successful long-term rental strategies or significant owner usage.
Lignan-de-Bordeaux Airbnb Minimum Stay Requirements Analysis
Distribution of Listings by Minimum Night Requirement
1 Night
9 listings
52.9% of total
2 Nights
3 listings
17.6% of total
3 Nights
1 listings
5.9% of total
4-6 Nights
1 listings
5.9% of total
7-29 Nights
2 listings
11.8% of total
30+ Nights
1 listings
5.9% of total
Key Insights
- The most prevalent minimum stay requirement in Lignan-de-Bordeaux is 1 Night, adopted by 52.9% of listings. This highlights the market's preference for shorter, flexible bookings.
- A strong majority (70.5%) of the Lignan-de-Bordeaux Airbnb data shows acceptance of very short stays (1-2 nights), indicating a dynamic, high-turnover market.
Recommendations
- Align with the market by considering a 1 Night minimum stay, as 52.9% of Lignan-de-Bordeaux hosts use this setting.
- Explore offering discounts for stays of 30+ nights to attract the 5.9% of the market seeking extended stays.
- Adjust minimum nights based on seasonality – potentially shorter during low season and longer during peak demand periods in Lignan-de-Bordeaux.
Lignan-de-Bordeaux Airbnb Cancellation Policy Trends Analysis (2025)
Flexible
4 listings
21.1% of total
Moderate
9 listings
47.4% of total
Firm
2 listings
10.5% of total
Strict
4 listings
21.1% of total
Cancellation Policy Insights for Lignan-de-Bordeaux
- The prevailing Airbnb cancellation policy trend in Lignan-de-Bordeaux is Moderate, used by 47.4% of listings.
- There's a relatively balanced mix between guest-friendly (68.5%) and stricter (31.6%) policies, offering choices for different guest needs.
Recommendations for Hosts
- Consider adopting a Moderate policy to align with the 47.4% market standard in Lignan-de-Bordeaux.
- Regularly review your cancellation policy against competitors and market demand shifts in Lignan-de-Bordeaux.
Lignan-de-Bordeaux STR Booking Lead Time Analysis (2025)
Average Booking Lead Time by Month
Booking Lead Time Insights for Lignan-de-Bordeaux
- The overall average booking lead time for vacation rentals in Lignan-de-Bordeaux is 87 days.
- Guests book furthest in advance for stays during July (average 148 days), likely coinciding with peak travel demand or local events.
- The shortest booking windows occur for stays in April (average 45 days), indicating more last-minute travel plans during this time.
- Seasonally, Summer (131 days avg.) sees the longest lead times, while Winter (61 days avg.) has the shortest, reflecting typical travel planning cycles.
Recommendations for Hosts
- Use the overall average lead time (87 days) as a baseline for your pricing and availability strategy in Lignan-de-Bordeaux.
- For July stays, consider implementing length-of-stay discounts or slightly higher rates for bookings made less than 148 days out to capitalize on advance planning.
- Target marketing efforts for the Summer season well in advance (at least 131 days) to capture early planners.
- Monitor your own booking lead times against these Lignan-de-Bordeaux averages to identify opportunities for dynamic pricing adjustments.
Popular & Essential Airbnb Amenities in Lignan-de-Bordeaux (2025)
Amenity Prevalence
Amenity Insights for Lignan-de-Bordeaux
- Essential amenities in Lignan-de-Bordeaux that guests expect include: Free parking on premises. Lacking these (this) could significantly impact bookings.
- Popular amenities like Wifi, Heating, Bed linens are common but not universal. Offering these can provide a competitive edge.
- Warning: Wifi is not universally provided but is considered essential globally. Ensure reliable Wifi is offered.
Recommendations for Hosts
- Ensure your listing includes all essential amenities for Lignan-de-Bordeaux: Free parking on premises.
- Prioritize adding missing essentials: Free parking on premises.
- Consider adding popular differentiators like Wifi or Heating to increase appeal.
- Highlight unique or less common amenities you offer (e.g., hot tub, dedicated workspace, EV charger) in your listing description and photos.
- Regularly check competitor amenities in Lignan-de-Bordeaux to stay competitive.
Lignan-de-Bordeaux Airbnb Guest Demographics & Profile Analysis (2025)
Guest Profile Summary for Lignan-de-Bordeaux
- The typical guest profile for Airbnb in Lignan-de-Bordeaux consists of a mix of domestic (57%) and international guests, often arriving from nearby Bordeaux, typically belonging to the Post-2000s (Gen Z/Alpha) group (50%), primarily speaking French or English.
- Domestic travelers account for 57.1% of guests.
- Key international markets include France (57.1%) and United Kingdom (11%).
- Top languages spoken are French (38.9%) followed by English (31.1%).
- A significant demographic segment is the Post-2000s (Gen Z/Alpha) group, representing 50% of guests.
Recommendations for Hosts
- Balance marketing efforts between domestic and international channels based on the guest mix.
- Tailor amenities and listing descriptions to appeal to the dominant Post-2000s (Gen Z/Alpha) demographic (e.g., highlight fast WiFi, smart home features, local guides).
- Highlight unique local experiences or amenities relevant to the primary guest profile.
- Consider seasonal promotions aligned with peak travel times for key origin markets.
Nearby Short-Term Rental Market Comparison
How does the Lignan-de-Bordeaux Airbnb market stack up against its neighbors? Compare key performance metrics like average monthly revenue, ADR, and occupancy rates in surrounding areas to understand the broader regional STR landscape.
| Market | Active Properties | Monthly Revenue | Daily Rate | Avg. Occupancy |
|---|---|---|---|---|
| San Sebastián | 1,426 | $3,546 | $262.81 | 49% |
| Saint-Laurent-des-Combes | 11 | $3,526 | $706.18 | 23% |
| Astaffort | 10 | $3,393 | $314.20 | 35% |
| Cénac | 18 | $2,773 | $268.58 | 53% |
| Cérons | 11 | $2,635 | $196.16 | 39% |
| Galgon | 12 | $2,599 | $210.34 | 48% |
| Hernani | 11 | $2,572 | $345.16 | 40% |
| Eynesse | 14 | $2,564 | $282.87 | 36% |
| Bourrou | 10 | $2,475 | $247.57 | 36% |
| Saint-Hippolyte | 10 | $2,443 | $204.98 | 44% |