Le Porge Airbnb Market Analysis 2025: Short Term Rental Data & Vacation Rental Statistics in Nouvelle-Aquitaine, France
Is Airbnb profitable in Le Porge in 2025? Explore comprehensive Airbnb analytics for Le Porge, Nouvelle-Aquitaine, France to uncover income potential. This 2025 STR market report for Le Porge, based on AirROI data from April 2024 to March 2025, reveals key trends in the niche market of 132 active listings.
Whether you're considering an Airbnb investment in Le Porge, optimizing your existing vacation rental, or exploring rental arbitrage opportunities, understanding the Le Porge Airbnb data is crucial. Understanding the local regulations is key to maximizing your short term rental income potential. Let's dive into the specifics.
Key Le Porge Airbnb Performance Metrics Overview
Monthly Airbnb Revenue Variations & Income Potential in Le Porge (2025)
Understanding the monthly revenue variations for Airbnb listings in Le Porge is key to maximizing your short term rental income potential. Seasonality significantly impacts earnings. Our analysis, based on data from the past 12 months, shows that the peak revenue month for STRs in Le Porge is typically August, while February often presents the lowest earnings, highlighting opportunities for strategic pricing adjustments during shoulder and low seasons. Explore the typical Airbnb income in Le Porge across different performance tiers:
- Best-in-class properties (Top 10%) achieve $3,319+ monthly, often utilizing dynamic pricing and superior guest experiences.
- Strong performing properties (Top 25%) earn $2,113 or more, indicating effective management and desirable locations/amenities.
- Typical properties (Median) generate around $1,207 per month, representing the average market performance.
- Entry-level properties (Bottom 25%) see earnings around $634, often with potential for optimization.
Average Monthly Airbnb Earnings Trend in Le Porge
Le Porge Airbnb Occupancy Rate Trends (2025)
Maximize your bookings by understanding the Le Porge STR occupancy trends. Seasonal demand shifts significantly influence how often properties are booked. Typically, Augustsees the highest demand (peak season occupancy), while January experiences the lowest (low season). Effective strategies, like adjusting minimum stays or offering promotions, can boost occupancy during slower periods. Here's how different property tiers perform in Le Porge:
- Best-in-class properties (Top 10%) achieve 63%+ occupancy, indicating high desirability and potentially optimized availability.
- Strong performing properties (Top 25%) maintain 50% or higher occupancy, suggesting good market fit and guest satisfaction.
- Typical properties (Median) have an occupancy rate around 32%.
- Entry-level properties (Bottom 25%) average 16% occupancy, potentially facing higher vacancy.
Average Monthly Occupancy Rate Trend in Le Porge
Average Daily Rate (ADR) Airbnb Trends in Le Porge (2025)
Effective short term rental pricing strategy in Le Porge involves understanding monthly ADR fluctuations. The Average Daily Rate (ADR) for Airbnb in Le Porge typically peaks in July and dips lowest during March. Leveraging Airbnb dynamic pricing tools or strategies based on this seasonality can significantly boost revenue. Here's a look at the typical nightly rates achieved:
- Best-in-class properties (Top 10%) command rates of $281+ per night, often due to premium features or locations.
- Strong performing properties (Top 25%) achieve nightly rates of $178 or more.
- Typical properties (Median) charge around $118 per night.
- Entry-level properties (Bottom 25%) earn around $84 per night.
Average Daily Rate (ADR) Trend by Month in Le Porge
Get Live Le Porge Market Intelligence 👇

Explore Real-time Analytics
Airbnb Seasonality Analysis & Trends in Le Porge (2025)
Peak Season (August, July, June)
- Revenue averages $2,956 per month
- Occupancy rates average 54.6%
- Daily rates average $159
Shoulder Season
- Revenue averages $1,432 per month
- Occupancy maintains around 30.7%
- Daily rates hold near $146
Low Season (January, February, March)
- Revenue drops to average $688 per month
- Occupancy decreases to average 19.9%
- Daily rates adjust to average $138
Seasonality Insights for Le Porge
- The Airbnb seasonality in Le Porge shows highly seasonal trends requiring careful strategy. While the sections above show seasonal averages, it's also insightful to look at the extremes:
- During the high season, the absolute peak month showcases Le Porge's highest earning potential, with monthly revenues capable of climbing to $3,740, occupancy reaching a high of 70.6%, and ADRs peaking at $162.
- Conversely, the slowest single month of the year, typically falling within the low season, marks the market's lowest point. In this month, revenue might dip to $619, occupancy could drop to 18.5%, and ADRs may adjust down to $138.
- Understanding both the seasonal averages and these monthly peaks and troughs in revenue, occupancy, and ADR is crucial for maximizing your Airbnb profit potential in Le Porge.
Seasonal Strategies for Maximizing Profit
- Peak Season: Maximize revenue through premium pricing and potentially longer minimum stays. Ensure high availability.
- Low Season: Offer competitive pricing, special promotions (e.g., extended stay discounts), and flexible cancellation policies. Target off-season travelers like remote workers or budget-conscious guests.
- Shoulder Seasons: Implement dynamic pricing that balances peak and low rates. Target weekend travelers or specific events. Offer slightly more flexible terms than peak season.
- Regularly analyze your own performance against these Le Porge seasonality benchmarks and adjust your pricing and availability strategy accordingly.
Best Areas for Airbnb Investment in Le Porge (2025)
Exploring the top neighborhoods for short-term rentals in Le Porge? This section highlights key areas, outlining why they are attractive for hosts and guests, along with notable local attractions. Consider these locations based on your target guest profile and investment strategy.
| Neighborhood / Area | Why Host Here? (Target Guests & Appeal) | Key Attractions & Landmarks |
|---|---|---|
| Le Porge Beach | A beautiful coastal area known for its sandy beaches and nature reserves. Ideal for vacationers looking for a peaceful retreat by the ocean with opportunities for outdoor activities. | Le Porge Beach, Côte d'Argent, Nature Reserve of the Cousseau, Ocean Surfing, Dune Hiking |
| Lacanau | Nearby Lacanau is famous for its surfing spots and vibrant beach culture. Popular with both families and young adults seeking water sports and nightlife options. | Lacanau Ocean, Surfing Schools, Lake Lacanau, Beach Clubs, Cycling Trails |
| Soulac-sur-Mer | A charming seaside town with a mix of traditional French architecture and beach life. Attracts visitors for its relaxed atmosphere and historical sites. | Basilique Notre-Dame de la Fin des Terres, Soulac Market, Local Wineries, Coastal Bike Paths, Gastronomic Restaurants |
| Cap Ferret | Quaint village known for its stunning scenery and oyster farms. Great for tourists looking for a serene getaway with gourmet dining experiences. | Cap Ferret Lighthouse, Oyster Tasting Tours, Bay of Arcachon, Les plages de Cap Ferret, Nature Trails |
| Arcachon | A popular resort town with beautiful beaches and a lively promenade. Attracts families and tourists looking to enjoy the beach and local seafood cuisine. | Dune du Pilat, Arcachon Bay, Aquarium Museum, Seaside Promenade, Boat Tours |
| Andernos-les-Bains | Known for its relaxing atmosphere and health-focused retreats. Popular with visitors seeking wellness and relaxation by the bay. | Andernos Beach, Jetée d'Andernos, Oyster Farms, Bicycle Rentals, Local Spas |
| Carcans | A scenic village surrounded by lakes and forests. Appeals to nature lovers looking for hiking, biking, and water activities in a tranquil setting. | Carcans-Maubuisson Lake, Vélodyssée Cycling Route, Nature Reserves, Watersports, Forests |
| Mios | A small town offering a taste of rural French life. Attracts visitors looking to explore the nearby lakes and vineyards. | Mios Old Town, Local Vineyards, Lakes of Sanguinet, Canoeing, Cultural Festivals |
Understanding Airbnb License Requirements & STR Laws in Le Porge (2025)
With 14% of listings showing registration in 2025, understanding potential Airbnb license requirements is crucial in Le Porge. Always verify the latest short term rental regulations and Airbnb license requirements directly with local government authorities for Le Porge to ensure full compliance before hosting.
(Source: AirROI data, 2025, based on 14% licensed listings)
Top Performing Airbnb Properties in Le Porge (2025)
Benchmark your potential! Explore examples of top-performing Airbnb properties in Le Porgebased on Trailing Twelve Month (TTM) revenue. Analyze their characteristics, revenue, occupancy rate, and ADR to understand what drives success in this market.
Villa L'Océane swimming pool in a green setting
Entire Place • 4 bedrooms
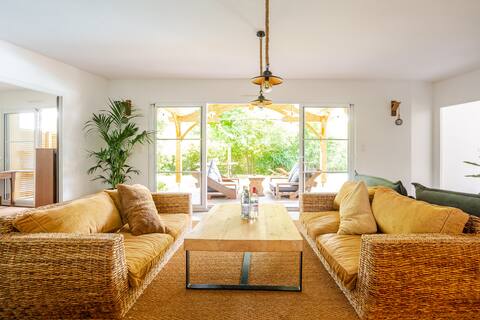
Villa Bourdiou
Entire Place • 3 bedrooms
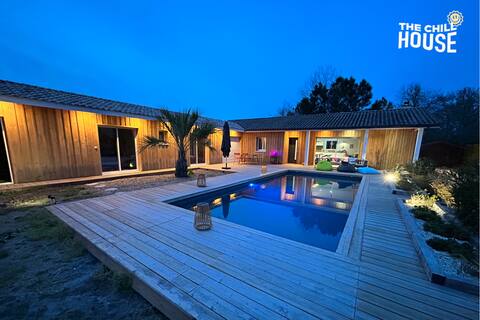
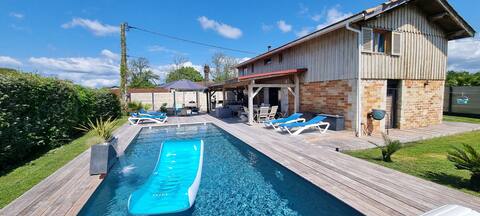
The Chill House_Villa with pool close to the ocean
Entire Place • 5 bedrooms
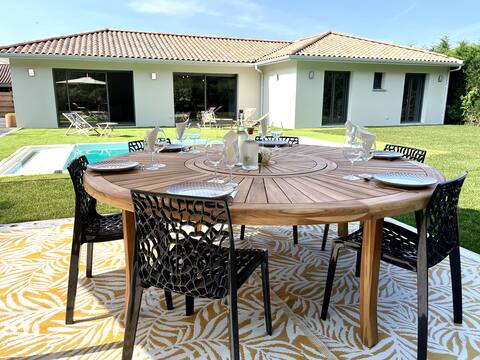
Villa Dolce Vista, Piscine
Entire Place • 4 bedrooms
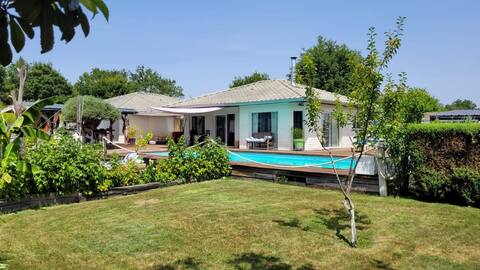
Maison Le Porge with pool 6 people
Entire Place • 3 bedrooms
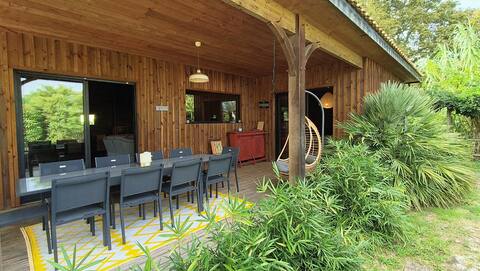
Beautiful house with large pool
Entire Place • 3 bedrooms
Note: Performance varies based on location, size, amenities, seasonality, and management quality. Data reflects the past 12 months.
Top Performing Airbnb Hosts in Le Porge (2025)
Learn from the best! This table showcases top-performing Airbnb hosts in Le Porge based on the number of properties managed and estimated total revenue over the past year. Analyze their scale and performance metrics.
| Host Name | Properties | Grossing Revenue | Stay Reviews | Avg Rating |
|---|---|---|---|---|
| Elsa | 1 | $61,945 | 9 | 4.78/5.0 |
| Etienne | 1 | $57,350 | 13 | 5.00/5.0 |
| Olivier | 6 | $53,236 | 35 | 4.14/5.0 |
| Sylvain | 2 | $47,450 | 96 | 4.99/5.0 |
| Guillaume | 1 | $44,358 | 7 | 4.86/5.0 |
| Pascal | 4 | $43,248 | 63 | 4.89/5.0 |
| Sandy | 1 | $42,494 | 9 | 4.56/5.0 |
| Eymeric | 1 | $36,948 | 20 | 4.95/5.0 |
| Christophe | 1 | $36,056 | 7 | 4.71/5.0 |
| Pascale | 1 | $33,352 | 12 | 4.83/5.0 |
Analyzing the strategies of top hosts, such as their property selection, pricing, and guest communication, can offer valuable lessons for optimizing your own Airbnb operations in Le Porge.
Dive Deeper: Advanced Le Porge STR Market Data (2025)
Ready to unlock more insights? AirROI provides access to advanced metrics and comprehensive Airbnb data for Le Porge. Explore detailed analytics beyond this report to refine your investment strategy, optimize pricing, and maximize your vacation rental profits.
Explore Advanced MetricsLe Porge Short-Term Rental Market Composition (2025): Property & Room Types
Room Type Distribution
Property Type Distribution
Market Composition Insights for Le Porge
- The Le Porge Airbnb market composition is heavily skewed towards Entire Home/Apt listings, which make up 96.2% of the 132 active rentals. This indicates strong guest preference for privacy and space.
- Looking at the property type distribution in Le Porge, House properties are the most common (85.6%), reflecting the local real estate landscape.
- Houses represent a significant 85.6% portion, catering likely to families or larger groups.
- The presence of 6.1% Hotel/Boutique listings indicates integration with traditional hospitality.
- Smaller segments like outdoor/unique, others (combined 1.6%) offer potential for unique stay experiences.
Le Porge Airbnb Room Capacity Analysis (2025): Bedroom Distribution
Distribution of Listings by Number of Bedrooms
Room Capacity Insights for Le Porge
- The dominant room capacity in Le Porge is 1 bedroom listings, making up 29.5% of the market. This suggests a strong demand for properties suitable for couples or solo travelers.
- Together, 1 bedroom and 2 bedrooms properties represent 54.5% of the active Airbnb listings in Le Porge, indicating a high concentration in these sizes.
- A significant 38.6% of listings offer 3+ bedrooms, catering to larger groups and families seeking more space in Le Porge.
Le Porge Vacation Rental Guest Capacity Trends (2025)
Distribution of Listings by Guest Capacity
Guest Capacity Insights for Le Porge
- The most common guest capacity trend in Le Porge vacation rentals is listings accommodating 4 guests (26.5%). This suggests the primary traveler segment is likely small families or groups.
- Properties designed for 4 guests and 2 guests dominate the Le Porge STR market, accounting for 47.0% of listings.
- 36.4% of properties accommodate 6+ guests, serving the market segment for larger families or group travel in Le Porge.
- On average, properties in Le Porge are equipped to host 4.7 guests.
Le Porge Airbnb Booking Patterns (2025): Available vs. Booked Days
Available Days Distribution
Booked Days Distribution
Booking Pattern Insights for Le Porge
- The most common availability pattern in Le Porge falls within the 271-366 days range, representing 61.4% of listings. This suggests many properties have significant open periods on their calendars.
- Approximately 93.2% of listings show high availability (181+ days open annually), indicating potential for increased bookings or specific owner usage patterns.
- For booked days, the 31-90 days range is most frequent in Le Porge (37.9%), reflecting common guest stay durations or potential owner blocking patterns.
- A notable 8.4% of properties secure long booking periods (181+ days booked per year), highlighting successful long-term rental strategies or significant owner usage.
Le Porge Airbnb Minimum Stay Requirements Analysis
Distribution of Listings by Minimum Night Requirement
1 Night
13 listings
10.7% of total
2 Nights
26 listings
21.5% of total
3 Nights
32 listings
26.4% of total
4-6 Nights
22 listings
18.2% of total
7-29 Nights
18 listings
14.9% of total
30+ Nights
10 listings
8.3% of total
Key Insights
- The most prevalent minimum stay requirement in Le Porge is 3 Nights, adopted by 26.4% of listings. This highlights the market's preference for longer commitments.
Recommendations
- Align with the market by considering a 3 Nights minimum stay, as 26.4% of Le Porge hosts use this setting.
- If feasible, allowing 1-night stays, especially midweek or during low season, could capture last-minute bookings, as only 10.7% currently do.
- Explore offering discounts for stays of 30+ nights to attract the 8.3% of the market seeking extended stays.
- Adjust minimum nights based on seasonality – potentially shorter during low season and longer during peak demand periods in Le Porge.
Le Porge Airbnb Cancellation Policy Trends Analysis (2025)
Refundable
1 listings
0.8% of total
Super Strict 30 Days
1 listings
0.8% of total
Super Strict 60 Days
1 listings
0.8% of total
Flexible
23 listings
19.2% of total
Moderate
17 listings
14.2% of total
Firm
35 listings
29.2% of total
Strict
42 listings
35% of total
Cancellation Policy Insights for Le Porge
- The prevailing Airbnb cancellation policy trend in Le Porge is Strict, used by 35% of listings.
- A majority (64.2%) of hosts in Le Porge utilize Firm or Strict policies, indicating a market where hosts prioritize booking security.
Recommendations for Hosts
- Consider adopting a Strict policy to align with the 35% market standard in Le Porge.
- With 35% using Strict terms, this is a viable option in Le Porge, particularly for high-value properties or during peak demand periods.
- Regularly review your cancellation policy against competitors and market demand shifts in Le Porge.
Le Porge STR Booking Lead Time Analysis (2025)
Average Booking Lead Time by Month
Booking Lead Time Insights for Le Porge
- The overall average booking lead time for vacation rentals in Le Porge is 76 days.
- Guests book furthest in advance for stays during July (average 125 days), likely coinciding with peak travel demand or local events.
- The shortest booking windows occur for stays in February (average 9 days), indicating more last-minute travel plans during this time.
- Seasonally, Summer (108 days avg.) sees the longest lead times, while Winter (24 days avg.) has the shortest, reflecting typical travel planning cycles.
Recommendations for Hosts
- Use the overall average lead time (76 days) as a baseline for your pricing and availability strategy in Le Porge.
- For July stays, consider implementing length-of-stay discounts or slightly higher rates for bookings made less than 125 days out to capitalize on advance planning.
- During February, focus on last-minute booking availability and promotions, as guests book with very short notice (9 days avg.).
- Target marketing efforts for the Summer season well in advance (at least 108 days) to capture early planners.
- Monitor your own booking lead times against these Le Porge averages to identify opportunities for dynamic pricing adjustments.
Popular & Essential Airbnb Amenities in Le Porge (2025)
Amenity Prevalence
Amenity Insights for Le Porge
- Essential amenities in Le Porge that guests expect include: Free parking on premises, Kitchen. Lacking these (any) could significantly impact bookings.
- Popular amenities like Heating, Hot water, Dishes and silverware are common but not universal. Offering these can provide a competitive edge.
Recommendations for Hosts
- Ensure your listing includes all essential amenities for Le Porge: Free parking on premises, Kitchen.
- Prioritize adding missing essentials: Free parking on premises, Kitchen.
- Consider adding popular differentiators like Heating or Hot water to increase appeal.
- Highlight unique or less common amenities you offer (e.g., hot tub, dedicated workspace, EV charger) in your listing description and photos.
- Regularly check competitor amenities in Le Porge to stay competitive.
Le Porge Airbnb Guest Demographics & Profile Analysis (2025)
Guest Profile Summary for Le Porge
- The typical guest profile for Airbnb in Le Porge consists of primarily domestic travelers (73%), often arriving from nearby Paris, typically belonging to the Post-2000s (Gen Z/Alpha) group (50%), primarily speaking French or English.
- Domestic travelers account for 72.7% of guests.
- Key international markets include France (72.7%) and Germany (10.8%).
- Top languages spoken are French (36.3%) followed by English (36.3%).
- A significant demographic segment is the Post-2000s (Gen Z/Alpha) group, representing 50% of guests.
Recommendations for Hosts
- Target domestic marketing efforts towards travelers from Paris and Bordeaux.
- Tailor amenities and listing descriptions to appeal to the dominant Post-2000s (Gen Z/Alpha) demographic (e.g., highlight fast WiFi, smart home features, local guides).
- Highlight unique local experiences or amenities relevant to the primary guest profile.
- Consider seasonal promotions aligned with peak travel times for key origin markets.
Nearby Short-Term Rental Market Comparison
How does the Le Porge Airbnb market stack up against its neighbors? Compare key performance metrics like average monthly revenue, ADR, and occupancy rates in surrounding areas to understand the broader regional STR landscape.
| Market | Active Properties | Monthly Revenue | Daily Rate | Avg. Occupancy |
|---|---|---|---|---|
| San Sebastián | 1,426 | $3,546 | $262.81 | 49% |
| Saint-Laurent-des-Combes | 11 | $3,526 | $706.18 | 23% |
| Gautegiz Arteaga | 21 | $2,865 | $293.66 | 38% |
| Cénac | 18 | $2,773 | $268.58 | 53% |
| Cérons | 11 | $2,635 | $196.16 | 39% |
| Barrika | 13 | $2,629 | $314.61 | 41% |
| Galgon | 12 | $2,599 | $210.34 | 48% |
| Hernani | 11 | $2,572 | $345.16 | 40% |
| Saint-Hippolyte | 10 | $2,443 | $204.98 | 44% |
| Dima | 11 | $2,422 | $332.91 | 42% |