Lalinde Airbnb Market Analysis 2025: Short Term Rental Data & Vacation Rental Statistics in Nouvelle-Aquitaine, France
Is Airbnb profitable in Lalinde in 2025? Explore comprehensive Airbnb analytics for Lalinde, Nouvelle-Aquitaine, France to uncover income potential. This 2025 STR market report for Lalinde, based on AirROI data from April 2024 to March 2025, reveals key trends in the niche market of 47 active listings.
Whether you're considering an Airbnb investment in Lalinde, optimizing your existing vacation rental, or exploring rental arbitrage opportunities, understanding the Lalinde Airbnb data is crucial. Leveraging the low regulation environment is key to maximizing your short term rental income potential. Let's dive into the specifics.
Key Lalinde Airbnb Performance Metrics Overview
Monthly Airbnb Revenue Variations & Income Potential in Lalinde (2025)
Understanding the monthly revenue variations for Airbnb listings in Lalinde is key to maximizing your short term rental income potential. Seasonality significantly impacts earnings. Our analysis, based on data from the past 12 months, shows that the peak revenue month for STRs in Lalinde is typically August, while March often presents the lowest earnings, highlighting opportunities for strategic pricing adjustments during shoulder and low seasons. Explore the typical Airbnb income in Lalinde across different performance tiers:
- Best-in-class properties (Top 10%) achieve $3,570+ monthly, often utilizing dynamic pricing and superior guest experiences.
- Strong performing properties (Top 25%) earn $1,925 or more, indicating effective management and desirable locations/amenities.
- Typical properties (Median) generate around $1,224 per month, representing the average market performance.
- Entry-level properties (Bottom 25%) see earnings around $603, often with potential for optimization.
Average Monthly Airbnb Earnings Trend in Lalinde
Lalinde Airbnb Occupancy Rate Trends (2025)
Maximize your bookings by understanding the Lalinde STR occupancy trends. Seasonal demand shifts significantly influence how often properties are booked. Typically, Augustsees the highest demand (peak season occupancy), while March experiences the lowest (low season). Effective strategies, like adjusting minimum stays or offering promotions, can boost occupancy during slower periods. Here's how different property tiers perform in Lalinde:
- Best-in-class properties (Top 10%) achieve 75%+ occupancy, indicating high desirability and potentially optimized availability.
- Strong performing properties (Top 25%) maintain 59% or higher occupancy, suggesting good market fit and guest satisfaction.
- Typical properties (Median) have an occupancy rate around 38%.
- Entry-level properties (Bottom 25%) average 25% occupancy, potentially facing higher vacancy.
Average Monthly Occupancy Rate Trend in Lalinde
Average Daily Rate (ADR) Airbnb Trends in Lalinde (2025)
Effective short term rental pricing strategy in Lalinde involves understanding monthly ADR fluctuations. The Average Daily Rate (ADR) for Airbnb in Lalinde typically peaks in November and dips lowest during April. Leveraging Airbnb dynamic pricing tools or strategies based on this seasonality can significantly boost revenue. Here's a look at the typical nightly rates achieved:
- Best-in-class properties (Top 10%) command rates of $297+ per night, often due to premium features or locations.
- Strong performing properties (Top 25%) achieve nightly rates of $205 or more.
- Typical properties (Median) charge around $103 per night.
- Entry-level properties (Bottom 25%) earn around $65 per night.
Average Daily Rate (ADR) Trend by Month in Lalinde
Get Live Lalinde Market Intelligence 👇

Explore Real-time Analytics
Airbnb Seasonality Analysis & Trends in Lalinde (2025)
Peak Season (August, July, May)
- Revenue averages $2,613 per month
- Occupancy rates average 56.0%
- Daily rates average $161
Shoulder Season
- Revenue averages $1,450 per month
- Occupancy maintains around 38.1%
- Daily rates hold near $159
Low Season (January, March, November)
- Revenue drops to average $788 per month
- Occupancy decreases to average 33.8%
- Daily rates adjust to average $166
Seasonality Insights for Lalinde
- The Airbnb seasonality in Lalinde shows highly seasonal trends requiring careful strategy. While the sections above show seasonal averages, it's also insightful to look at the extremes:
- During the high season, the absolute peak month showcases Lalinde's highest earning potential, with monthly revenues capable of climbing to $3,257, occupancy reaching a high of 69.0%, and ADRs peaking at $167.
- Conversely, the slowest single month of the year, typically falling within the low season, marks the market's lowest point. In this month, revenue might dip to $684, occupancy could drop to 29.0%, and ADRs may adjust down to $154.
- Understanding both the seasonal averages and these monthly peaks and troughs in revenue, occupancy, and ADR is crucial for maximizing your Airbnb profit potential in Lalinde.
Seasonal Strategies for Maximizing Profit
- Peak Season: Maximize revenue through premium pricing and potentially longer minimum stays. Ensure high availability.
- Low Season: Offer competitive pricing, special promotions (e.g., extended stay discounts), and flexible cancellation policies. Target off-season travelers like remote workers or budget-conscious guests.
- Shoulder Seasons: Implement dynamic pricing that balances peak and low rates. Target weekend travelers or specific events. Offer slightly more flexible terms than peak season.
- Regularly analyze your own performance against these Lalinde seasonality benchmarks and adjust your pricing and availability strategy accordingly.
Best Areas for Airbnb Investment in Lalinde (2025)
Exploring the top neighborhoods for short-term rentals in Lalinde? This section highlights key areas, outlining why they are attractive for hosts and guests, along with notable local attractions. Consider these locations based on your target guest profile and investment strategy.
| Neighborhood / Area | Why Host Here? (Target Guests & Appeal) | Key Attractions & Landmarks |
|---|---|---|
| Lalinde Old Town | Charming historic town center with well-preserved medieval architecture. A perfect location for tourists interested in history, culture, and local cuisine. | Lalinde Church, Place de l'Ancien Évêché, La rivière Dordogne, Café de la Mairie, Local artisan shops |
| Dordogne Riverbank | Scenic area along the Dordogne River with beautiful landscapes and peaceful retreats. Attractive to visitors looking for nature and tranquility. | Dordogne River Cruises, Fishing spots, Walking trails, Picnic areas by the river, Cycling routes |
| Lalinde Market Square | Vibrant market square known for its weekly market and community events. Ideal for travelers seeking local culture and fresh produce. | Weekly Farmer's Market, Local food vendors, Artisan crafts, Culture events, Community gatherings |
| Bordeaux Day Trip Access | Close proximity to Bordeaux, a major travel hub known for its wine and gastronomy. Appeals to wine lovers and urban explorers. | Wine tours, Cité du Vin, Bordeaux historic center, Shopping in Bordeaux, Gastronomy tours |
| Nearby Castles | Proximity to historical castles and chateaux popular with tourists. Great for visitors seeking cultural and historical experiences. | Château de Lanquais, Château de Biron, Château de Monbazillac, Castle tours, Historical reenactments |
| Nature Trails | Surrounding countryside is rich with hiking and nature trails. Attracts outdoor enthusiasts looking for adventure and exploration. | GR 652 hiking trail, Bird watching areas, Cycling paths, Guided nature tours, Picnicking spots |
| Local Wine Regions | Part of the renowned wine regions of the Dordogne, attracting wine tourists and enthusiasts. Perfect for hosting wine-themed stays. | Wine tasting experiences, Vineyard tours, Wine festivals, Local wineries, Gastronomic pairings |
| Cultural Festivals | The area hosts multiple cultural festivals throughout the year, drawing visitors interested in local traditions and celebrations. | Lalinde Festival of Lights, Medieval Festival, Music and Arts Festivals, Local fairs, Cultural events in nearby towns |
Understanding Airbnb License Requirements & STR Laws in Lalinde (2025)
While Lalinde, Nouvelle-Aquitaine, France currently shows low STR regulations, specific Airbnb license requirements might still exist or change. Always verify the latest short term rental regulations and Airbnb license requirements directly with local government authorities for Lalinde to ensure full compliance before hosting.
(Source: AirROI data, 2025, based on 6% licensed listings)
Top Performing Airbnb Properties in Lalinde (2025)
Benchmark your potential! Explore examples of top-performing Airbnb properties in Lalindebased on Trailing Twelve Month (TTM) revenue. Analyze their characteristics, revenue, occupancy rate, and ADR to understand what drives success in this market.

Watermill with private pool in the Dordogne
Entire Place • 3 bedrooms

Elegant 7 bedr,5 bathroom, Pool, aircon
Entire Place • 7 bedrooms
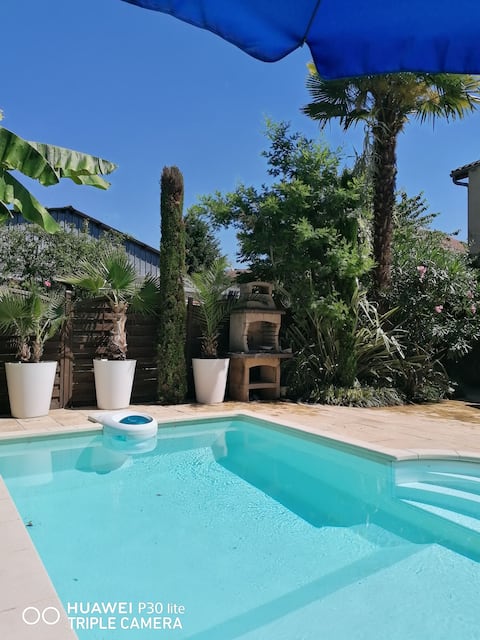
Entire house the olive patio pool
Entire Place • 3 bedrooms

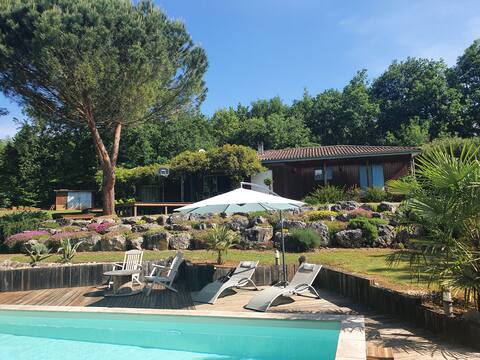
Villa + pool, in a beautiful natural space
Entire Place • 3 bedrooms
Wooden villa with private pool
Entire Place • 3 bedrooms
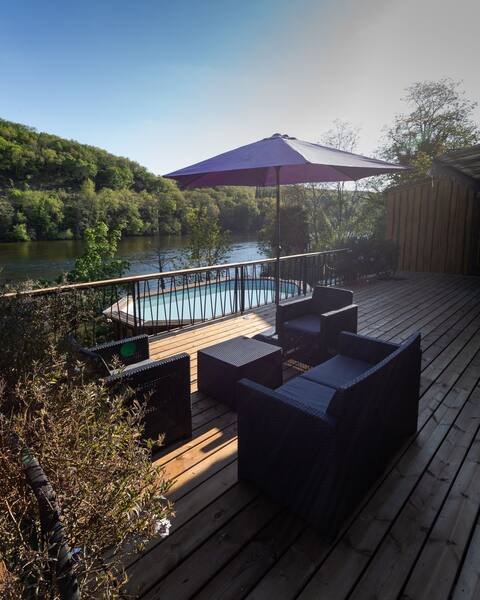
A haven of peace on the edge of the Dordogne
Entire Place • 3 bedrooms
Note: Performance varies based on location, size, amenities, seasonality, and management quality. Data reflects the past 12 months.
Top Performing Airbnb Hosts in Lalinde (2025)
Learn from the best! This table showcases top-performing Airbnb hosts in Lalinde based on the number of properties managed and estimated total revenue over the past year. Analyze their scale and performance metrics.
| Host Name | Properties | Grossing Revenue | Stay Reviews | Avg Rating |
|---|---|---|---|---|
| Tom & Sietske | 5 | $51,027 | 61 | 4.85/5.0 |
| Paul | 1 | $40,835 | 43 | 4.81/5.0 |
| Véronique | 1 | $40,614 | 32 | 4.88/5.0 |
| Melika | 3 | $30,893 | 265 | 4.79/5.0 |
| Olivier | 2 | $28,799 | 30 | 2.40/5.0 |
| Chris | 1 | $23,467 | 6 | 5.00/5.0 |
| Natallia | 1 | $23,426 | 3 | 5.00/5.0 |
| Jerome | 1 | $20,689 | 9 | 4.67/5.0 |
| Host #494037350 | 2 | $20,364 | 4 | 2.50/5.0 |
| Host #152834714 | 1 | $20,078 | 0 | 0.00/5.0 |
Analyzing the strategies of top hosts, such as their property selection, pricing, and guest communication, can offer valuable lessons for optimizing your own Airbnb operations in Lalinde.
Dive Deeper: Advanced Lalinde STR Market Data (2025)
Ready to unlock more insights? AirROI provides access to advanced metrics and comprehensive Airbnb data for Lalinde. Explore detailed analytics beyond this report to refine your investment strategy, optimize pricing, and maximize your vacation rental profits.
Explore Advanced MetricsLalinde Short-Term Rental Market Composition (2025): Property & Room Types
Room Type Distribution
Property Type Distribution
Market Composition Insights for Lalinde
- The Lalinde Airbnb market composition is heavily skewed towards Entire Home/Apt listings, which make up 85.1% of the 47 active rentals. This indicates strong guest preference for privacy and space.
- Looking at the property type distribution in Lalinde, House properties are the most common (66%), reflecting the local real estate landscape.
- Houses represent a significant 66% portion, catering likely to families or larger groups.
- The presence of 14.9% Hotel/Boutique listings indicates integration with traditional hospitality.
- Smaller segments like unique stays, outdoor/unique, others (combined 10.7%) offer potential for unique stay experiences.
Lalinde Airbnb Room Capacity Analysis (2025): Bedroom Distribution
Distribution of Listings by Number of Bedrooms
Room Capacity Insights for Lalinde
- The dominant room capacity in Lalinde is 2 bedrooms listings, making up 34% of the market. This suggests a strong demand for properties suitable for couples or solo travelers.
- Together, 2 bedrooms and 3 bedrooms properties represent 51.0% of the active Airbnb listings in Lalinde, indicating a high concentration in these sizes.
- A significant 38.3% of listings offer 3+ bedrooms, catering to larger groups and families seeking more space in Lalinde.
Lalinde Vacation Rental Guest Capacity Trends (2025)
Distribution of Listings by Guest Capacity
Guest Capacity Insights for Lalinde
- The most common guest capacity trend in Lalinde vacation rentals is listings accommodating 4 guests (25.5%). This suggests the primary traveler segment is likely small families or groups.
- Properties designed for 4 guests and 8+ guests dominate the Lalinde STR market, accounting for 46.8% of listings.
- 40.4% of properties accommodate 6+ guests, serving the market segment for larger families or group travel in Lalinde.
- On average, properties in Lalinde are equipped to host 4.5 guests.
Lalinde Airbnb Booking Patterns (2025): Available vs. Booked Days
Available Days Distribution
Booked Days Distribution
Booking Pattern Insights for Lalinde
- The most common availability pattern in Lalinde falls within the 271-366 days range, representing 55.3% of listings. This suggests many properties have significant open periods on their calendars.
- Approximately 89.3% of listings show high availability (181+ days open annually), indicating potential for increased bookings or specific owner usage patterns.
- For booked days, the 31-90 days range is most frequent in Lalinde (38.3%), reflecting common guest stay durations or potential owner blocking patterns.
- A notable 10.7% of properties secure long booking periods (181+ days booked per year), highlighting successful long-term rental strategies or significant owner usage.
Lalinde Airbnb Minimum Stay Requirements Analysis
Distribution of Listings by Minimum Night Requirement
1 Night
5 listings
11.6% of total
2 Nights
16 listings
37.2% of total
3 Nights
6 listings
14% of total
4-6 Nights
2 listings
4.7% of total
7-29 Nights
12 listings
27.9% of total
30+ Nights
2 listings
4.7% of total
Key Insights
- The most prevalent minimum stay requirement in Lalinde is 2 Nights, adopted by 37.2% of listings. This highlights the market's preference for shorter, flexible bookings.
Recommendations
- Align with the market by considering a 2 Nights minimum stay, as 37.2% of Lalinde hosts use this setting.
- If feasible, allowing 1-night stays, especially midweek or during low season, could capture last-minute bookings, as only 11.6% currently do.
- A 2-night minimum appears standard (37.2%). Consider this for weekends or peak periods.
- Adjust minimum nights based on seasonality – potentially shorter during low season and longer during peak demand periods in Lalinde.
Lalinde Airbnb Cancellation Policy Trends Analysis (2025)
Flexible
7 listings
18.9% of total
Moderate
7 listings
18.9% of total
Firm
11 listings
29.7% of total
Strict
12 listings
32.4% of total
Cancellation Policy Insights for Lalinde
- The prevailing Airbnb cancellation policy trend in Lalinde is Strict, used by 32.4% of listings.
- A majority (62.1%) of hosts in Lalinde utilize Firm or Strict policies, indicating a market where hosts prioritize booking security.
Recommendations for Hosts
- Consider adopting a Strict policy to align with the 32.4% market standard in Lalinde.
- With 32.4% using Strict terms, this is a viable option in Lalinde, particularly for high-value properties or during peak demand periods.
- Regularly review your cancellation policy against competitors and market demand shifts in Lalinde.
Lalinde STR Booking Lead Time Analysis (2025)
Average Booking Lead Time by Month
Booking Lead Time Insights for Lalinde
- The overall average booking lead time for vacation rentals in Lalinde is 69 days.
- Guests book furthest in advance for stays during August (average 108 days), likely coinciding with peak travel demand or local events.
- The shortest booking windows occur for stays in November (average 12 days), indicating more last-minute travel plans during this time.
- Seasonally, Summer (95 days avg.) sees the longest lead times, while Winter (37 days avg.) has the shortest, reflecting typical travel planning cycles.
Recommendations for Hosts
- Use the overall average lead time (69 days) as a baseline for your pricing and availability strategy in Lalinde.
- For August stays, consider implementing length-of-stay discounts or slightly higher rates for bookings made less than 108 days out to capitalize on advance planning.
- During November, focus on last-minute booking availability and promotions, as guests book with very short notice (12 days avg.).
- Target marketing efforts for the Summer season well in advance (at least 95 days) to capture early planners.
- Monitor your own booking lead times against these Lalinde averages to identify opportunities for dynamic pricing adjustments.
Popular & Essential Airbnb Amenities in Lalinde (2025)
Amenity Prevalence
Amenity Insights for Lalinde
- Essential amenities in Lalinde that guests expect include: Heating, Hot water. Lacking these (any) could significantly impact bookings.
- Popular amenities like Free parking on premises, Kitchen, Dishes and silverware are common but not universal. Offering these can provide a competitive edge.
- Warning: Wifi is not universally provided but is considered essential globally. Ensure reliable Wifi is offered.
Recommendations for Hosts
- Ensure your listing includes all essential amenities for Lalinde: Heating, Hot water.
- Prioritize adding missing essentials: Heating, Hot water.
- Consider adding popular differentiators like Free parking on premises or Kitchen to increase appeal.
- Highlight unique or less common amenities you offer (e.g., hot tub, dedicated workspace, EV charger) in your listing description and photos.
- Regularly check competitor amenities in Lalinde to stay competitive.
Lalinde Airbnb Guest Demographics & Profile Analysis (2025)
Guest Profile Summary for Lalinde
- The typical guest profile for Airbnb in Lalinde consists of primarily domestic travelers (76%), often arriving from nearby Bordeaux, typically belonging to the Post-2000s (Gen Z/Alpha) group (50%), primarily speaking French or English.
- Domestic travelers account for 75.5% of guests.
- Key international markets include France (75.5%) and United Kingdom (10.4%).
- Top languages spoken are French (44.8%) followed by English (32.5%).
- A significant demographic segment is the Post-2000s (Gen Z/Alpha) group, representing 50% of guests.
Recommendations for Hosts
- Target domestic marketing efforts towards travelers from Bordeaux and Paris.
- Tailor amenities and listing descriptions to appeal to the dominant Post-2000s (Gen Z/Alpha) demographic (e.g., highlight fast WiFi, smart home features, local guides).
- Highlight unique local experiences or amenities relevant to the primary guest profile.
- Consider seasonal promotions aligned with peak travel times for key origin markets.
Nearby Short-Term Rental Market Comparison
How does the Lalinde Airbnb market stack up against its neighbors? Compare key performance metrics like average monthly revenue, ADR, and occupancy rates in surrounding areas to understand the broader regional STR landscape.
| Market | Active Properties | Monthly Revenue | Daily Rate | Avg. Occupancy |
|---|---|---|---|---|
| Saint-Laurent-des-Combes | 11 | $3,526 | $706.18 | 23% |
| Astaffort | 10 | $3,393 | $314.20 | 35% |
| Cénac | 18 | $2,773 | $268.58 | 53% |
| Cérons | 11 | $2,635 | $196.16 | 39% |
| Galgon | 12 | $2,599 | $210.34 | 48% |
| Eynesse | 14 | $2,564 | $282.87 | 36% |
| Bourrou | 10 | $2,475 | $247.57 | 36% |
| Saint-Hippolyte | 10 | $2,443 | $204.98 | 44% |
| Carignan-de-Bordeaux | 30 | $2,418 | $236.77 | 48% |
| Abzac | 12 | $2,415 | $349.03 | 36% |