La Rochelle Airbnb Market Analysis 2025: Short Term Rental Data & Vacation Rental Statistics in Nouvelle-Aquitaine, France
Is Airbnb profitable in La Rochelle in 2025? Explore comprehensive Airbnb analytics for La Rochelle, Nouvelle-Aquitaine, France to uncover income potential. This 2025 STR market report for La Rochelle, based on AirROI data from April 2024 to March 2025, reveals key trends in the bustling market of 2,753 active listings.
Whether you're considering an Airbnb investment in La Rochelle, optimizing your existing vacation rental, or exploring rental arbitrage opportunities, understanding the La Rochelle Airbnb data is crucial. Navigating the high regulation landscape is key to maximizing your short term rental income potential. Let's dive into the specifics.
Key La Rochelle Airbnb Performance Metrics Overview
Monthly Airbnb Revenue Variations & Income Potential in La Rochelle (2025)
Understanding the monthly revenue variations for Airbnb listings in La Rochelle is key to maximizing your short term rental income potential. Seasonality significantly impacts earnings. Our analysis, based on data from the past 12 months, shows that the peak revenue month for STRs in La Rochelle is typically August, while February often presents the lowest earnings, highlighting opportunities for strategic pricing adjustments during shoulder and low seasons. Explore the typical Airbnb income in La Rochelle across different performance tiers:
- Best-in-class properties (Top 10%) achieve $3,164+ monthly, often utilizing dynamic pricing and superior guest experiences.
- Strong performing properties (Top 25%) earn $2,138 or more, indicating effective management and desirable locations/amenities.
- Typical properties (Median) generate around $1,367 per month, representing the average market performance.
- Entry-level properties (Bottom 25%) see earnings around $724, often with potential for optimization.
Average Monthly Airbnb Earnings Trend in La Rochelle
La Rochelle Airbnb Occupancy Rate Trends (2025)
Maximize your bookings by understanding the La Rochelle STR occupancy trends. Seasonal demand shifts significantly influence how often properties are booked. Typically, Augustsees the highest demand (peak season occupancy), while January experiences the lowest (low season). Effective strategies, like adjusting minimum stays or offering promotions, can boost occupancy during slower periods. Here's how different property tiers perform in La Rochelle:
- Best-in-class properties (Top 10%) achieve 83%+ occupancy, indicating high desirability and potentially optimized availability.
- Strong performing properties (Top 25%) maintain 67% or higher occupancy, suggesting good market fit and guest satisfaction.
- Typical properties (Median) have an occupancy rate around 44%.
- Entry-level properties (Bottom 25%) average 23% occupancy, potentially facing higher vacancy.
Average Monthly Occupancy Rate Trend in La Rochelle
Average Daily Rate (ADR) Airbnb Trends in La Rochelle (2025)
Effective short term rental pricing strategy in La Rochelle involves understanding monthly ADR fluctuations. The Average Daily Rate (ADR) for Airbnb in La Rochelle typically peaks in July and dips lowest during March. Leveraging Airbnb dynamic pricing tools or strategies based on this seasonality can significantly boost revenue. Here's a look at the typical nightly rates achieved:
- Best-in-class properties (Top 10%) command rates of $199+ per night, often due to premium features or locations.
- Strong performing properties (Top 25%) achieve nightly rates of $125 or more.
- Typical properties (Median) charge around $90 per night.
- Entry-level properties (Bottom 25%) earn around $69 per night.
Average Daily Rate (ADR) Trend by Month in La Rochelle
Get Live La Rochelle Market Intelligence 👇

Explore Real-time Analytics
Airbnb Seasonality Analysis & Trends in La Rochelle (2025)
Peak Season (August, July, April)
- Revenue averages $2,257 per month
- Occupancy rates average 56.8%
- Daily rates average $117
Shoulder Season
- Revenue averages $1,666 per month
- Occupancy maintains around 44.5%
- Daily rates hold near $113
Low Season (January, February, March)
- Revenue drops to average $1,049 per month
- Occupancy decreases to average 36.5%
- Daily rates adjust to average $108
Seasonality Insights for La Rochelle
- The Airbnb seasonality in La Rochelle shows highly seasonal trends requiring careful strategy. While the sections above show seasonal averages, it's also insightful to look at the extremes:
- During the high season, the absolute peak month showcases La Rochelle's highest earning potential, with monthly revenues capable of climbing to $2,576, occupancy reaching a high of 68.0%, and ADRs peaking at $119.
- Conversely, the slowest single month of the year, typically falling within the low season, marks the market's lowest point. In this month, revenue might dip to $1,028, occupancy could drop to 32.8%, and ADRs may adjust down to $108.
- Understanding both the seasonal averages and these monthly peaks and troughs in revenue, occupancy, and ADR is crucial for maximizing your Airbnb profit potential in La Rochelle.
Seasonal Strategies for Maximizing Profit
- Peak Season: Maximize revenue through premium pricing and potentially longer minimum stays. Ensure high availability.
- Low Season: Offer competitive pricing, special promotions (e.g., extended stay discounts), and flexible cancellation policies. Target off-season travelers like remote workers or budget-conscious guests.
- Shoulder Seasons: Implement dynamic pricing that balances peak and low rates. Target weekend travelers or specific events. Offer slightly more flexible terms than peak season.
- Regularly analyze your own performance against these La Rochelle seasonality benchmarks and adjust your pricing and availability strategy accordingly.
Best Areas for Airbnb Investment in La Rochelle (2025)
Exploring the top neighborhoods for short-term rentals in La Rochelle? This section highlights key areas, outlining why they are attractive for hosts and guests, along with notable local attractions. Consider these locations based on your target guest profile and investment strategy.
| Neighborhood / Area | Why Host Here? (Target Guests & Appeal) | Key Attractions & Landmarks |
|---|---|---|
| Vieux Port | The historic old port area of La Rochelle, known for its picturesque harbor, seafood restaurants, and vibrant atmosphere. Ideal for visitors wanting to experience the charm of the city with great dining and shopping options. | Old Port, La Rochelle Towers, Quai des Minimes, Fresh Seafood Market, La Rochelle Aquarium, Rue des Merciers |
| Les Minimes | A popular beach and marina area in La Rochelle that attracts both tourists and locals. Known for its sandy beaches and water activities, making it a great choice for those looking for a seaside getaway. | Les Minimes Beach, Marina de La Rochelle, Port des Minimes, Les ports de plaisance, Water sports activities, Restaurants along the beach |
| Saint-Nicolas | A charming neighborhood featuring narrow streets and historic architecture. Close to the city center, it’s perfect for guests who enjoy exploring quaint shops, cafes, and local culture. | Saint-Nicolas Church, Rue des Augustins, Local artisan shops, Cafés and bistros, La Rochelle City Hall, Theatre La Coursive |
| La Rochelle City Center | The bustling heart of La Rochelle filled with shops, restaurants, and cultural sites. Attracts tourists who want to be in the middle of the action, with easy access to attractions. | Place de Verdun, Grand Temple, La Rochelle Museum of Fine Arts, Shopping streets, Local markets, La Rochelle Maritime Museum |
| Les Parcs | A quieter residential area known for its parks and green spaces. Ideal for families or longer stays, providing a peaceful retreat within proximity to city attractions. | Parc Charruyer, Parc de la Bicyclette, Family-friendly parks, Walking and biking paths, Local sports facilities |
| La Pallice | An industrial and maritime area with a unique character. It's emerging as a location for budget travelers and those interested in maritime activities and history. | Museum of the Maritime History, Port of La Pallice, Fishing and boating experiences, Less touristy attractions, Local seafood markets |
| Aytre | A nearby suburb of La Rochelle with beautiful beaches and outdoor activities. Great for guests looking for a coastal experience away from the main tourist spots. | Aytre Beach, Cycling paths, Wildlife parks, Water sports, Local seafood restaurants |
| Chatelaillon-Plage | A coastal commune known for its long beach and charming town center. Popular with tourists looking for a traditional beach holiday experience. | Chatelaillon Beach, Thermal spa, Local bistros, The coastal path, Weekly market |
Understanding Airbnb License Requirements & STR Laws in La Rochelle (2025)
Yes, La Rochelle, Nouvelle-Aquitaine, France enforces high STR regulations. Obtaining a license and ensuring compliance is almost certainly required according to current 2025 STR laws. Always verify the latest short term rental regulations and Airbnb license requirements directly with local government authorities for La Rochelle to ensure full compliance before hosting.
(Source: AirROI data, 2025, based on 79% licensed listings)
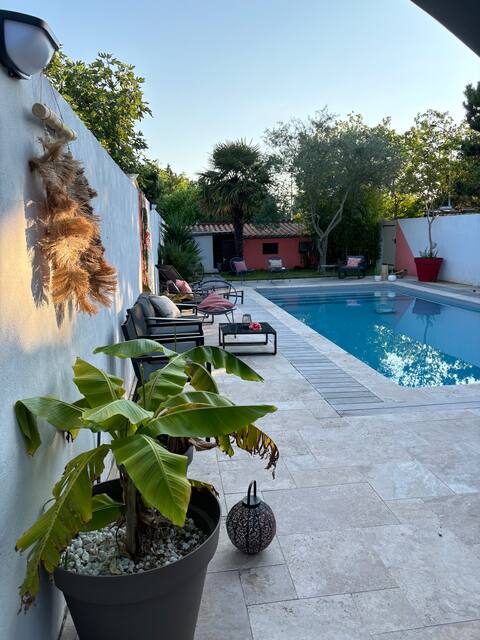
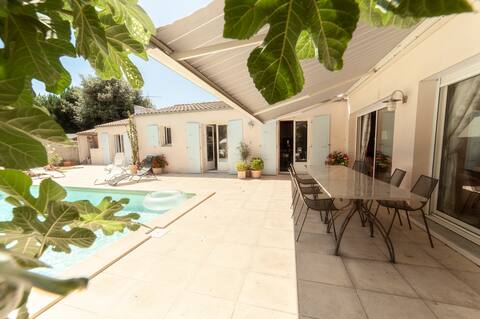
Top Performing Airbnb Properties in La Rochelle (2025)
Benchmark your potential! Explore examples of top-performing Airbnb properties in La Rochellebased on Trailing Twelve Month (TTM) revenue. Analyze their characteristics, revenue, occupancy rate, and ADR to understand what drives success in this market.

Maison Caju - Urban cottage Old Port district
Entire Place • 6 bedrooms
5 bedroom house with pool in La Rochelle
Entire Place • 5 bedrooms
Exceptional villa with heated pool
Entire Place • 5 bedrooms
Air-conditioned villa with pool near beach
Entire Place • 4 bedrooms
Quiet 2 steps from the center
Entire Place • 3 bedrooms
"Nuits au port" port des minimes - Villa B
Entire Place • 4 bedrooms
Note: Performance varies based on location, size, amenities, seasonality, and management quality. Data reflects the past 12 months.
Top Performing Airbnb Hosts in La Rochelle (2025)
Learn from the best! This table showcases top-performing Airbnb hosts in La Rochelle based on the number of properties managed and estimated total revenue over the past year. Analyze their scale and performance metrics.
| Host Name | Properties | Grossing Revenue | Stay Reviews | Avg Rating |
|---|---|---|---|---|
| Fabrice | 52 | $1,179,878 | 4673 | 4.77/5.0 |
| La Petite Clé | 28 | $833,221 | 1260 | 4.54/5.0 |
| Arnaud | 23 | $470,433 | 2492 | 4.82/5.0 |
| Xavier | 30 | $434,968 | 1466 | 4.17/5.0 |
| Lockey Conciergerie | 23 | $431,250 | 1190 | 4.46/5.0 |
| L'Atelier Locatif | 61 | $411,597 | 1156 | 4.26/5.0 |
| Jessica | 11 | $272,756 | 348 | 4.41/5.0 |
| Welkeys | 19 | $259,443 | 335 | 4.47/5.0 |
| Valentine | 1 | $226,640 | 40 | 4.85/5.0 |
| Laure | 10 | $219,115 | 1205 | 4.87/5.0 |
Analyzing the strategies of top hosts, such as their property selection, pricing, and guest communication, can offer valuable lessons for optimizing your own Airbnb operations in La Rochelle.
Dive Deeper: Advanced La Rochelle STR Market Data (2025)
Ready to unlock more insights? AirROI provides access to advanced metrics and comprehensive Airbnb data for La Rochelle. Explore detailed analytics beyond this report to refine your investment strategy, optimize pricing, and maximize your vacation rental profits.
Explore Advanced MetricsLa Rochelle Short-Term Rental Market Composition (2025): Property & Room Types
Room Type Distribution
Property Type Distribution
Market Composition Insights for La Rochelle
- The La Rochelle Airbnb market composition is heavily skewed towards Entire Home/Apt listings, which make up 94% of the 2,753 active rentals. This indicates strong guest preference for privacy and space.
- Looking at the property type distribution in La Rochelle, Apartment/Condo properties are the most common (70.7%), reflecting the local real estate landscape.
- Houses represent a significant 23.2% portion, catering likely to families or larger groups.
- Smaller segments like outdoor/unique, hotel/boutique, others (combined 6.2%) offer potential for unique stay experiences.
La Rochelle Airbnb Room Capacity Analysis (2025): Bedroom Distribution
Distribution of Listings by Number of Bedrooms
Room Capacity Insights for La Rochelle
- The dominant room capacity in La Rochelle is 1 bedroom listings, making up 46.5% of the market. This suggests a strong demand for properties suitable for couples or solo travelers.
- Together, 1 bedroom and 2 bedrooms properties represent 67.0% of the active Airbnb listings in La Rochelle, indicating a high concentration in these sizes.
La Rochelle Vacation Rental Guest Capacity Trends (2025)
Distribution of Listings by Guest Capacity
Guest Capacity Insights for La Rochelle
- The most common guest capacity trend in La Rochelle vacation rentals is listings accommodating 4 guests (36.4%). This suggests the primary traveler segment is likely small families or groups.
- Properties designed for 4 guests and 2 guests dominate the La Rochelle STR market, accounting for 68.7% of listings.
- 16.4% of properties accommodate 6+ guests, serving the market segment for larger families or group travel in La Rochelle.
- On average, properties in La Rochelle are equipped to host 3.6 guests.
La Rochelle Airbnb Booking Patterns (2025): Available vs. Booked Days
Available Days Distribution
Booked Days Distribution
Booking Pattern Insights for La Rochelle
- The most common availability pattern in La Rochelle falls within the 271-366 days range, representing 43.5% of listings. This suggests many properties have significant open periods on their calendars.
- Approximately 79.2% of listings show high availability (181+ days open annually), indicating potential for increased bookings or specific owner usage patterns.
- For booked days, the 91-180 days range is most frequent in La Rochelle (37%), reflecting common guest stay durations or potential owner blocking patterns.
- A notable 21.7% of properties secure long booking periods (181+ days booked per year), highlighting successful long-term rental strategies or significant owner usage.
La Rochelle Airbnb Minimum Stay Requirements Analysis
Distribution of Listings by Minimum Night Requirement
1 Night
346 listings
13.7% of total
2 Nights
922 listings
36.6% of total
3 Nights
355 listings
14.1% of total
4-6 Nights
383 listings
15.2% of total
7-29 Nights
216 listings
8.6% of total
30+ Nights
300 listings
11.9% of total
Key Insights
- The most prevalent minimum stay requirement in La Rochelle is 2 Nights, adopted by 36.6% of listings. This highlights the market's preference for shorter, flexible bookings.
- A significant segment (11.9%) caters to monthly stays (30+ nights) in La Rochelle, pointing to opportunities in the extended-stay market.
Recommendations
- Align with the market by considering a 2 Nights minimum stay, as 36.6% of La Rochelle hosts use this setting.
- If feasible, allowing 1-night stays, especially midweek or during low season, could capture last-minute bookings, as only 13.7% currently do.
- A 2-night minimum appears standard (36.6%). Consider this for weekends or peak periods.
- Explore offering discounts for stays of 30+ nights to attract the 11.9% of the market seeking extended stays.
- Adjust minimum nights based on seasonality – potentially shorter during low season and longer during peak demand periods in La Rochelle.
La Rochelle Airbnb Cancellation Policy Trends Analysis (2025)
Super Strict 30 Days
7 listings
0.3% of total
Flexible
497 listings
20.3% of total
Moderate
782 listings
32% of total
Firm
531 listings
21.7% of total
Strict
626 listings
25.6% of total
Cancellation Policy Insights for La Rochelle
- The prevailing Airbnb cancellation policy trend in La Rochelle is Moderate, used by 32% of listings.
- There's a relatively balanced mix between guest-friendly (52.3%) and stricter (47.3%) policies, offering choices for different guest needs.
Recommendations for Hosts
- Consider adopting a Moderate policy to align with the 32% market standard in La Rochelle.
- Regularly review your cancellation policy against competitors and market demand shifts in La Rochelle.
La Rochelle STR Booking Lead Time Analysis (2025)
Average Booking Lead Time by Month
Booking Lead Time Insights for La Rochelle
- The overall average booking lead time for vacation rentals in La Rochelle is 58 days.
- Guests book furthest in advance for stays during June (average 85 days), likely coinciding with peak travel demand or local events.
- The shortest booking windows occur for stays in February (average 31 days), indicating more last-minute travel plans during this time.
- Seasonally, Summer (73 days avg.) sees the longest lead times, while Winter (37 days avg.) has the shortest, reflecting typical travel planning cycles.
Recommendations for Hosts
- Use the overall average lead time (58 days) as a baseline for your pricing and availability strategy in La Rochelle.
- For June stays, consider implementing length-of-stay discounts or slightly higher rates for bookings made less than 85 days out to capitalize on advance planning.
- Target marketing efforts for the Summer season well in advance (at least 73 days) to capture early planners.
- Monitor your own booking lead times against these La Rochelle averages to identify opportunities for dynamic pricing adjustments.
Popular & Essential Airbnb Amenities in La Rochelle (2025)
Amenity Prevalence
Amenity Insights for La Rochelle
- Essential amenities in La Rochelle that guests expect include: Kitchen. Lacking these (this) could significantly impact bookings.
- Popular amenities like Heating, Hot water, Smoke alarm are common but not universal. Offering these can provide a competitive edge.
- Warning: Wifi is not universally provided but is considered essential globally. Ensure reliable Wifi is offered.
Recommendations for Hosts
- Ensure your listing includes all essential amenities for La Rochelle: Kitchen.
- Prioritize adding missing essentials: Kitchen.
- Consider adding popular differentiators like Heating or Hot water to increase appeal.
- Highlight unique or less common amenities you offer (e.g., hot tub, dedicated workspace, EV charger) in your listing description and photos.
- Regularly check competitor amenities in La Rochelle to stay competitive.
La Rochelle Airbnb Guest Demographics & Profile Analysis (2025)
Guest Profile Summary for La Rochelle
- The typical guest profile for Airbnb in La Rochelle consists of primarily domestic travelers (85%), often arriving from nearby Paris, typically belonging to the Post-2000s (Gen Z/Alpha) group (50%), primarily speaking French or English.
- Domestic travelers account for 85.1% of guests.
- Key international markets include France (85.1%) and United Kingdom (3.7%).
- Top languages spoken are French (45.4%) followed by English (33.5%).
- A significant demographic segment is the Post-2000s (Gen Z/Alpha) group, representing 50% of guests.
Recommendations for Hosts
- Target domestic marketing efforts towards travelers from Paris and Nantes.
- Tailor amenities and listing descriptions to appeal to the dominant Post-2000s (Gen Z/Alpha) demographic (e.g., highlight fast WiFi, smart home features, local guides).
- Highlight unique local experiences or amenities relevant to the primary guest profile.
- Consider seasonal promotions aligned with peak travel times for key origin markets.
Nearby Short-Term Rental Market Comparison
How does the La Rochelle Airbnb market stack up against its neighbors? Compare key performance metrics like average monthly revenue, ADR, and occupancy rates in surrounding areas to understand the broader regional STR landscape.
| Market | Active Properties | Monthly Revenue | Daily Rate | Avg. Occupancy |
|---|---|---|---|---|
| Vallon-sur-Gée | 11 | $2,913 | $379.01 | 30% |
| Bourneau | 11 | $2,747 | $442.07 | 35% |
| Nuaillé-d'Aunis | 10 | $2,741 | $373.83 | 37% |
| Le Bois-Plage-en-Ré | 303 | $2,528 | $284.63 | 45% |
| Chambellay | 11 | $2,525 | $255.24 | 34% |
| Sainte-Florence | 10 | $2,445 | $233.78 | 46% |
| Saint-Hippolyte | 10 | $2,443 | $204.98 | 44% |
| Abzac | 12 | $2,415 | $349.03 | 36% |
| La Flotte | 396 | $2,382 | $236.53 | 46% |
| Saint-Georges-des-Coteaux | 12 | $2,335 | $187.61 | 43% |