Josse Airbnb Market Analysis 2025: Short Term Rental Data & Vacation Rental Statistics in Nouvelle-Aquitaine, France
Is Airbnb profitable in Josse in 2025? Explore comprehensive Airbnb analytics for Josse, Nouvelle-Aquitaine, France to uncover income potential. This 2025 STR market report for Josse, based on AirROI data from April 2024 to March 2025, reveals key trends in the niche market of 17 active listings.
Whether you're considering an Airbnb investment in Josse, optimizing your existing vacation rental, or exploring rental arbitrage opportunities, understanding the Josse Airbnb data is crucial. Leveraging the low regulation environment is key to maximizing your short term rental income potential. Let's dive into the specifics.
Key Josse Airbnb Performance Metrics Overview
Monthly Airbnb Revenue Variations & Income Potential in Josse (2025)
Understanding the monthly revenue variations for Airbnb listings in Josse is key to maximizing your short term rental income potential. Seasonality significantly impacts earnings. Our analysis, based on data from the past 12 months, shows that the peak revenue month for STRs in Josse is typically August, while March often presents the lowest earnings, highlighting opportunities for strategic pricing adjustments during shoulder and low seasons. Explore the typical Airbnb income in Josse across different performance tiers:
- Best-in-class properties (Top 10%) achieve $2,828+ monthly, often utilizing dynamic pricing and superior guest experiences.
- Strong performing properties (Top 25%) earn $2,145 or more, indicating effective management and desirable locations/amenities.
- Typical properties (Median) generate around $1,319 per month, representing the average market performance.
- Entry-level properties (Bottom 25%) see earnings around $933, often with potential for optimization.
Average Monthly Airbnb Earnings Trend in Josse
Josse Airbnb Occupancy Rate Trends (2025)
Maximize your bookings by understanding the Josse STR occupancy trends. Seasonal demand shifts significantly influence how often properties are booked. Typically, Augustsees the highest demand (peak season occupancy), while February experiences the lowest (low season). Effective strategies, like adjusting minimum stays or offering promotions, can boost occupancy during slower periods. Here's how different property tiers perform in Josse:
- Best-in-class properties (Top 10%) achieve 81%+ occupancy, indicating high desirability and potentially optimized availability.
- Strong performing properties (Top 25%) maintain 66% or higher occupancy, suggesting good market fit and guest satisfaction.
- Typical properties (Median) have an occupancy rate around 45%.
- Entry-level properties (Bottom 25%) average 29% occupancy, potentially facing higher vacancy.
Average Monthly Occupancy Rate Trend in Josse
Average Daily Rate (ADR) Airbnb Trends in Josse (2025)
Effective short term rental pricing strategy in Josse involves understanding monthly ADR fluctuations. The Average Daily Rate (ADR) for Airbnb in Josse typically peaks in November and dips lowest during July. Leveraging Airbnb dynamic pricing tools or strategies based on this seasonality can significantly boost revenue. Here's a look at the typical nightly rates achieved:
- Best-in-class properties (Top 10%) command rates of $324+ per night, often due to premium features or locations.
- Strong performing properties (Top 25%) achieve nightly rates of $141 or more.
- Typical properties (Median) charge around $94 per night.
- Entry-level properties (Bottom 25%) earn around $68 per night.
Average Daily Rate (ADR) Trend by Month in Josse
Get Live Josse Market Intelligence 👇

Explore Real-time Analytics
Airbnb Seasonality Analysis & Trends in Josse (2025)
Peak Season (August, September, July)
- Revenue averages $2,561 per month
- Occupancy rates average 64.7%
- Daily rates average $144
Shoulder Season
- Revenue averages $1,579 per month
- Occupancy maintains around 46.6%
- Daily rates hold near $147
Low Season (January, February, March)
- Revenue drops to average $1,030 per month
- Occupancy decreases to average 32.6%
- Daily rates adjust to average $144
Seasonality Insights for Josse
- The Airbnb seasonality in Josse shows highly seasonal trends requiring careful strategy. While the sections above show seasonal averages, it's also insightful to look at the extremes:
- During the high season, the absolute peak month showcases Josse's highest earning potential, with monthly revenues capable of climbing to $3,360, occupancy reaching a high of 82.6%, and ADRs peaking at $154.
- Conversely, the slowest single month of the year, typically falling within the low season, marks the market's lowest point. In this month, revenue might dip to $885, occupancy could drop to 30.1%, and ADRs may adjust down to $138.
- Understanding both the seasonal averages and these monthly peaks and troughs in revenue, occupancy, and ADR is crucial for maximizing your Airbnb profit potential in Josse.
Seasonal Strategies for Maximizing Profit
- Peak Season: Maximize revenue through premium pricing and potentially longer minimum stays. Ensure high availability.
- Low Season: Offer competitive pricing, special promotions (e.g., extended stay discounts), and flexible cancellation policies. Target off-season travelers like remote workers or budget-conscious guests.
- Shoulder Seasons: Implement dynamic pricing that balances peak and low rates. Target weekend travelers or specific events. Offer slightly more flexible terms than peak season.
- Regularly analyze your own performance against these Josse seasonality benchmarks and adjust your pricing and availability strategy accordingly.
Best Areas for Airbnb Investment in Josse (2025)
Exploring the top neighborhoods for short-term rentals in Josse? This section highlights key areas, outlining why they are attractive for hosts and guests, along with notable local attractions. Consider these locations based on your target guest profile and investment strategy.
| Neighborhood / Area | Why Host Here? (Target Guests & Appeal) | Key Attractions & Landmarks |
|---|---|---|
| Le centre historique | Le centre historique de Josse est rempli de charme avec ses rues pavées et ses bâtiments historiques. C'est une destination idéale pour les visiteurs qui souhaitent explorer la culture et l'histoire de la région. | Église Saint-Pierre, Château de Josse, Musée de l'Art, Les jardins de la ville, Marché local |
| Côte Atlantique | La Côte Atlantique est renommée pour ses magnifiques plages et ses activités nautiques. C'est un lieu de prédilection pour les amateurs de soleil et d'aventures maritimes. | Plage de Josse, Activités de surf, Pistes cyclables le long de la côte, Restaurants de fruits de mer, Promenade maritime |
| Forêt de la Double | Cette région est connue pour ses forêts paisibles et ses sentiers de randonnée. Elle attire les amoureux de la nature et ceux qui recherchent la tranquillité loin de la ville. | Sentier de randonnée de la Forêt de la Double, Observatoires d'oiseaux, Pique-nique dans la nature, Vélo en forêt |
| Les villages typiques | Les petits villages autour de Josse offrent une expérience authentique de la vie en Nouvelle-Aquitaine, parfaite pour ceux qui cherchent à échapper à l'agitation des grandes villes. | Village de Vieux-Boucau, Village de Soustons, Visites locales de producteurs, Marchés traditionnels, Artisanat local |
| Activités en plein air | Josse est un point de départ pour diverses activités de plein air, attirant les amateurs de sport et d'aventure. | Kayak sur les lacs, Randonnée dans les collines locales, Pêche en rivière, Golf, Parcours d'accrobranche |
| Le parc naturel régional des Landes de Gascognes | Ce parc naturel offre des paysages magnifiques et une faune variée, attirant de nombreux visiteurs soucieux de l'environnement. | Biodiversité unique, Activités de randonnée, Visites guidées de la nature, Zones de pique-nique, Écotourisme |
| Gastronomie locale | Josse est réputée pour sa gastronomie, offrant une multitude de restaurants et de marchés où déguster des produits locaux. | Restaurants étoilés, Marchés de producteurs, Dégustations de vins, Ateliers culinaires, Fêtes gastronomiques |
| Proximité avec Dax et Bayonne | Josse est idéalement située entre Dax et Bayonne, permettant un accès facile à d’autres attractions touristiques et à la vie urbaine. | Visites de Dax, Culture à Bayonne, Thermes à Dax, Festival de Bayonne, Commodités urbaines |
Understanding Airbnb License Requirements & STR Laws in Josse (2025)
While Josse, Nouvelle-Aquitaine, France currently shows low STR regulations, specific Airbnb license requirements might still exist or change. Always verify the latest short term rental regulations and Airbnb license requirements directly with local government authorities for Josse to ensure full compliance before hosting.
(Source: AirROI data, 2025, based on 6% licensed listings)
Top Performing Airbnb Properties in Josse (2025)
Benchmark your potential! Explore examples of top-performing Airbnb properties in Jossebased on Trailing Twelve Month (TTM) revenue. Analyze their characteristics, revenue, occupancy rate, and ADR to understand what drives success in this market.
cottage 100m2,pets ok, classified 3* ,all included
Entire Place • 3 bedrooms

Maison Azu - 2 bedroom cottage
Entire Place • 2 bedrooms

Villa Mona Lisa 8-10 people, private pool
Entire Place • 5 bedrooms
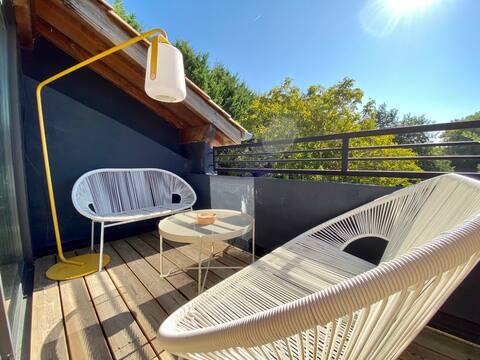
Adour apartment: nature, calm, swimming pool and spa!
Entire Place • 2 bedrooms

3-star, 2 bedroom home
Entire Place • 2 bedrooms
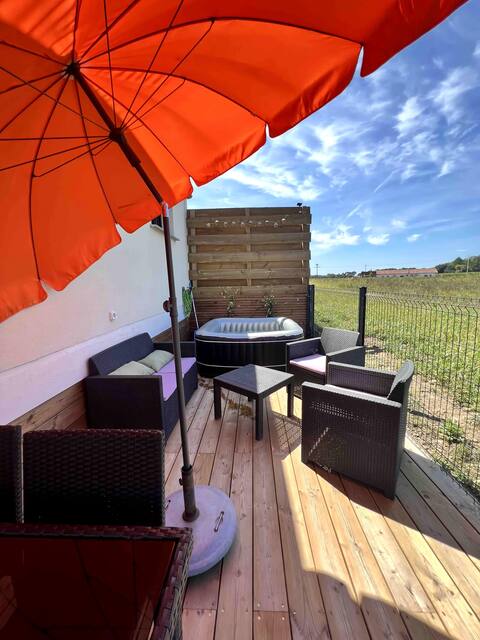
New T2, Private Terrace and Spa
Entire Place • 1 bedroom
Note: Performance varies based on location, size, amenities, seasonality, and management quality. Data reflects the past 12 months.
Top Performing Airbnb Hosts in Josse (2025)
Learn from the best! This table showcases top-performing Airbnb hosts in Josse based on the number of properties managed and estimated total revenue over the past year. Analyze their scale and performance metrics.
| Host Name | Properties | Grossing Revenue | Stay Reviews | Avg Rating |
|---|---|---|---|---|
| Lydia Et Pierre-Yves | 4 | $61,725 | 276 | 4.98/5.0 |
| Sophie | 1 | $33,107 | 13 | 4.92/5.0 |
| Stephane | 1 | $28,104 | 11 | 5.00/5.0 |
| Camille | 1 | $24,386 | 225 | 4.94/5.0 |
| Francine | 1 | $18,278 | 184 | 4.93/5.0 |
| Jeremy Et Myriam | 1 | $17,895 | 62 | 4.90/5.0 |
| Alexandre | 1 | $16,077 | 49 | 4.96/5.0 |
| Sebastien | 2 | $15,121 | 10 | 2.38/5.0 |
| Lydie | 1 | $13,882 | 29 | 4.97/5.0 |
| Claire | 1 | $8,563 | 27 | 4.70/5.0 |
Analyzing the strategies of top hosts, such as their property selection, pricing, and guest communication, can offer valuable lessons for optimizing your own Airbnb operations in Josse.
Dive Deeper: Advanced Josse STR Market Data (2025)
Ready to unlock more insights? AirROI provides access to advanced metrics and comprehensive Airbnb data for Josse. Explore detailed analytics beyond this report to refine your investment strategy, optimize pricing, and maximize your vacation rental profits.
Explore Advanced MetricsJosse Short-Term Rental Market Composition (2025): Property & Room Types
Room Type Distribution
Property Type Distribution
Market Composition Insights for Josse
- The Josse Airbnb market composition is heavily skewed towards Entire Home/Apt listings, which make up 88.2% of the 17 active rentals. This indicates strong guest preference for privacy and space.
- Looking at the property type distribution in Josse, House properties are the most common (52.9%), reflecting the local real estate landscape.
- Houses represent a significant 52.9% portion, catering likely to families or larger groups.
- The presence of 5.9% Hotel/Boutique listings indicates integration with traditional hospitality.
Josse Airbnb Room Capacity Analysis (2025): Bedroom Distribution
Distribution of Listings by Number of Bedrooms
Room Capacity Insights for Josse
- The dominant room capacity in Josse is 1 bedroom listings, making up 41.2% of the market. This suggests a strong demand for properties suitable for couples or solo travelers.
- Together, 1 bedroom and 2 bedrooms properties represent 64.7% of the active Airbnb listings in Josse, indicating a high concentration in these sizes.
- A significant 23.6% of listings offer 3+ bedrooms, catering to larger groups and families seeking more space in Josse.
Josse Vacation Rental Guest Capacity Trends (2025)
Distribution of Listings by Guest Capacity
Guest Capacity Insights for Josse
- The most common guest capacity trend in Josse vacation rentals is listings accommodating 4 guests (29.4%). This suggests the primary traveler segment is likely small families or groups.
- Properties designed for 4 guests and 2 guests dominate the Josse STR market, accounting for 58.8% of listings.
- 29.4% of properties accommodate 6+ guests, serving the market segment for larger families or group travel in Josse.
- On average, properties in Josse are equipped to host 3.8 guests.
Josse Airbnb Booking Patterns (2025): Available vs. Booked Days
Available Days Distribution
Booked Days Distribution
Booking Pattern Insights for Josse
- The most common availability pattern in Josse falls within the 91-180 days range, representing 41.2% of listings. This suggests many properties have significant open periods on their calendars.
- Approximately 53.0% of listings show high availability (181+ days open annually), indicating potential for increased bookings or specific owner usage patterns.
- For booked days, the 181-270 days range is most frequent in Josse (41.2%), reflecting common guest stay durations or potential owner blocking patterns.
- A notable 47.1% of properties secure long booking periods (181+ days booked per year), highlighting successful long-term rental strategies or significant owner usage.
Josse Airbnb Minimum Stay Requirements Analysis
Distribution of Listings by Minimum Night Requirement
1 Night
9 listings
56.3% of total
2 Nights
3 listings
18.8% of total
4-6 Nights
2 listings
12.5% of total
7-29 Nights
2 listings
12.5% of total
Key Insights
- The most prevalent minimum stay requirement in Josse is 1 Night, adopted by 56.3% of listings. This highlights the market's preference for shorter, flexible bookings.
- A strong majority (75.1%) of the Josse Airbnb data shows acceptance of very short stays (1-2 nights), indicating a dynamic, high-turnover market.
Recommendations
- Align with the market by considering a 1 Night minimum stay, as 56.3% of Josse hosts use this setting.
- Adjust minimum nights based on seasonality – potentially shorter during low season and longer during peak demand periods in Josse.
Josse Airbnb Cancellation Policy Trends Analysis (2025)
Flexible
1 listings
7.1% of total
Moderate
8 listings
57.1% of total
Firm
2 listings
14.3% of total
Strict
3 listings
21.4% of total
Cancellation Policy Insights for Josse
- The prevailing Airbnb cancellation policy trend in Josse is Moderate, used by 57.1% of listings.
- There's a relatively balanced mix between guest-friendly (64.2%) and stricter (35.7%) policies, offering choices for different guest needs.
Recommendations for Hosts
- Consider adopting a Moderate policy to align with the 57.1% market standard in Josse.
- Regularly review your cancellation policy against competitors and market demand shifts in Josse.
Josse STR Booking Lead Time Analysis (2025)
Average Booking Lead Time by Month
Booking Lead Time Insights for Josse
- The overall average booking lead time for vacation rentals in Josse is 64 days.
- Guests book furthest in advance for stays during May (average 110 days), likely coinciding with peak travel demand or local events.
- The shortest booking windows occur for stays in February (average 21 days), indicating more last-minute travel plans during this time.
- Seasonally, Summer (93 days avg.) sees the longest lead times, while Winter (35 days avg.) has the shortest, reflecting typical travel planning cycles.
Recommendations for Hosts
- Use the overall average lead time (64 days) as a baseline for your pricing and availability strategy in Josse.
- For May stays, consider implementing length-of-stay discounts or slightly higher rates for bookings made less than 110 days out to capitalize on advance planning.
- Target marketing efforts for the Summer season well in advance (at least 93 days) to capture early planners.
- Monitor your own booking lead times against these Josse averages to identify opportunities for dynamic pricing adjustments.
Popular & Essential Airbnb Amenities in Josse (2025)
Amenity Prevalence
Amenity Insights for Josse
- Essential amenities in Josse that guests expect include: Free parking on premises, Wifi. Lacking these (any) could significantly impact bookings.
- Popular amenities like Outdoor dining area, Smoke alarm, Hot water are common but not universal. Offering these can provide a competitive edge.
Recommendations for Hosts
- Ensure your listing includes all essential amenities for Josse: Free parking on premises, Wifi.
- Consider adding popular differentiators like Outdoor dining area or Smoke alarm to increase appeal.
- Highlight unique or less common amenities you offer (e.g., hot tub, dedicated workspace, EV charger) in your listing description and photos.
- Regularly check competitor amenities in Josse to stay competitive.
Josse Airbnb Guest Demographics & Profile Analysis (2025)
Guest Profile Summary for Josse
- The typical guest profile for Airbnb in Josse consists of primarily domestic travelers (73%), often arriving from nearby England, typically belonging to the Post-2000s (Gen Z/Alpha) group (50%), primarily speaking French or English.
- Domestic travelers account for 73.1% of guests.
- Key international markets include France (73.1%) and United Kingdom (9.3%).
- Top languages spoken are French (35.2%) followed by English (32.7%).
- A significant demographic segment is the Post-2000s (Gen Z/Alpha) group, representing 50% of guests.
Recommendations for Hosts
- Target domestic marketing efforts towards travelers from England and Madrid.
- Tailor amenities and listing descriptions to appeal to the dominant Post-2000s (Gen Z/Alpha) demographic (e.g., highlight fast WiFi, smart home features, local guides).
- Highlight unique local experiences or amenities relevant to the primary guest profile.
- Consider seasonal promotions aligned with peak travel times for key origin markets.
Nearby Short-Term Rental Market Comparison
How does the Josse Airbnb market stack up against its neighbors? Compare key performance metrics like average monthly revenue, ADR, and occupancy rates in surrounding areas to understand the broader regional STR landscape.
| Market | Active Properties | Monthly Revenue | Daily Rate | Avg. Occupancy |
|---|---|---|---|---|
| San Sebastián | 1,426 | $3,546 | $262.81 | 49% |
| Saint-Laurent-des-Combes | 11 | $3,526 | $706.18 | 23% |
| Gautegiz Arteaga | 21 | $2,865 | $293.66 | 38% |
| Cénac | 18 | $2,773 | $268.58 | 53% |
| Labastida/Bastida | 11 | $2,662 | $268.80 | 34% |
| Cérons | 11 | $2,635 | $196.16 | 39% |
| Barrika | 13 | $2,629 | $314.61 | 41% |
| Galgon | 12 | $2,599 | $210.34 | 48% |
| Esteribar | 20 | $2,574 | $276.81 | 32% |
| Hernani | 11 | $2,572 | $345.16 | 40% |