Herm Airbnb Market Analysis 2025: Short Term Rental Data & Vacation Rental Statistics in Nouvelle-Aquitaine, France
Is Airbnb profitable in Herm in 2025? Explore comprehensive Airbnb analytics for Herm, Nouvelle-Aquitaine, France to uncover income potential. This 2025 STR market report for Herm, based on AirROI data from April 2024 to March 2025, reveals key trends in the niche market of 19 active listings.
Whether you're considering an Airbnb investment in Herm, optimizing your existing vacation rental, or exploring rental arbitrage opportunities, understanding the Herm Airbnb data is crucial. Understanding the local regulations is key to maximizing your short term rental income potential. Let's dive into the specifics.
Key Herm Airbnb Performance Metrics Overview
Monthly Airbnb Revenue Variations & Income Potential in Herm (2025)
Understanding the monthly revenue variations for Airbnb listings in Herm is key to maximizing your short term rental income potential. Seasonality significantly impacts earnings. Our analysis, based on data from the past 12 months, shows that the peak revenue month for STRs in Herm is typically April, while February often presents the lowest earnings, highlighting opportunities for strategic pricing adjustments during shoulder and low seasons. Explore the typical Airbnb income in Herm across different performance tiers:
- Best-in-class properties (Top 10%) achieve $3,208+ monthly, often utilizing dynamic pricing and superior guest experiences.
- Strong performing properties (Top 25%) earn $1,996 or more, indicating effective management and desirable locations/amenities.
- Typical properties (Median) generate around $1,259 per month, representing the average market performance.
- Entry-level properties (Bottom 25%) see earnings around $665, often with potential for optimization.
Average Monthly Airbnb Earnings Trend in Herm
Herm Airbnb Occupancy Rate Trends (2025)
Maximize your bookings by understanding the Herm STR occupancy trends. Seasonal demand shifts significantly influence how often properties are booked. Typically, Augustsees the highest demand (peak season occupancy), while January experiences the lowest (low season). Effective strategies, like adjusting minimum stays or offering promotions, can boost occupancy during slower periods. Here's how different property tiers perform in Herm:
- Best-in-class properties (Top 10%) achieve 66%+ occupancy, indicating high desirability and potentially optimized availability.
- Strong performing properties (Top 25%) maintain 48% or higher occupancy, suggesting good market fit and guest satisfaction.
- Typical properties (Median) have an occupancy rate around 32%.
- Entry-level properties (Bottom 25%) average 17% occupancy, potentially facing higher vacancy.
Average Monthly Occupancy Rate Trend in Herm
Average Daily Rate (ADR) Airbnb Trends in Herm (2025)
Effective short term rental pricing strategy in Herm involves understanding monthly ADR fluctuations. The Average Daily Rate (ADR) for Airbnb in Herm typically peaks in August and dips lowest during March. Leveraging Airbnb dynamic pricing tools or strategies based on this seasonality can significantly boost revenue. Here's a look at the typical nightly rates achieved:
- Best-in-class properties (Top 10%) command rates of $140+ per night, often due to premium features or locations.
- Strong performing properties (Top 25%) achieve nightly rates of $98 or more.
- Typical properties (Median) charge around $83 per night.
- Entry-level properties (Bottom 25%) earn around $62 per night.
Average Daily Rate (ADR) Trend by Month in Herm
Get Live Herm Market Intelligence 👇

Explore Real-time Analytics
Airbnb Seasonality Analysis & Trends in Herm (2025)
Peak Season (April, August, May)
- Revenue averages $2,592 per month
- Occupancy rates average 48.3%
- Daily rates average $110
Shoulder Season
- Revenue averages $1,509 per month
- Occupancy maintains around 38.2%
- Daily rates hold near $109
Low Season (January, February, March)
- Revenue drops to average $594 per month
- Occupancy decreases to average 17.4%
- Daily rates adjust to average $107
Seasonality Insights for Herm
- The Airbnb seasonality in Herm shows highly seasonal trends requiring careful strategy. While the sections above show seasonal averages, it's also insightful to look at the extremes:
- During the high season, the absolute peak month showcases Herm's highest earning potential, with monthly revenues capable of climbing to $2,719, occupancy reaching a high of 70.7%, and ADRs peaking at $113.
- Conversely, the slowest single month of the year, typically falling within the low season, marks the market's lowest point. In this month, revenue might dip to $541, occupancy could drop to 12.9%, and ADRs may adjust down to $106.
- Understanding both the seasonal averages and these monthly peaks and troughs in revenue, occupancy, and ADR is crucial for maximizing your Airbnb profit potential in Herm.
Seasonal Strategies for Maximizing Profit
- Peak Season: Maximize revenue through premium pricing and potentially longer minimum stays. Ensure high availability.
- Low Season: Offer competitive pricing, special promotions (e.g., extended stay discounts), and flexible cancellation policies. Target off-season travelers like remote workers or budget-conscious guests.
- Shoulder Seasons: Implement dynamic pricing that balances peak and low rates. Target weekend travelers or specific events. Offer slightly more flexible terms than peak season.
- Regularly analyze your own performance against these Herm seasonality benchmarks and adjust your pricing and availability strategy accordingly.
Best Areas for Airbnb Investment in Herm (2025)
Exploring the top neighborhoods for short-term rentals in Herm? This section highlights key areas, outlining why they are attractive for hosts and guests, along with notable local attractions. Consider these locations based on your target guest profile and investment strategy.
| Neighborhood / Area | Why Host Here? (Target Guests & Appeal) | Key Attractions & Landmarks |
|---|---|---|
| Saint-Émilion | Famous for its wine production and medieval architecture, Saint-Émilion attracts wine enthusiasts and tourists interested in history and culture. The picturesque village offers a unique backdrop for visitors. | Saint-Émilion Monolithic Church, Château Ausone, Château Cheval Blanc, Les Cordeliers Cloister, Wine estates tours |
| Bordeaux | A vibrant city known for its wine and gastronomy. Bordeaux's rich history, stunning architecture, and growing arts scene make it appealing to travelers. Its proximity to wine regions increases its attractiveness. | Place de la Bourse, Cité du Vin, Les Quais, Bordeaux Museum of Contemporary Art, Saint-André Cathedral |
| Arcachon | A beautiful seaside town famous for its beaches and the Dune du Pilat, the tallest sand dune in Europe. It's perfect for travelers seeking nature and beach experiences. | Dune du Pilat, Arcachon Bay, Thiers Jetty, Bird Island, Winter Town |
| La Rochelle | A historic port city with stunning architecture and a bustling harbor. Popular for its maritime history and vibrant cultural scene, attracting tourists year-round. | Old Port, La Rochelle Aquarium, Towers of La Rochelle, Central Market, Porte de la Grosse Horloge |
| Périgueux | Known for its rich Gallo-Roman heritage and picturesque old town. Ideal for visitors interested in history and local cuisine, especially truffles and foie gras. | Vesunna Gallo-Roman Museum, Périgueux Cathedral, Historical center, Brantôme, Truffle farms |
| Angoulême | Renowned for its comic strip festival and vibrant arts scene. The city attracts both art lovers and families, making it a diverse destination. | Angoulême International Comics Festival, Cité de la Bande Dessinée, Angoulême Cathedral, The Paper Museum, Château d'Angoulême |
| Sarlat-la-Canéda | Famous for its well-preserved medieval architecture and vibrant market, Sarlat is a hub for tourists exploring the Dordogne region and seeking a unique cultural experience. | Sarlat Market, La Liberté Square, Saint-Sacerdos Cathedral, Dordogne River, Medieval Festivals |
| Cognac | Famous for its brandy production and beautiful riverfront location, Cognac attracts visitors interested in distilleries and the production of fine spirits. | Hennessy Distillery, Cognac Museum, Saint-Léger Church, Riverside walks, Cognac vineyards |
Understanding Airbnb License Requirements & STR Laws in Herm (2025)
With 11% of listings showing registration in 2025, understanding potential Airbnb license requirements is crucial in Herm. Always verify the latest short term rental regulations and Airbnb license requirements directly with local government authorities for Herm to ensure full compliance before hosting.
(Source: AirROI data, 2025, based on 11% licensed listings)
Top Performing Airbnb Properties in Herm (2025)
Benchmark your potential! Explore examples of top-performing Airbnb properties in Hermbased on Trailing Twelve Month (TTM) revenue. Analyze their characteristics, revenue, occupancy rate, and ADR to understand what drives success in this market.
VILLA PAUL
Entire Place • 5 bedrooms
villa of 270 m2 jacuzzi pool ect... 18 pers max
Entire Place • 7 bedrooms

Forest Lisière and Near Ocean
Entire Place • 1 bedroom
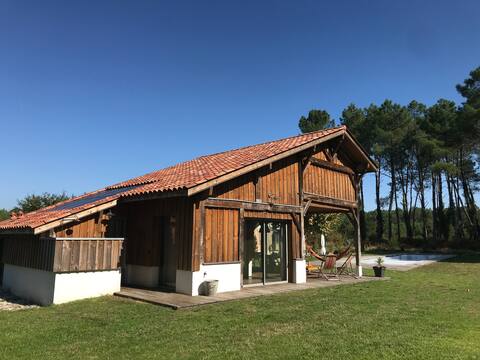
Chalet in the Landes forest
Entire Place • 2 bedrooms
At the heart of a Landes village
Entire Place • 1 bedroom
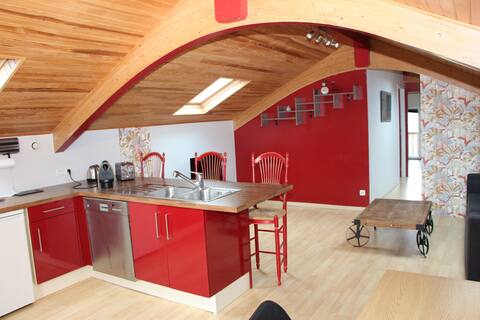
Independent studio - 2 guests/private jacuzzi
Entire Place • 1 bedroom
Note: Performance varies based on location, size, amenities, seasonality, and management quality. Data reflects the past 12 months.
Top Performing Airbnb Hosts in Herm (2025)
Learn from the best! This table showcases top-performing Airbnb hosts in Herm based on the number of properties managed and estimated total revenue over the past year. Analyze their scale and performance metrics.
| Host Name | Properties | Grossing Revenue | Stay Reviews | Avg Rating |
|---|---|---|---|---|
| PatriceetCarine | 6 | $61,022 | 32 | 3.19/5.0 |
| Éric | 1 | $29,637 | 19 | 4.21/5.0 |
| Vanessa | 1 | $23,169 | 24 | 4.92/5.0 |
| Claire | 1 | $22,925 | 12 | 4.92/5.0 |
| Jeannette Et Clément | 1 | $15,848 | 18 | 4.83/5.0 |
| Joël | 1 | $13,737 | 50 | 4.94/5.0 |
| Estelle | 1 | $10,422 | 28 | 4.96/5.0 |
| Jean-Louis | 1 | $10,166 | 25 | 4.80/5.0 |
| Nathy | 1 | $5,813 | 17 | 5.00/5.0 |
| Philippe | 1 | $4,405 | 4 | 5.00/5.0 |
Analyzing the strategies of top hosts, such as their property selection, pricing, and guest communication, can offer valuable lessons for optimizing your own Airbnb operations in Herm.
Dive Deeper: Advanced Herm STR Market Data (2025)
Ready to unlock more insights? AirROI provides access to advanced metrics and comprehensive Airbnb data for Herm. Explore detailed analytics beyond this report to refine your investment strategy, optimize pricing, and maximize your vacation rental profits.
Explore Advanced MetricsHerm Short-Term Rental Market Composition (2025): Property & Room Types
Room Type Distribution
Property Type Distribution
Market Composition Insights for Herm
- The Herm Airbnb market composition is heavily skewed towards Entire Home/Apt listings, which make up 73.7% of the 19 active rentals. This indicates strong guest preference for privacy and space.
- Looking at the property type distribution in Herm, House properties are the most common (73.7%), reflecting the local real estate landscape.
- Houses represent a significant 73.7% portion, catering likely to families or larger groups.
- The presence of 15.8% Hotel/Boutique listings indicates integration with traditional hospitality.
Herm Airbnb Room Capacity Analysis (2025): Bedroom Distribution
Distribution of Listings by Number of Bedrooms
Room Capacity Insights for Herm
- The dominant room capacity in Herm is 1 bedroom listings, making up 47.4% of the market. This suggests a strong demand for properties suitable for couples or solo travelers.
- Together, 1 bedroom and 2 bedrooms properties represent 63.2% of the active Airbnb listings in Herm, indicating a high concentration in these sizes.
Herm Vacation Rental Guest Capacity Trends (2025)
Distribution of Listings by Guest Capacity
Guest Capacity Insights for Herm
- The most common guest capacity trend in Herm vacation rentals is listings accommodating 2 guests (26.3%). This suggests the primary traveler segment is likely couples or solo travelers.
- Properties designed for 2 guests and 4 guests dominate the Herm STR market, accounting for 47.4% of listings.
- 15.8% of properties accommodate 6+ guests, serving the market segment for larger families or group travel in Herm.
- On average, properties in Herm are equipped to host 3.3 guests.
Herm Airbnb Booking Patterns (2025): Available vs. Booked Days
Available Days Distribution
Booked Days Distribution
Booking Pattern Insights for Herm
- The most common availability pattern in Herm falls within the 271-366 days range, representing 63.2% of listings. This suggests many properties have significant open periods on their calendars.
- Approximately 73.7% of listings show high availability (181+ days open annually), indicating potential for increased bookings or specific owner usage patterns.
- For booked days, the 31-90 days range is most frequent in Herm (57.9%), reflecting common guest stay durations or potential owner blocking patterns.
- A notable 26.3% of properties secure long booking periods (181+ days booked per year), highlighting successful long-term rental strategies or significant owner usage.
Herm Airbnb Minimum Stay Requirements Analysis
Distribution of Listings by Minimum Night Requirement
2 Nights
10 listings
52.6% of total
3 Nights
2 listings
10.5% of total
4-6 Nights
3 listings
15.8% of total
7-29 Nights
2 listings
10.5% of total
30+ Nights
2 listings
10.5% of total
Key Insights
- The most prevalent minimum stay requirement in Herm is 2 Nights, adopted by 52.6% of listings. This highlights the market's preference for shorter, flexible bookings.
- A significant segment (10.5%) caters to monthly stays (30+ nights) in Herm, pointing to opportunities in the extended-stay market.
Recommendations
- Align with the market by considering a 2 Nights minimum stay, as 52.6% of Herm hosts use this setting.
- A 2-night minimum appears standard (52.6%). Consider this for weekends or peak periods.
- Explore offering discounts for stays of 30+ nights to attract the 10.5% of the market seeking extended stays.
- Adjust minimum nights based on seasonality – potentially shorter during low season and longer during peak demand periods in Herm.
Herm Airbnb Cancellation Policy Trends Analysis (2025)
Flexible
4 listings
23.5% of total
Moderate
4 listings
23.5% of total
Firm
5 listings
29.4% of total
Strict
4 listings
23.5% of total
Cancellation Policy Insights for Herm
- The prevailing Airbnb cancellation policy trend in Herm is Firm, used by 29.4% of listings.
- A majority (52.9%) of hosts in Herm utilize Firm or Strict policies, indicating a market where hosts prioritize booking security.
Recommendations for Hosts
- Consider adopting a Firm policy to align with the 29.4% market standard in Herm.
- Regularly review your cancellation policy against competitors and market demand shifts in Herm.
Herm STR Booking Lead Time Analysis (2025)
Average Booking Lead Time by Month
Booking Lead Time Insights for Herm
- The overall average booking lead time for vacation rentals in Herm is 60 days.
- Guests book furthest in advance for stays during January (average 92 days), likely coinciding with peak travel demand or local events.
- The shortest booking windows occur for stays in November (average 0 days), indicating more last-minute travel plans during this time.
- Seasonally, Summer (72 days avg.) sees the longest lead times, while Fall (20 days avg.) has the shortest, reflecting typical travel planning cycles.
Recommendations for Hosts
- Use the overall average lead time (60 days) as a baseline for your pricing and availability strategy in Herm.
- For January stays, consider implementing length-of-stay discounts or slightly higher rates for bookings made less than 92 days out to capitalize on advance planning.
- During November, focus on last-minute booking availability and promotions, as guests book with very short notice (0 days avg.).
- Target marketing efforts for the Summer season well in advance (at least 72 days) to capture early planners.
- Monitor your own booking lead times against these Herm averages to identify opportunities for dynamic pricing adjustments.
Popular & Essential Airbnb Amenities in Herm (2025)
Amenity Prevalence
Amenity Insights for Herm
- Popular amenities like Hangers, Free parking on premises, Smoke alarm are common but not universal. Offering these can provide a competitive edge.
- Warning: Wifi is not universally provided but is considered essential globally. Ensure reliable Wifi is offered.
Recommendations for Hosts
- Consider adding popular differentiators like Hangers or Free parking on premises to increase appeal.
- Highlight unique or less common amenities you offer (e.g., hot tub, dedicated workspace, EV charger) in your listing description and photos.
- Regularly check competitor amenities in Herm to stay competitive.
Herm Airbnb Guest Demographics & Profile Analysis (2025)
Guest Profile Summary for Herm
- The typical guest profile for Airbnb in Herm consists of primarily domestic travelers (78%), often arriving from nearby Paris, typically belonging to the Post-2000s (Gen Z/Alpha) group (50%), primarily speaking French or English.
- Domestic travelers account for 78.0% of guests.
- Key international markets include France (78%) and Spain (8.5%).
- Top languages spoken are French (37.2%) followed by English (23.3%).
- A significant demographic segment is the Post-2000s (Gen Z/Alpha) group, representing 50% of guests.
Recommendations for Hosts
- Target domestic marketing efforts towards travelers from Paris and Barcelona.
- Tailor amenities and listing descriptions to appeal to the dominant Post-2000s (Gen Z/Alpha) demographic (e.g., highlight fast WiFi, smart home features, local guides).
- Highlight unique local experiences or amenities relevant to the primary guest profile.
- Consider seasonal promotions aligned with peak travel times for key origin markets.
Nearby Short-Term Rental Market Comparison
How does the Herm Airbnb market stack up against its neighbors? Compare key performance metrics like average monthly revenue, ADR, and occupancy rates in surrounding areas to understand the broader regional STR landscape.
| Market | Active Properties | Monthly Revenue | Daily Rate | Avg. Occupancy |
|---|---|---|---|---|
| San Sebastián | 1,426 | $3,546 | $262.81 | 49% |
| Saint-Laurent-des-Combes | 11 | $3,526 | $706.18 | 23% |
| Gautegiz Arteaga | 21 | $2,865 | $293.66 | 38% |
| Cénac | 18 | $2,773 | $268.58 | 53% |
| Labastida/Bastida | 11 | $2,662 | $268.80 | 34% |
| Cérons | 11 | $2,635 | $196.16 | 39% |
| Barrika | 13 | $2,629 | $314.61 | 41% |
| Galgon | 12 | $2,599 | $210.34 | 48% |
| Esteribar | 20 | $2,574 | $276.81 | 32% |
| Hernani | 11 | $2,572 | $345.16 | 40% |