Eaux-Bonnes Airbnb Market Analysis 2025: Short Term Rental Data & Vacation Rental Statistics in Nouvelle-Aquitaine, France
Is Airbnb profitable in Eaux-Bonnes in 2025? Explore comprehensive Airbnb analytics for Eaux-Bonnes, Nouvelle-Aquitaine, France to uncover income potential. This 2025 STR market report for Eaux-Bonnes, based on AirROI data from April 2024 to March 2025, reveals key trends in the market of 255 active listings.
Whether you're considering an Airbnb investment in Eaux-Bonnes, optimizing your existing vacation rental, or exploring rental arbitrage opportunities, understanding the Eaux-Bonnes Airbnb data is crucial. Leveraging the low regulation environment is key to maximizing your short term rental income potential. Let's dive into the specifics.
Key Eaux-Bonnes Airbnb Performance Metrics Overview
Monthly Airbnb Revenue Variations & Income Potential in Eaux-Bonnes (2025)
Understanding the monthly revenue variations for Airbnb listings in Eaux-Bonnes is key to maximizing your short term rental income potential. Seasonality significantly impacts earnings. Our analysis, based on data from the past 12 months, shows that the peak revenue month for STRs in Eaux-Bonnes is typically February, while October often presents the lowest earnings, highlighting opportunities for strategic pricing adjustments during shoulder and low seasons. Explore the typical Airbnb income in Eaux-Bonnes across different performance tiers:
- Best-in-class properties (Top 10%) achieve $2,131+ monthly, often utilizing dynamic pricing and superior guest experiences.
- Strong performing properties (Top 25%) earn $1,474 or more, indicating effective management and desirable locations/amenities.
- Typical properties (Median) generate around $826 per month, representing the average market performance.
- Entry-level properties (Bottom 25%) see earnings around $405, often with potential for optimization.
Average Monthly Airbnb Earnings Trend in Eaux-Bonnes
Eaux-Bonnes Airbnb Occupancy Rate Trends (2025)
Maximize your bookings by understanding the Eaux-Bonnes STR occupancy trends. Seasonal demand shifts significantly influence how often properties are booked. Typically, Februarysees the highest demand (peak season occupancy), while October experiences the lowest (low season). Effective strategies, like adjusting minimum stays or offering promotions, can boost occupancy during slower periods. Here's how different property tiers perform in Eaux-Bonnes:
- Best-in-class properties (Top 10%) achieve 67%+ occupancy, indicating high desirability and potentially optimized availability.
- Strong performing properties (Top 25%) maintain 47% or higher occupancy, suggesting good market fit and guest satisfaction.
- Typical properties (Median) have an occupancy rate around 30%.
- Entry-level properties (Bottom 25%) average 14% occupancy, potentially facing higher vacancy.
Average Monthly Occupancy Rate Trend in Eaux-Bonnes
Average Daily Rate (ADR) Airbnb Trends in Eaux-Bonnes (2025)
Effective short term rental pricing strategy in Eaux-Bonnes involves understanding monthly ADR fluctuations. The Average Daily Rate (ADR) for Airbnb in Eaux-Bonnes typically peaks in February and dips lowest during November. Leveraging Airbnb dynamic pricing tools or strategies based on this seasonality can significantly boost revenue. Here's a look at the typical nightly rates achieved:
- Best-in-class properties (Top 10%) command rates of $191+ per night, often due to premium features or locations.
- Strong performing properties (Top 25%) achieve nightly rates of $122 or more.
- Typical properties (Median) charge around $86 per night.
- Entry-level properties (Bottom 25%) earn around $67 per night.
Average Daily Rate (ADR) Trend by Month in Eaux-Bonnes
Get Live Eaux-Bonnes Market Intelligence 👇

Explore Real-time Analytics
Airbnb Seasonality Analysis & Trends in Eaux-Bonnes (2025)
Peak Season (February, August, March)
- Revenue averages $1,509 per month
- Occupancy rates average 47.9%
- Daily rates average $117
Shoulder Season
- Revenue averages $1,064 per month
- Occupancy maintains around 29.2%
- Daily rates hold near $113
Low Season (September, October, November)
- Revenue drops to average $686 per month
- Occupancy decreases to average 26.7%
- Daily rates adjust to average $107
Seasonality Insights for Eaux-Bonnes
- The Airbnb seasonality in Eaux-Bonnes shows highly seasonal trends requiring careful strategy. While the sections above show seasonal averages, it's also insightful to look at the extremes:
- During the high season, the absolute peak month showcases Eaux-Bonnes's highest earning potential, with monthly revenues capable of climbing to $1,941, occupancy reaching a high of 60.0%, and ADRs peaking at $124.
- Conversely, the slowest single month of the year, typically falling within the low season, marks the market's lowest point. In this month, revenue might dip to $547, occupancy could drop to 21.6%, and ADRs may adjust down to $107.
- Understanding both the seasonal averages and these monthly peaks and troughs in revenue, occupancy, and ADR is crucial for maximizing your Airbnb profit potential in Eaux-Bonnes.
Seasonal Strategies for Maximizing Profit
- Peak Season: Maximize revenue through premium pricing and potentially longer minimum stays. Ensure high availability.
- Low Season: Offer competitive pricing, special promotions (e.g., extended stay discounts), and flexible cancellation policies. Target off-season travelers like remote workers or budget-conscious guests.
- Shoulder Seasons: Implement dynamic pricing that balances peak and low rates. Target weekend travelers or specific events. Offer slightly more flexible terms than peak season.
- Regularly analyze your own performance against these Eaux-Bonnes seasonality benchmarks and adjust your pricing and availability strategy accordingly.
Best Areas for Airbnb Investment in Eaux-Bonnes (2025)
Exploring the top neighborhoods for short-term rentals in Eaux-Bonnes? This section highlights key areas, outlining why they are attractive for hosts and guests, along with notable local attractions. Consider these locations based on your target guest profile and investment strategy.
| Neighborhood / Area | Why Host Here? (Target Guests & Appeal) | Key Attractions & Landmarks |
|---|---|---|
| Eaux-Bonnes | Eaux-Bonnes is a charming spa town nestled in the Pyrénées mountains, known for its thermal springs and stunning natural beauty. It's a popular destination for wellness tourism and outdoor activities, making it appealing for travelers seeking relaxation and adventure. | Thermal Baths, Skiing at Eaux-Bonnes Ski Resort, Cirque de Lescun, Randonnée in the Pyrénées, Local Gastronomy, Parc National des Pyrénées |
| Gourette | Gourette, located close to Eaux-Bonnes, is a renowned ski resort in winter and a hiking paradise in summer. Its proximity to Eaux-Bonnes makes it a perfect complementary destination for visitors looking to enjoy the mountains year-round. | Gourette Ski Resort, Lac de Gourette, Hikes and Trails, Paragliding, Local Shops and Cafés |
| Laruns | Laruns is a picturesque village in the foothills of the Pyrénées, rich in history and culture. It's close to both Eaux-Bonnes and Gourette and serves as a gateway to numerous outdoor adventures, attracting nature lovers and families. | St. John the Baptist Church, Château de Laruns, Local Markets, Hiking Trails, Cycling Routes |
| Oloron-Sainte-Marie | A larger town near Eaux-Bonnes, Oloron-Sainte-Marie offers a mix of urban amenities and beautiful landscapes. It's a cultural hub with historical sites, making it perfect for guests wanting both adventure and city experience. | Oloron Cathedral, Les Gorges de Kakuetta, Local Festivals, Canoeing on the Gave d'Oloron, Regional Cuisine |
| Arette | Arette is a quaint village located nearby, known for its serene environment and outdoor sports. It provides a peaceful retreat for vacationers, especially those interested in hiking and alpine activities. | Arette Castle, Hiking Trails, Local Craft Shops, Scenic Views, Cultural Events |
| Bedous | Known as the 'Gateway to the Pyrénées', Bedous is a small village ideal for live-in hosts looking for rural charm. It attracts outdoor enthusiasts and families seeking to explore the surrounding nature. | Bedous Tourism Office, Mountain Biking, Nearby Waterfalls, Cultural Heritage Sites, Annual Local Events |
| Cauterets | Cauterets is a popular spa town and ski destination that offers delightful thermal baths and ski slopes. It is an attractive location for those interested in both winter sports and summer hiking. | Cauterets Ski Resort, Thermal Spa, Pont d'Espagne, Hiking Trails, Summer Music Festivals |
| Saint-Jean-Pied-de-Port | This charming town on the Route of Santiago de Compostela is known for its stunning medieval architecture and vibrant markets. Its historical significance and localized tourism make it a compelling site for Airbnb hosting. | Citadel of Saint-Jean-Pied-de-Port, Camino de Santiago Trail, Local Bazaars, Historic Fortifications, Culinary Tours |
Understanding Airbnb License Requirements & STR Laws in Eaux-Bonnes (2025)
While Eaux-Bonnes, Nouvelle-Aquitaine, France currently shows low STR regulations, specific Airbnb license requirements might still exist or change. Always verify the latest short term rental regulations and Airbnb license requirements directly with local government authorities for Eaux-Bonnes to ensure full compliance before hosting.
(Source: AirROI data, 2025, based on 6% licensed listings)
Top Performing Airbnb Properties in Eaux-Bonnes (2025)
Benchmark your potential! Explore examples of top-performing Airbnb properties in Eaux-Bonnesbased on Trailing Twelve Month (TTM) revenue. Analyze their characteristics, revenue, occupancy rate, and ADR to understand what drives success in this market.

Charming mountain cottage
Entire Place • 4 bedrooms

Appartement Eaux Bonnes T5
Entire Place • 4 bedrooms

Quiet Binlunga house, mountain view.
Entire Place • 3 bedrooms
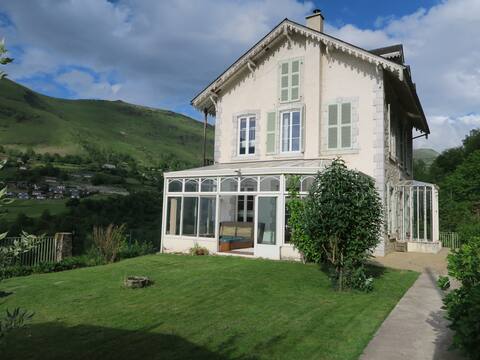
Villa Bellevue in Eaux-Bonnes
Entire Place • 5 bedrooms
Apartment Type Chalet, Gourette, Pied des Pistes
Entire Place • 3 bedrooms
Chalet Chaperon Rouge, Gourette
Entire Place • 2 bedrooms
Note: Performance varies based on location, size, amenities, seasonality, and management quality. Data reflects the past 12 months.
Top Performing Airbnb Hosts in Eaux-Bonnes (2025)
Learn from the best! This table showcases top-performing Airbnb hosts in Eaux-Bonnes based on the number of properties managed and estimated total revenue over the past year. Analyze their scale and performance metrics.
| Host Name | Properties | Grossing Revenue | Stay Reviews | Avg Rating |
|---|---|---|---|---|
| IBC Immobilier | 17 | $129,351 | 53 | 2.46/5.0 |
| Manuel Et Wanda | 9 | $46,079 | 219 | 4.87/5.0 |
| Baptiste | 2 | $44,478 | 11 | 4.80/5.0 |
| Host #470132640 | 4 | $36,956 | 1 | 0.00/5.0 |
| Martine | 1 | $36,685 | 41 | 4.85/5.0 |
| Mathilde | 3 | $36,382 | 150 | 3.23/5.0 |
| Jose | 2 | $32,069 | 36 | 4.73/5.0 |
| Xavier | 2 | $31,939 | 104 | 4.88/5.0 |
| Dany | 3 | $31,401 | 233 | 4.73/5.0 |
| Lucie | 2 | $30,148 | 46 | 4.92/5.0 |
Analyzing the strategies of top hosts, such as their property selection, pricing, and guest communication, can offer valuable lessons for optimizing your own Airbnb operations in Eaux-Bonnes.
Dive Deeper: Advanced Eaux-Bonnes STR Market Data (2025)
Ready to unlock more insights? AirROI provides access to advanced metrics and comprehensive Airbnb data for Eaux-Bonnes. Explore detailed analytics beyond this report to refine your investment strategy, optimize pricing, and maximize your vacation rental profits.
Explore Advanced MetricsEaux-Bonnes Short-Term Rental Market Composition (2025): Property & Room Types
Room Type Distribution
Property Type Distribution
Market Composition Insights for Eaux-Bonnes
- The Eaux-Bonnes Airbnb market composition is heavily skewed towards Entire Home/Apt listings, which make up 98.8% of the 255 active rentals. This indicates strong guest preference for privacy and space.
- Looking at the property type distribution in Eaux-Bonnes, Apartment/Condo properties are the most common (87.8%), reflecting the local real estate landscape.
- Smaller segments like outdoor/unique, others, hotel/boutique, unique stays (combined 2.4%) offer potential for unique stay experiences.
Eaux-Bonnes Airbnb Room Capacity Analysis (2025): Bedroom Distribution
Distribution of Listings by Number of Bedrooms
Room Capacity Insights for Eaux-Bonnes
- The dominant room capacity in Eaux-Bonnes is 1 bedroom listings, making up 47.5% of the market. This suggests a strong demand for properties suitable for couples or solo travelers.
- Together, 1 bedroom and 2 bedrooms properties represent 65.9% of the active Airbnb listings in Eaux-Bonnes, indicating a high concentration in these sizes.
Eaux-Bonnes Vacation Rental Guest Capacity Trends (2025)
Distribution of Listings by Guest Capacity
Guest Capacity Insights for Eaux-Bonnes
- The most common guest capacity trend in Eaux-Bonnes vacation rentals is listings accommodating 6 guests (40%). This suggests the primary traveler segment is likely larger groups.
- Properties designed for 6 guests and 4 guests dominate the Eaux-Bonnes STR market, accounting for 68.6% of listings.
- 57.2% of properties accommodate 6+ guests, serving the market segment for larger families or group travel in Eaux-Bonnes.
- On average, properties in Eaux-Bonnes are equipped to host 5.5 guests.
Eaux-Bonnes Airbnb Booking Patterns (2025): Available vs. Booked Days
Available Days Distribution
Booked Days Distribution
Booking Pattern Insights for Eaux-Bonnes
- The most common availability pattern in Eaux-Bonnes falls within the 271-366 days range, representing 59.2% of listings. This suggests many properties have significant open periods on their calendars.
- Approximately 92.1% of listings show high availability (181+ days open annually), indicating potential for increased bookings or specific owner usage patterns.
- For booked days, the 31-90 days range is most frequent in Eaux-Bonnes (36.9%), reflecting common guest stay durations or potential owner blocking patterns.
- A notable 8.6% of properties secure long booking periods (181+ days booked per year), highlighting successful long-term rental strategies or significant owner usage.
Eaux-Bonnes Airbnb Minimum Stay Requirements Analysis
Distribution of Listings by Minimum Night Requirement
1 Night
21 listings
8.6% of total
2 Nights
79 listings
32.4% of total
3 Nights
20 listings
8.2% of total
4-6 Nights
45 listings
18.4% of total
7-29 Nights
16 listings
6.6% of total
30+ Nights
63 listings
25.8% of total
Key Insights
- The most prevalent minimum stay requirement in Eaux-Bonnes is 2 Nights, adopted by 32.4% of listings. This highlights the market's preference for shorter, flexible bookings.
- A significant segment (25.8%) caters to monthly stays (30+ nights) in Eaux-Bonnes, pointing to opportunities in the extended-stay market.
Recommendations
- Align with the market by considering a 2 Nights minimum stay, as 32.4% of Eaux-Bonnes hosts use this setting.
- If feasible, allowing 1-night stays, especially midweek or during low season, could capture last-minute bookings, as only 8.6% currently do.
- A 2-night minimum appears standard (32.4%). Consider this for weekends or peak periods.
- Explore offering discounts for stays of 30+ nights to attract the 25.8% of the market seeking extended stays.
- Adjust minimum nights based on seasonality – potentially shorter during low season and longer during peak demand periods in Eaux-Bonnes.
Eaux-Bonnes Airbnb Cancellation Policy Trends Analysis (2025)
Super Strict 60 Days
9 listings
4% of total
Super Strict 30 Days
1 listings
0.4% of total
Flexible
30 listings
13.5% of total
Moderate
45 listings
20.2% of total
Firm
56 listings
25.1% of total
Strict
82 listings
36.8% of total
Cancellation Policy Insights for Eaux-Bonnes
- The prevailing Airbnb cancellation policy trend in Eaux-Bonnes is Strict, used by 36.8% of listings.
- A majority (61.9%) of hosts in Eaux-Bonnes utilize Firm or Strict policies, indicating a market where hosts prioritize booking security.
Recommendations for Hosts
- Consider adopting a Strict policy to align with the 36.8% market standard in Eaux-Bonnes.
- With 36.8% using Strict terms, this is a viable option in Eaux-Bonnes, particularly for high-value properties or during peak demand periods.
- Regularly review your cancellation policy against competitors and market demand shifts in Eaux-Bonnes.
Eaux-Bonnes STR Booking Lead Time Analysis (2025)
Average Booking Lead Time by Month
Booking Lead Time Insights for Eaux-Bonnes
- The overall average booking lead time for vacation rentals in Eaux-Bonnes is 45 days.
- Guests book furthest in advance for stays during February (average 67 days), likely coinciding with peak travel demand or local events.
- The shortest booking windows occur for stays in October (average 25 days), indicating more last-minute travel plans during this time.
- Seasonally, Spring (52 days avg.) sees the longest lead times, while Fall (31 days avg.) has the shortest, reflecting typical travel planning cycles.
Recommendations for Hosts
- Use the overall average lead time (45 days) as a baseline for your pricing and availability strategy in Eaux-Bonnes.
- For February stays, consider implementing length-of-stay discounts or slightly higher rates for bookings made less than 67 days out to capitalize on advance planning.
- Target marketing efforts for the Spring season well in advance (at least 52 days) to capture early planners.
- Monitor your own booking lead times against these Eaux-Bonnes averages to identify opportunities for dynamic pricing adjustments.
Popular & Essential Airbnb Amenities in Eaux-Bonnes (2025)
Amenity Prevalence
Amenity Insights for Eaux-Bonnes
- Essential amenities in Eaux-Bonnes that guests expect include: Kitchen, TV, Heating, Hot water. Lacking these (any) could significantly impact bookings.
- Popular amenities like Smoke alarm, Dishes and silverware, Cooking basics are common but not universal. Offering these can provide a competitive edge.
Recommendations for Hosts
- Ensure your listing includes all essential amenities for Eaux-Bonnes: Kitchen, TV, Heating, Hot water.
- Prioritize adding missing essentials: Kitchen, TV, Heating, Hot water.
- Consider adding popular differentiators like Smoke alarm or Dishes and silverware to increase appeal.
- Highlight unique or less common amenities you offer (e.g., hot tub, dedicated workspace, EV charger) in your listing description and photos.
- Regularly check competitor amenities in Eaux-Bonnes to stay competitive.
Eaux-Bonnes Airbnb Guest Demographics & Profile Analysis (2025)
Guest Profile Summary for Eaux-Bonnes
- The typical guest profile for Airbnb in Eaux-Bonnes consists of primarily domestic travelers (88%), often arriving from nearby Bordeaux, typically belonging to the Post-2000s (Gen Z/Alpha) group (50%), primarily speaking French or English.
- Domestic travelers account for 87.7% of guests.
- Key international markets include France (87.7%) and Spain (6.9%).
- Top languages spoken are French (44%) followed by English (32.1%).
- A significant demographic segment is the Post-2000s (Gen Z/Alpha) group, representing 50% of guests.
Recommendations for Hosts
- Target domestic marketing efforts towards travelers from Bordeaux and Paris.
- Tailor amenities and listing descriptions to appeal to the dominant Post-2000s (Gen Z/Alpha) demographic (e.g., highlight fast WiFi, smart home features, local guides).
- Highlight unique local experiences or amenities relevant to the primary guest profile.
- Consider seasonal promotions aligned with peak travel times for key origin markets.
Nearby Short-Term Rental Market Comparison
How does the Eaux-Bonnes Airbnb market stack up against its neighbors? Compare key performance metrics like average monthly revenue, ADR, and occupancy rates in surrounding areas to understand the broader regional STR landscape.
| Market | Active Properties | Monthly Revenue | Daily Rate | Avg. Occupancy |
|---|---|---|---|---|
| San Sebastián | 1,426 | $3,546 | $262.81 | 49% |
| Riudecanyes | 12 | $2,949 | $439.68 | 35% |
| Esteribar | 20 | $2,574 | $276.81 | 32% |
| Hernani | 11 | $2,572 | $345.16 | 40% |
| Azet | 13 | $2,500 | $245.55 | 43% |
| Larraun | 18 | $2,387 | $225.55 | 40% |
| Arbonne | 46 | $2,311 | $331.99 | 48% |
| Valle de Yerri/Deierri | 13 | $2,285 | $301.79 | 31% |
| Bazus-Aure | 13 | $2,192 | $172.26 | 44% |
| Hondarribia | 137 | $2,106 | $226.66 | 39% |