Dax Airbnb Market Analysis 2025: Short Term Rental Data & Vacation Rental Statistics in Nouvelle-Aquitaine, France
Is Airbnb profitable in Dax in 2025? Explore comprehensive Airbnb analytics for Dax, Nouvelle-Aquitaine, France to uncover income potential. This 2025 STR market report for Dax, based on AirROI data from April 2024 to March 2025, reveals key trends in the market of 223 active listings.
Whether you're considering an Airbnb investment in Dax, optimizing your existing vacation rental, or exploring rental arbitrage opportunities, understanding the Dax Airbnb data is crucial. Understanding the local regulations is key to maximizing your short term rental income potential. Let's dive into the specifics.
Key Dax Airbnb Performance Metrics Overview
Monthly Airbnb Revenue Variations & Income Potential in Dax (2025)
Understanding the monthly revenue variations for Airbnb listings in Dax is key to maximizing your short term rental income potential. Seasonality significantly impacts earnings. Our analysis, based on data from the past 12 months, shows that the peak revenue month for STRs in Dax is typically August, while January often presents the lowest earnings, highlighting opportunities for strategic pricing adjustments during shoulder and low seasons. Explore the typical Airbnb income in Dax across different performance tiers:
- Best-in-class properties (Top 10%) achieve $1,749+ monthly, often utilizing dynamic pricing and superior guest experiences.
- Strong performing properties (Top 25%) earn $1,251 or more, indicating effective management and desirable locations/amenities.
- Typical properties (Median) generate around $834 per month, representing the average market performance.
- Entry-level properties (Bottom 25%) see earnings around $438, often with potential for optimization.
Average Monthly Airbnb Earnings Trend in Dax
Dax Airbnb Occupancy Rate Trends (2025)
Maximize your bookings by understanding the Dax STR occupancy trends. Seasonal demand shifts significantly influence how often properties are booked. Typically, Augustsees the highest demand (peak season occupancy), while January experiences the lowest (low season). Effective strategies, like adjusting minimum stays or offering promotions, can boost occupancy during slower periods. Here's how different property tiers perform in Dax:
- Best-in-class properties (Top 10%) achieve 84%+ occupancy, indicating high desirability and potentially optimized availability.
- Strong performing properties (Top 25%) maintain 71% or higher occupancy, suggesting good market fit and guest satisfaction.
- Typical properties (Median) have an occupancy rate around 46%.
- Entry-level properties (Bottom 25%) average 22% occupancy, potentially facing higher vacancy.
Average Monthly Occupancy Rate Trend in Dax
Average Daily Rate (ADR) Airbnb Trends in Dax (2025)
Effective short term rental pricing strategy in Dax involves understanding monthly ADR fluctuations. The Average Daily Rate (ADR) for Airbnb in Dax typically peaks in August and dips lowest during March. Leveraging Airbnb dynamic pricing tools or strategies based on this seasonality can significantly boost revenue. Here's a look at the typical nightly rates achieved:
- Best-in-class properties (Top 10%) command rates of $106+ per night, often due to premium features or locations.
- Strong performing properties (Top 25%) achieve nightly rates of $66 or more.
- Typical properties (Median) charge around $50 per night.
- Entry-level properties (Bottom 25%) earn around $40 per night.
Average Daily Rate (ADR) Trend by Month in Dax
Get Live Dax Market Intelligence 👇

Explore Real-time Analytics
Airbnb Seasonality Analysis & Trends in Dax (2025)
Peak Season (August, July, May)
- Revenue averages $1,303 per month
- Occupancy rates average 53.7%
- Daily rates average $67
Shoulder Season
- Revenue averages $973 per month
- Occupancy maintains around 47.6%
- Daily rates hold near $66
Low Season (January, February, March)
- Revenue drops to average $602 per month
- Occupancy decreases to average 38.5%
- Daily rates adjust to average $65
Seasonality Insights for Dax
- The Airbnb seasonality in Dax shows highly seasonal trends requiring careful strategy. While the sections above show seasonal averages, it's also insightful to look at the extremes:
- During the high season, the absolute peak month showcases Dax's highest earning potential, with monthly revenues capable of climbing to $1,382, occupancy reaching a high of 60.7%, and ADRs peaking at $68.
- Conversely, the slowest single month of the year, typically falling within the low season, marks the market's lowest point. In this month, revenue might dip to $529, occupancy could drop to 32.3%, and ADRs may adjust down to $65.
- Understanding both the seasonal averages and these monthly peaks and troughs in revenue, occupancy, and ADR is crucial for maximizing your Airbnb profit potential in Dax.
Seasonal Strategies for Maximizing Profit
- Peak Season: Maximize revenue through premium pricing and potentially longer minimum stays. Ensure high availability.
- Low Season: Offer competitive pricing, special promotions (e.g., extended stay discounts), and flexible cancellation policies. Target off-season travelers like remote workers or budget-conscious guests.
- Shoulder Seasons: Implement dynamic pricing that balances peak and low rates. Target weekend travelers or specific events. Offer slightly more flexible terms than peak season.
- Regularly analyze your own performance against these Dax seasonality benchmarks and adjust your pricing and availability strategy accordingly.
Best Areas for Airbnb Investment in Dax (2025)
Exploring the top neighborhoods for short-term rentals in Dax? This section highlights key areas, outlining why they are attractive for hosts and guests, along with notable local attractions. Consider these locations based on your target guest profile and investment strategy.
| Neighborhood / Area | Why Host Here? (Target Guests & Appeal) | Key Attractions & Landmarks |
|---|---|---|
| Dax City Center | The vibrant heart of Dax, known for its thermal springs and historical architecture. It attracts tourists looking for a relaxing getaway combined with cultural experiences. | Thermal baths, Dax Cathedral, Arc de Triomphe, Dax Museum, Place de la Fontaine |
| Les Thermes | Home to the famous spa centers, this area is perfect for health and wellness tourism. Ideal for visitors seeking therapeutic treatments and relaxation. | Dax Spa, Thermal Parc, Centre des Romains, Les Jardins de la Mairie |
| Lamothe | A peaceful residential area that provides a quieter getaway while still being near the attractions of the city. Appeals to families and those looking for tranquility. | Parc de l'Adour, local parks, family-friendly cafés |
| St. Paul-lès-Dax | Adjacent to Dax, this area offers a suburban feel with access to the hustle and bustle of Dax city life. Great for those wanting a mix of urban and rural. | Gorges de l'Adour, local markets, Saint-Paul Church |
| Dax Lakes | Ideal for nature lovers, with beautiful lakes and outdoor activities. Great for visitors who enjoy water sports and nature walks. | Lac de Christus, fishing spots, walking trails, picnic areas |
| Bordeaux | Less than a two-hour drive, Bordeaux is a major city that attracts visitors for its wine culture and architecture. A good investment for Airbnb due to its proximity. | Place de la Bourse, Bordeaux Wine Museum, La Cité du Vin, Porte Cailhau |
| Capbreton | Nearby coastal town known for its beaches and surf culture. Attracts beachgoers and surfers, making it a popular alternative for those visiting Dax. | Capbreton Beach, Marina, surf schools, aquatic activities |
| Hossegor | Known for its surfing competitions and beautiful beaches, Hossegor is nearby and offers a luxurious experience. Very attractive to visitors who want seaside leisure. | Hossegor Beach, surf shops, Castsanheira Lake, golf courses |
Understanding Airbnb License Requirements & STR Laws in Dax (2025)
With 11% of listings showing registration in 2025, understanding potential Airbnb license requirements is crucial in Dax. Always verify the latest short term rental regulations and Airbnb license requirements directly with local government authorities for Dax to ensure full compliance before hosting.
(Source: AirROI data, 2025, based on 11% licensed listings)
Top Performing Airbnb Properties in Dax (2025)
Benchmark your potential! Explore examples of top-performing Airbnb properties in Daxbased on Trailing Twelve Month (TTM) revenue. Analyze their characteristics, revenue, occupancy rate, and ADR to understand what drives success in this market.
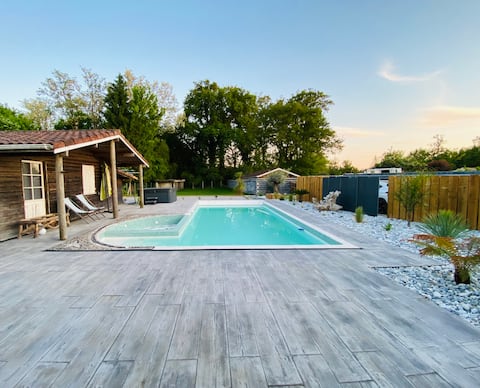
Beautiful villa with swimming pool
Entire Place • 4 bedrooms
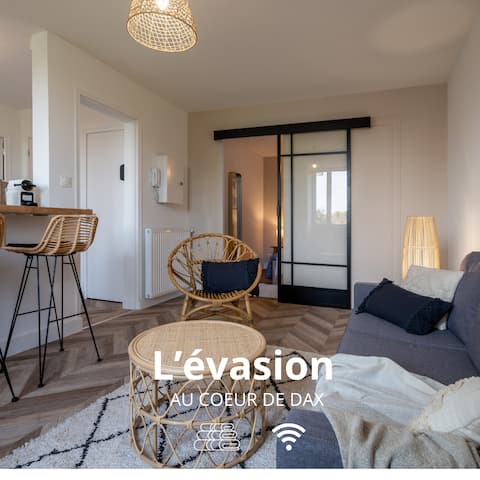
L 'Évasion - Your experience in the heart of Dax - T3
Entire Place • 2 bedrooms

The Secrets of Eros - LUXURY SUITE
Entire Place • 1 bedroom
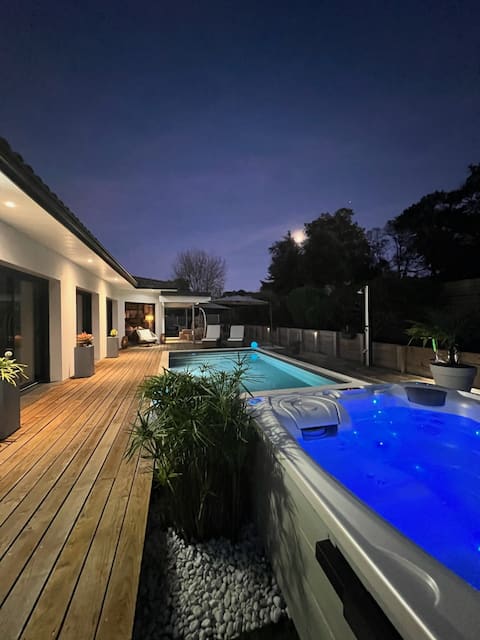
Quiet house, Pool and Hot Tub
Entire Place • 3 bedrooms

L'Apaisant - Comfort in the center of Dax - T2
Entire Place • 1 bedroom
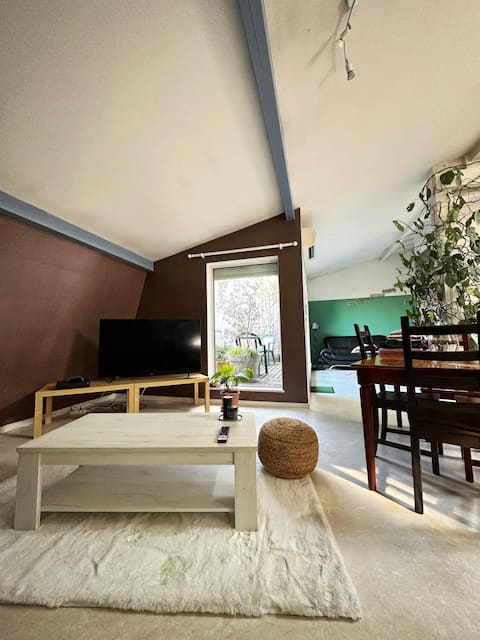
Architect's apartment in the heart of the city
Entire Place • 2 bedrooms
Note: Performance varies based on location, size, amenities, seasonality, and management quality. Data reflects the past 12 months.
Top Performing Airbnb Hosts in Dax (2025)
Learn from the best! This table showcases top-performing Airbnb hosts in Dax based on the number of properties managed and estimated total revenue over the past year. Analyze their scale and performance metrics.
| Host Name | Properties | Grossing Revenue | Stay Reviews | Avg Rating |
|---|---|---|---|---|
| Julien | 5 | $69,499 | 298 | 4.62/5.0 |
| Jérôme | 2 | $63,784 | 52 | 4.45/5.0 |
| Kevin Et Anaïs | 1 | $45,197 | 12 | 4.75/5.0 |
| Maud | 10 | $43,329 | 255 | 4.67/5.0 |
| Sonia | 3 | $41,801 | 166 | 4.89/5.0 |
| Corinne Et Fabrice | 2 | $37,871 | 51 | 4.83/5.0 |
| Boisvert | 3 | $36,250 | 372 | 4.88/5.0 |
| Laure | 5 | $35,128 | 247 | 4.76/5.0 |
| Candice | 1 | $32,467 | 15 | 4.80/5.0 |
| Antoine | 1 | $28,754 | 49 | 4.71/5.0 |
Analyzing the strategies of top hosts, such as their property selection, pricing, and guest communication, can offer valuable lessons for optimizing your own Airbnb operations in Dax.
Dive Deeper: Advanced Dax STR Market Data (2025)
Ready to unlock more insights? AirROI provides access to advanced metrics and comprehensive Airbnb data for Dax. Explore detailed analytics beyond this report to refine your investment strategy, optimize pricing, and maximize your vacation rental profits.
Explore Advanced MetricsDax Short-Term Rental Market Composition (2025): Property & Room Types
Room Type Distribution
Property Type Distribution
Market Composition Insights for Dax
- The Dax Airbnb market composition is heavily skewed towards Entire Home/Apt listings, which make up 87.9% of the 223 active rentals. This indicates strong guest preference for privacy and space.
- Looking at the property type distribution in Dax, Apartment/Condo properties are the most common (80.7%), reflecting the local real estate landscape.
- Smaller segments like hotel/boutique, others (combined 5.4%) offer potential for unique stay experiences.
Dax Airbnb Room Capacity Analysis (2025): Bedroom Distribution
Distribution of Listings by Number of Bedrooms
Room Capacity Insights for Dax
- The dominant room capacity in Dax is 1 bedroom listings, making up 56.5% of the market. This suggests a strong demand for properties suitable for couples or solo travelers.
- Together, 1 bedroom and 2 bedrooms properties represent 68.6% of the active Airbnb listings in Dax, indicating a high concentration in these sizes.
- With over half the market (56.5%) consisting of studios or 1-bedroom units, Dax is particularly well-suited for individuals or couples.
- Listings with 3+ bedrooms (6.2%) represent a smaller niche, potentially indicating an underserved market for larger group accommodations in Dax.
Dax Vacation Rental Guest Capacity Trends (2025)
Distribution of Listings by Guest Capacity
Guest Capacity Insights for Dax
- The most common guest capacity trend in Dax vacation rentals is listings accommodating 2 guests (55.6%). This suggests the primary traveler segment is likely couples or solo travelers.
- Properties designed for 2 guests and 4 guests dominate the Dax STR market, accounting for 78.5% of listings.
- A significant 56.0% of listings cater specifically to 1-2 guests, highlighting strong demand from couples and solo travelers in Dax.
- On average, properties in Dax are equipped to host 2.8 guests.
Dax Airbnb Booking Patterns (2025): Available vs. Booked Days
Available Days Distribution
Booked Days Distribution
Booking Pattern Insights for Dax
- The most common availability pattern in Dax falls within the 271-366 days range, representing 42.2% of listings. This suggests many properties have significant open periods on their calendars.
- Approximately 72.2% of listings show high availability (181+ days open annually), indicating potential for increased bookings or specific owner usage patterns.
- For booked days, the 91-180 days range is most frequent in Dax (30.5%), reflecting common guest stay durations or potential owner blocking patterns.
- A notable 28.7% of properties secure long booking periods (181+ days booked per year), highlighting successful long-term rental strategies or significant owner usage.
Dax Airbnb Minimum Stay Requirements Analysis
Distribution of Listings by Minimum Night Requirement
1 Night
52 listings
25.5% of total
2 Nights
42 listings
20.6% of total
3 Nights
37 listings
18.1% of total
4-6 Nights
41 listings
20.1% of total
7-29 Nights
17 listings
8.3% of total
30+ Nights
15 listings
7.4% of total
Key Insights
- The most prevalent minimum stay requirement in Dax is 1 Night, adopted by 25.5% of listings. This highlights the market's preference for shorter, flexible bookings.
Recommendations
- Align with the market by considering a 1 Night minimum stay, as 25.5% of Dax hosts use this setting.
- If feasible, allowing 1-night stays, especially midweek or during low season, could capture last-minute bookings, as only 25.5% currently do.
- Explore offering discounts for stays of 30+ nights to attract the 7.4% of the market seeking extended stays.
- Adjust minimum nights based on seasonality – potentially shorter during low season and longer during peak demand periods in Dax.
Dax Airbnb Cancellation Policy Trends Analysis (2025)
Flexible
63 listings
33.9% of total
Moderate
73 listings
39.2% of total
Firm
26 listings
14% of total
Strict
24 listings
12.9% of total
Cancellation Policy Insights for Dax
- The prevailing Airbnb cancellation policy trend in Dax is Moderate, used by 39.2% of listings.
- The market strongly favors guest-friendly terms, with 73.1% of listings offering Flexible or Moderate policies. This suggests guests in Dax may expect booking flexibility.
Recommendations for Hosts
- Consider adopting a Moderate policy to align with the 39.2% market standard in Dax.
- Using a Strict policy might deter some guests, as only 12.9% of listings use it. Evaluate if potential revenue protection outweighs possible lower booking rates.
- Regularly review your cancellation policy against competitors and market demand shifts in Dax.
Dax STR Booking Lead Time Analysis (2025)
Average Booking Lead Time by Month
Booking Lead Time Insights for Dax
- The overall average booking lead time for vacation rentals in Dax is 68 days.
- Guests book furthest in advance for stays during October (average 104 days), likely coinciding with peak travel demand or local events.
- The shortest booking windows occur for stays in January (average 23 days), indicating more last-minute travel plans during this time.
- Seasonally, Fall (97 days avg.) sees the longest lead times, while Winter (38 days avg.) has the shortest, reflecting typical travel planning cycles.
Recommendations for Hosts
- Use the overall average lead time (68 days) as a baseline for your pricing and availability strategy in Dax.
- For October stays, consider implementing length-of-stay discounts or slightly higher rates for bookings made less than 104 days out to capitalize on advance planning.
- Target marketing efforts for the Fall season well in advance (at least 97 days) to capture early planners.
- Monitor your own booking lead times against these Dax averages to identify opportunities for dynamic pricing adjustments.
Popular & Essential Airbnb Amenities in Dax (2025)
Amenity Prevalence
Amenity Insights for Dax
- Popular amenities like Hot water, Heating, TV are common but not universal. Offering these can provide a competitive edge.
- Warning: Wifi is not universally provided but is considered essential globally. Ensure reliable Wifi is offered.
Recommendations for Hosts
- Consider adding popular differentiators like Hot water or Heating to increase appeal.
- Highlight unique or less common amenities you offer (e.g., hot tub, dedicated workspace, EV charger) in your listing description and photos.
- Regularly check competitor amenities in Dax to stay competitive.
Dax Airbnb Guest Demographics & Profile Analysis (2025)
Guest Profile Summary for Dax
- The typical guest profile for Airbnb in Dax consists of primarily domestic travelers (85%), often arriving from nearby Bordeaux, typically belonging to the Post-2000s (Gen Z/Alpha) group (50%), primarily speaking French or English.
- Domestic travelers account for 84.8% of guests.
- Key international markets include France (84.8%) and Spain (6.3%).
- Top languages spoken are French (43.1%) followed by English (28.3%).
- A significant demographic segment is the Post-2000s (Gen Z/Alpha) group, representing 50% of guests.
Recommendations for Hosts
- Target domestic marketing efforts towards travelers from Bordeaux and Paris.
- Tailor amenities and listing descriptions to appeal to the dominant Post-2000s (Gen Z/Alpha) demographic (e.g., highlight fast WiFi, smart home features, local guides).
- Highlight unique local experiences or amenities relevant to the primary guest profile.
- Consider seasonal promotions aligned with peak travel times for key origin markets.
Nearby Short-Term Rental Market Comparison
How does the Dax Airbnb market stack up against its neighbors? Compare key performance metrics like average monthly revenue, ADR, and occupancy rates in surrounding areas to understand the broader regional STR landscape.
| Market | Active Properties | Monthly Revenue | Daily Rate | Avg. Occupancy |
|---|---|---|---|---|
| San Sebastián | 1,426 | $3,546 | $262.81 | 49% |
| Saint-Laurent-des-Combes | 11 | $3,526 | $706.18 | 23% |
| Gautegiz Arteaga | 21 | $2,865 | $293.66 | 38% |
| Cénac | 18 | $2,773 | $268.58 | 53% |
| Labastida/Bastida | 11 | $2,662 | $268.80 | 34% |
| Cérons | 11 | $2,635 | $196.16 | 39% |
| Barrika | 13 | $2,629 | $314.61 | 41% |
| Galgon | 12 | $2,599 | $210.34 | 48% |
| Esteribar | 20 | $2,574 | $276.81 | 32% |
| Hernani | 11 | $2,572 | $345.16 | 40% |