Charron Airbnb Market Analysis 2025: Short Term Rental Data & Vacation Rental Statistics in Nouvelle-Aquitaine, France
Is Airbnb profitable in Charron in 2025? Explore comprehensive Airbnb analytics for Charron, Nouvelle-Aquitaine, France to uncover income potential. This 2025 STR market report for Charron, based on AirROI data from April 2024 to March 2025, reveals key trends in the niche market of 22 active listings.
Whether you're considering an Airbnb investment in Charron, optimizing your existing vacation rental, or exploring rental arbitrage opportunities, understanding the Charron Airbnb data is crucial. Leveraging the low regulation environment is key to maximizing your short term rental income potential. Let's dive into the specifics.
Key Charron Airbnb Performance Metrics Overview
Monthly Airbnb Revenue Variations & Income Potential in Charron (2025)
Understanding the monthly revenue variations for Airbnb listings in Charron is key to maximizing your short term rental income potential. Seasonality significantly impacts earnings. Our analysis, based on data from the past 12 months, shows that the peak revenue month for STRs in Charron is typically August, while February often presents the lowest earnings, highlighting opportunities for strategic pricing adjustments during shoulder and low seasons. Explore the typical Airbnb income in Charron across different performance tiers:
- Best-in-class properties (Top 10%) achieve $3,434+ monthly, often utilizing dynamic pricing and superior guest experiences.
- Strong performing properties (Top 25%) earn $1,929 or more, indicating effective management and desirable locations/amenities.
- Typical properties (Median) generate around $1,014 per month, representing the average market performance.
- Entry-level properties (Bottom 25%) see earnings around $560, often with potential for optimization.
Average Monthly Airbnb Earnings Trend in Charron
Charron Airbnb Occupancy Rate Trends (2025)
Maximize your bookings by understanding the Charron STR occupancy trends. Seasonal demand shifts significantly influence how often properties are booked. Typically, Augustsees the highest demand (peak season occupancy), while February experiences the lowest (low season). Effective strategies, like adjusting minimum stays or offering promotions, can boost occupancy during slower periods. Here's how different property tiers perform in Charron:
- Best-in-class properties (Top 10%) achieve 87%+ occupancy, indicating high desirability and potentially optimized availability.
- Strong performing properties (Top 25%) maintain 71% or higher occupancy, suggesting good market fit and guest satisfaction.
- Typical properties (Median) have an occupancy rate around 43%.
- Entry-level properties (Bottom 25%) average 23% occupancy, potentially facing higher vacancy.
Average Monthly Occupancy Rate Trend in Charron
Average Daily Rate (ADR) Airbnb Trends in Charron (2025)
Effective short term rental pricing strategy in Charron involves understanding monthly ADR fluctuations. The Average Daily Rate (ADR) for Airbnb in Charron typically peaks in July and dips lowest during December. Leveraging Airbnb dynamic pricing tools or strategies based on this seasonality can significantly boost revenue. Here's a look at the typical nightly rates achieved:
- Best-in-class properties (Top 10%) command rates of $306+ per night, often due to premium features or locations.
- Strong performing properties (Top 25%) achieve nightly rates of $196 or more.
- Typical properties (Median) charge around $95 per night.
- Entry-level properties (Bottom 25%) earn around $58 per night.
Average Daily Rate (ADR) Trend by Month in Charron
Get Live Charron Market Intelligence 👇

Explore Real-time Analytics
Airbnb Seasonality Analysis & Trends in Charron (2025)
Peak Season (August, July, June)
- Revenue averages $2,811 per month
- Occupancy rates average 61.9%
- Daily rates average $158
Shoulder Season
- Revenue averages $1,258 per month
- Occupancy maintains around 47.6%
- Daily rates hold near $147
Low Season (January, February, December)
- Revenue drops to average $644 per month
- Occupancy decreases to average 35.1%
- Daily rates adjust to average $131
Seasonality Insights for Charron
- The Airbnb seasonality in Charron shows highly seasonal trends requiring careful strategy. While the sections above show seasonal averages, it's also insightful to look at the extremes:
- During the high season, the absolute peak month showcases Charron's highest earning potential, with monthly revenues capable of climbing to $3,427, occupancy reaching a high of 74.6%, and ADRs peaking at $159.
- Conversely, the slowest single month of the year, typically falling within the low season, marks the market's lowest point. In this month, revenue might dip to $541, occupancy could drop to 34.4%, and ADRs may adjust down to $131.
- Understanding both the seasonal averages and these monthly peaks and troughs in revenue, occupancy, and ADR is crucial for maximizing your Airbnb profit potential in Charron.
Seasonal Strategies for Maximizing Profit
- Peak Season: Maximize revenue through premium pricing and potentially longer minimum stays. Ensure high availability.
- Low Season: Offer competitive pricing, special promotions (e.g., extended stay discounts), and flexible cancellation policies. Target off-season travelers like remote workers or budget-conscious guests.
- Shoulder Seasons: Implement dynamic pricing that balances peak and low rates. Target weekend travelers or specific events. Offer slightly more flexible terms than peak season.
- Regularly analyze your own performance against these Charron seasonality benchmarks and adjust your pricing and availability strategy accordingly.
Best Areas for Airbnb Investment in Charron (2025)
Exploring the top neighborhoods for short-term rentals in Charron? This section highlights key areas, outlining why they are attractive for hosts and guests, along with notable local attractions. Consider these locations based on your target guest profile and investment strategy.
| Neighborhood / Area | Why Host Here? (Target Guests & Appeal) | Key Attractions & Landmarks |
|---|---|---|
| Charron Center | The heart of Charron with access to local shops and restaurants. A great spot for visitors wanting to experience everyday life in a charming French village. | Church of Saint-Savinien, Local markets, Café en Terrasse, Nearby cycling paths |
| Cognac Region | Close proximity to Cognac, a famous region known for its brandy. Ideal for tourists interested in wine tasting and exploring vineyards. | Cognac distilleries, Cognac Museum, Château de Cognac, Vineyard tours |
| Marais Poitevin | Known as the 'Green Venice', this area offers beautiful canals and nature. Perfect for those looking for outdoor activities and tranquility. | Boat tours, Biking trails, Nature walks, Local wildlife |
| La Rochelle | Only a short drive away, this coastal city offers beautiful beaches and rich history, drawing in visitors from all over. | Old Port, La Rochelle Aquarium, Towers of La Rochelle, Maritime Museum, Beaches |
| Île de Ré | A popular island destination known for its beaches and nature trails, attracting tourists wanting a relaxing getaway along the coast. | Beaches, Cycling paths, Salt marshes, Local seafood restaurants |
| Saintes | A historical city with Roman architecture, perfect for those interested in history and culture. | Saint-Pierre Cathedral, Thermes de Saintes, Arch of Germanicus, St. Eutrope Church |
| Niort | A vibrant town with a rich history and a good base to explore the surrounding areas, ideal for travelers seeking culture and convenience. | Donjon de Niort, Musee Bernard d'Agesci, Place de la Brèche, Local dining options |
| Puy du Fou | A few hours away, this historical theme park offers spectacular shows and attractions, making it a popular destination for families and tourists. | Cinéscénie, Cinéma 4D, Vikings and Knight shows |
Understanding Airbnb License Requirements & STR Laws in Charron (2025)
While Charron, Nouvelle-Aquitaine, France currently shows low STR regulations, specific Airbnb license requirements might still exist or change. Always verify the latest short term rental regulations and Airbnb license requirements directly with local government authorities for Charron to ensure full compliance before hosting.
(Source: AirROI data, 2025, based on 9% licensed listings)
Top Performing Airbnb Properties in Charron (2025)
Benchmark your potential! Explore examples of top-performing Airbnb properties in Charronbased on Trailing Twelve Month (TTM) revenue. Analyze their characteristics, revenue, occupancy rate, and ADR to understand what drives success in this market.
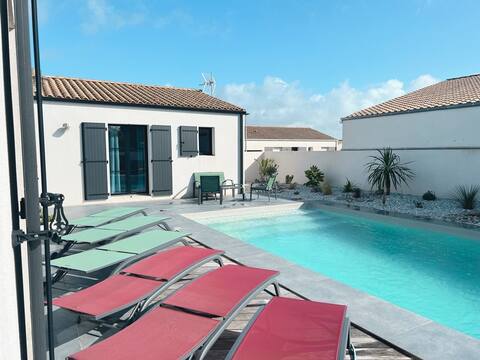
Maison tout confort avec piscine
Entire Place • 3 bedrooms

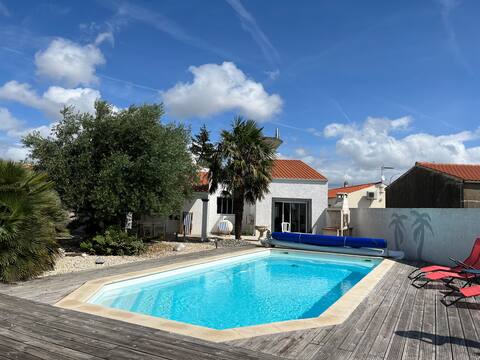
Quiet house, pool, SPA, near La Rochelle
Entire Place • 4 bedrooms
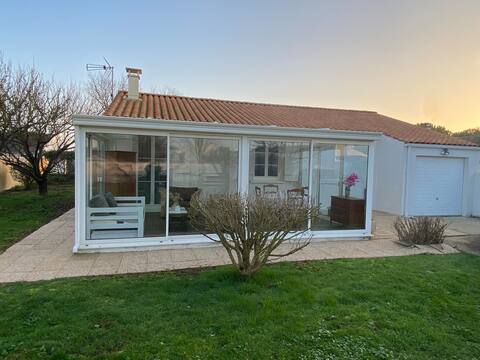
Vacation home with pool
Entire Place • 3 bedrooms
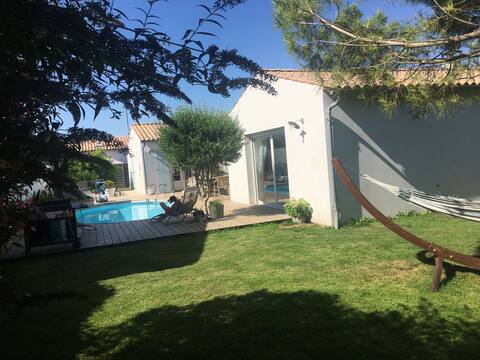
House 20kms from La Rochelle
Entire Place • 2 bedrooms
Warm house with heated pool
Entire Place • 5 bedrooms
Large accommodation (50 m2) all comfortably
Entire Place • 1 bedroom
Note: Performance varies based on location, size, amenities, seasonality, and management quality. Data reflects the past 12 months.
Top Performing Airbnb Hosts in Charron (2025)
Learn from the best! This table showcases top-performing Airbnb hosts in Charron based on the number of properties managed and estimated total revenue over the past year. Analyze their scale and performance metrics.
| Host Name | Properties | Grossing Revenue | Stay Reviews | Avg Rating |
|---|---|---|---|---|
| Host #396737884 | 1 | $42,532 | 10 | 5.00/5.0 |
| Hermann | 2 | $35,368 | 70 | 2.43/5.0 |
| Arnaud | 2 | $30,131 | 102 | 4.93/5.0 |
| Jessica | 1 | $22,423 | 6 | 4.50/5.0 |
| Laetitia | 1 | $20,196 | 16 | 5.00/5.0 |
| Odile | 1 | $20,179 | 23 | 4.83/5.0 |
| Claire | 1 | $18,092 | 7 | 5.00/5.0 |
| Claudine | 1 | $13,571 | 144 | 4.99/5.0 |
| Eric | 2 | $13,380 | 144 | 4.79/5.0 |
| Stéphanie | 1 | $13,088 | 18 | 4.94/5.0 |
Analyzing the strategies of top hosts, such as their property selection, pricing, and guest communication, can offer valuable lessons for optimizing your own Airbnb operations in Charron.
Dive Deeper: Advanced Charron STR Market Data (2025)
Ready to unlock more insights? AirROI provides access to advanced metrics and comprehensive Airbnb data for Charron. Explore detailed analytics beyond this report to refine your investment strategy, optimize pricing, and maximize your vacation rental profits.
Explore Advanced MetricsCharron Short-Term Rental Market Composition (2025): Property & Room Types
Room Type Distribution
Property Type Distribution
Market Composition Insights for Charron
- The Charron Airbnb market composition is heavily skewed towards Entire Home/Apt listings, which make up 81.8% of the 22 active rentals. This indicates strong guest preference for privacy and space.
- Looking at the property type distribution in Charron, House properties are the most common (81.8%), reflecting the local real estate landscape.
- Houses represent a significant 81.8% portion, catering likely to families or larger groups.
- The presence of 9.1% Hotel/Boutique listings indicates integration with traditional hospitality.
- Smaller segments like apartment/condo, others (combined 9.0%) offer potential for unique stay experiences.
Charron Airbnb Room Capacity Analysis (2025): Bedroom Distribution
Distribution of Listings by Number of Bedrooms
Room Capacity Insights for Charron
- The dominant room capacity in Charron is 1 bedroom listings, making up 27.3% of the market. This suggests a strong demand for properties suitable for couples or solo travelers.
- Together, 1 bedroom and 3 bedrooms properties represent 50.0% of the active Airbnb listings in Charron, indicating a high concentration in these sizes.
- A significant 36.3% of listings offer 3+ bedrooms, catering to larger groups and families seeking more space in Charron.
Charron Vacation Rental Guest Capacity Trends (2025)
Distribution of Listings by Guest Capacity
Guest Capacity Insights for Charron
- The most common guest capacity trend in Charron vacation rentals is listings accommodating 4 guests (31.8%). This suggests the primary traveler segment is likely small families or groups.
- Properties designed for 4 guests and 6 guests dominate the Charron STR market, accounting for 50.0% of listings.
- 31.8% of properties accommodate 6+ guests, serving the market segment for larger families or group travel in Charron.
- On average, properties in Charron are equipped to host 4.1 guests.
Charron Airbnb Booking Patterns (2025): Available vs. Booked Days
Available Days Distribution
Booked Days Distribution
Booking Pattern Insights for Charron
- The most common availability pattern in Charron falls within the 181-270 days range, representing 40.9% of listings. This suggests many properties have significant open periods on their calendars.
- Approximately 77.3% of listings show high availability (181+ days open annually), indicating potential for increased bookings or specific owner usage patterns.
- For booked days, the 91-180 days range is most frequent in Charron (40.9%), reflecting common guest stay durations or potential owner blocking patterns.
- A notable 22.7% of properties secure long booking periods (181+ days booked per year), highlighting successful long-term rental strategies or significant owner usage.
Charron Airbnb Minimum Stay Requirements Analysis
Distribution of Listings by Minimum Night Requirement
1 Night
6 listings
27.3% of total
2 Nights
4 listings
18.2% of total
3 Nights
4 listings
18.2% of total
4-6 Nights
2 listings
9.1% of total
7-29 Nights
5 listings
22.7% of total
30+ Nights
1 listings
4.5% of total
Key Insights
- The most prevalent minimum stay requirement in Charron is 1 Night, adopted by 27.3% of listings. This highlights the market's preference for shorter, flexible bookings.
Recommendations
- Align with the market by considering a 1 Night minimum stay, as 27.3% of Charron hosts use this setting.
- If feasible, allowing 1-night stays, especially midweek or during low season, could capture last-minute bookings, as only 27.3% currently do.
- Adjust minimum nights based on seasonality – potentially shorter during low season and longer during peak demand periods in Charron.
Charron Airbnb Cancellation Policy Trends Analysis (2025)
Flexible
5 listings
25% of total
Moderate
4 listings
20% of total
Firm
5 listings
25% of total
Strict
6 listings
30% of total
Cancellation Policy Insights for Charron
- The prevailing Airbnb cancellation policy trend in Charron is Strict, used by 30% of listings.
- A majority (55.0%) of hosts in Charron utilize Firm or Strict policies, indicating a market where hosts prioritize booking security.
Recommendations for Hosts
- Consider adopting a Strict policy to align with the 30% market standard in Charron.
- Regularly review your cancellation policy against competitors and market demand shifts in Charron.
Charron STR Booking Lead Time Analysis (2025)
Average Booking Lead Time by Month
Booking Lead Time Insights for Charron
- The overall average booking lead time for vacation rentals in Charron is 53 days.
- Guests book furthest in advance for stays during August (average 91 days), likely coinciding with peak travel demand or local events.
- The shortest booking windows occur for stays in March (average 14 days), indicating more last-minute travel plans during this time.
- Seasonally, Summer (88 days avg.) sees the longest lead times, while Spring (35 days avg.) has the shortest, reflecting typical travel planning cycles.
Recommendations for Hosts
- Use the overall average lead time (53 days) as a baseline for your pricing and availability strategy in Charron.
- For August stays, consider implementing length-of-stay discounts or slightly higher rates for bookings made less than 91 days out to capitalize on advance planning.
- During March, focus on last-minute booking availability and promotions, as guests book with very short notice (14 days avg.).
- Target marketing efforts for the Summer season well in advance (at least 88 days) to capture early planners.
- Monitor your own booking lead times against these Charron averages to identify opportunities for dynamic pricing adjustments.
Popular & Essential Airbnb Amenities in Charron (2025)
Amenity Prevalence
Amenity Insights for Charron
- Essential amenities in Charron that guests expect include: Heating, Wifi. Lacking these (any) could significantly impact bookings.
- Popular amenities like TV, Hangers, Hot water are common but not universal. Offering these can provide a competitive edge.
Recommendations for Hosts
- Ensure your listing includes all essential amenities for Charron: Heating, Wifi.
- Prioritize adding missing essentials: Wifi.
- Consider adding popular differentiators like TV or Hangers to increase appeal.
- Highlight unique or less common amenities you offer (e.g., hot tub, dedicated workspace, EV charger) in your listing description and photos.
- Regularly check competitor amenities in Charron to stay competitive.
Charron Airbnb Guest Demographics & Profile Analysis (2025)
Guest Profile Summary for Charron
- The typical guest profile for Airbnb in Charron consists of primarily domestic travelers (88%), often arriving from nearby Paris, typically belonging to the Post-2000s (Gen Z/Alpha) group (50%), primarily speaking French or English.
- Domestic travelers account for 88.3% of guests.
- Key international markets include France (88.3%) and Germany (2.6%).
- Top languages spoken are French (47.1%) followed by English (31.6%).
- A significant demographic segment is the Post-2000s (Gen Z/Alpha) group, representing 50% of guests.
Recommendations for Hosts
- Target domestic marketing efforts towards travelers from Paris and Nantes.
- Tailor amenities and listing descriptions to appeal to the dominant Post-2000s (Gen Z/Alpha) demographic (e.g., highlight fast WiFi, smart home features, local guides).
- Highlight unique local experiences or amenities relevant to the primary guest profile.
- Consider seasonal promotions aligned with peak travel times for key origin markets.
Nearby Short-Term Rental Market Comparison
How does the Charron Airbnb market stack up against its neighbors? Compare key performance metrics like average monthly revenue, ADR, and occupancy rates in surrounding areas to understand the broader regional STR landscape.
| Market | Active Properties | Monthly Revenue | Daily Rate | Avg. Occupancy |
|---|---|---|---|---|
| Coteaux-sur-Loire | 19 | $3,328 | $270.00 | 41% |
| Villiers-sur-Loir | 10 | $2,967 | $216.51 | 41% |
| Artannes-sur-Indre | 21 | $2,949 | $275.91 | 41% |
| Vallon-sur-Gée | 11 | $2,913 | $379.01 | 30% |
| Bourneau | 11 | $2,747 | $442.07 | 35% |
| Nuaillé-d'Aunis | 10 | $2,741 | $373.83 | 37% |
| Ambillou | 18 | $2,701 | $370.97 | 28% |
| Le Bois-Plage-en-Ré | 303 | $2,528 | $284.63 | 45% |
| Chambellay | 11 | $2,525 | $255.24 | 34% |
| Le Grand-Pressigny | 11 | $2,511 | $266.72 | 31% |