Chaniers Airbnb Market Analysis 2025: Short Term Rental Data & Vacation Rental Statistics in Nouvelle-Aquitaine, France
Is Airbnb profitable in Chaniers in 2025? Explore comprehensive Airbnb analytics for Chaniers, Nouvelle-Aquitaine, France to uncover income potential. This 2025 STR market report for Chaniers, based on AirROI data from April 2024 to March 2025, reveals key trends in the niche market of 17 active listings.
Whether you're considering an Airbnb investment in Chaniers, optimizing your existing vacation rental, or exploring rental arbitrage opportunities, understanding the Chaniers Airbnb data is crucial. Leveraging the low regulation environment is key to maximizing your short term rental income potential. Let's dive into the specifics.
Key Chaniers Airbnb Performance Metrics Overview
Monthly Airbnb Revenue Variations & Income Potential in Chaniers (2025)
Understanding the monthly revenue variations for Airbnb listings in Chaniers is key to maximizing your short term rental income potential. Seasonality significantly impacts earnings. Our analysis, based on data from the past 12 months, shows that the peak revenue month for STRs in Chaniers is typically August, while February often presents the lowest earnings, highlighting opportunities for strategic pricing adjustments during shoulder and low seasons. Explore the typical Airbnb income in Chaniers across different performance tiers:
- Best-in-class properties (Top 10%) achieve $3,080+ monthly, often utilizing dynamic pricing and superior guest experiences.
- Strong performing properties (Top 25%) earn $1,393 or more, indicating effective management and desirable locations/amenities.
- Typical properties (Median) generate around $750 per month, representing the average market performance.
- Entry-level properties (Bottom 25%) see earnings around $395, often with potential for optimization.
Average Monthly Airbnb Earnings Trend in Chaniers
Chaniers Airbnb Occupancy Rate Trends (2025)
Maximize your bookings by understanding the Chaniers STR occupancy trends. Seasonal demand shifts significantly influence how often properties are booked. Typically, Augustsees the highest demand (peak season occupancy), while February experiences the lowest (low season). Effective strategies, like adjusting minimum stays or offering promotions, can boost occupancy during slower periods. Here's how different property tiers perform in Chaniers:
- Best-in-class properties (Top 10%) achieve 75%+ occupancy, indicating high desirability and potentially optimized availability.
- Strong performing properties (Top 25%) maintain 53% or higher occupancy, suggesting good market fit and guest satisfaction.
- Typical properties (Median) have an occupancy rate around 25%.
- Entry-level properties (Bottom 25%) average 14% occupancy, potentially facing higher vacancy.
Average Monthly Occupancy Rate Trend in Chaniers
Average Daily Rate (ADR) Airbnb Trends in Chaniers (2025)
Effective short term rental pricing strategy in Chaniers involves understanding monthly ADR fluctuations. The Average Daily Rate (ADR) for Airbnb in Chaniers typically peaks in August and dips lowest during March. Leveraging Airbnb dynamic pricing tools or strategies based on this seasonality can significantly boost revenue. Here's a look at the typical nightly rates achieved:
- Best-in-class properties (Top 10%) command rates of $171+ per night, often due to premium features or locations.
- Strong performing properties (Top 25%) achieve nightly rates of $125 or more.
- Typical properties (Median) charge around $80 per night.
- Entry-level properties (Bottom 25%) earn around $39 per night.
Average Daily Rate (ADR) Trend by Month in Chaniers
Get Live Chaniers Market Intelligence 👇

Explore Real-time Analytics
Airbnb Seasonality Analysis & Trends in Chaniers (2025)
Peak Season (August, July, January)
- Revenue averages $2,202 per month
- Occupancy rates average 45.2%
- Daily rates average $157
Shoulder Season
- Revenue averages $1,163 per month
- Occupancy maintains around 36.0%
- Daily rates hold near $153
Low Season (February, March, April)
- Revenue drops to average $723 per month
- Occupancy decreases to average 24.4%
- Daily rates adjust to average $119
Seasonality Insights for Chaniers
- The Airbnb seasonality in Chaniers shows highly seasonal trends requiring careful strategy. While the sections above show seasonal averages, it's also insightful to look at the extremes:
- During the high season, the absolute peak month showcases Chaniers's highest earning potential, with monthly revenues capable of climbing to $3,037, occupancy reaching a high of 50.1%, and ADRs peaking at $194.
- Conversely, the slowest single month of the year, typically falling within the low season, marks the market's lowest point. In this month, revenue might dip to $368, occupancy could drop to 14.3%, and ADRs may adjust down to $89.
- Understanding both the seasonal averages and these monthly peaks and troughs in revenue, occupancy, and ADR is crucial for maximizing your Airbnb profit potential in Chaniers.
Seasonal Strategies for Maximizing Profit
- Peak Season: Maximize revenue through premium pricing and potentially longer minimum stays. Ensure high availability.
- Low Season: Offer competitive pricing, special promotions (e.g., extended stay discounts), and flexible cancellation policies. Target off-season travelers like remote workers or budget-conscious guests.
- Shoulder Seasons: Implement dynamic pricing that balances peak and low rates. Target weekend travelers or specific events. Offer slightly more flexible terms than peak season.
- Regularly analyze your own performance against these Chaniers seasonality benchmarks and adjust your pricing and availability strategy accordingly.
Best Areas for Airbnb Investment in Chaniers (2025)
Exploring the top neighborhoods for short-term rentals in Chaniers? This section highlights key areas, outlining why they are attractive for hosts and guests, along with notable local attractions. Consider these locations based on your target guest profile and investment strategy.
| Neighborhood / Area | Why Host Here? (Target Guests & Appeal) | Key Attractions & Landmarks |
|---|---|---|
| Chaniers Village | Chaniers is a quaint village surrounded by beautiful countryside, making it ideal for travelers looking for a peaceful retreat. Its charming atmosphere attracts tourists interested in experiencing local culture and rural life. | Eglise de Chaniers, Local wineries, Countryside walking trails, Chateau de la Rochefoucauld, Nearby Cognac distilleries |
| Cognac | A historic town famous for its brandy production, Cognac has a rich cultural heritage and attracts many visitors. It's a popular spot for tours of distilleries and is known for its beautiful architecture. | Cognac Distilleries, Hennessy Visitor Center, Chateau de Cognac, Cognac Museum, Historic old town |
| Saintes | Known for its Roman ruins and vibrant cultural scene, Saintes offers history enthusiasts plenty to explore. It's also well connected for travelers wanting to explore the wider Charente-Maritime region. | Saintes Amphitheater, Saint-Pierre Cathedral, Abbaye aux Dames, Historic town center, Banc de la Touche |
| Royan | A coastal town with beautiful beaches, Royan is a popular summer destination for families. Its seaside attractions and festive atmosphere make it a hot spot for vacation rentals. | Royan Beach, La Grande Conche Beach, Phare de Cordouan, Royan Market, Aquatic center |
| La Rochelle | Just a short drive from Chaniers, La Rochelle is a major tourist destination with its picturesque harbor, historic sites, and lively atmosphere. Great for coastal tourism and sightseeing. | Vieux Port (Old Port), Towers of La Rochelle, La Rochelle Aquarium, Les Minimes Beach, Historic city center |
| Île d'Oléron | This island is known for its beautiful beaches and relaxed atmosphere, making it an ideal spot for summer rentals. The island offers a mix of nature and cultural attractions. | Château d’Oléron, Beaches of Fort Boyard, Fishing ports, Cycle paths, Oyster tasting |
| Mervent-Vouvant | A lovely area for nature lovers, Mervent-Vouvant is renowned for its forests and lakes. This is great for outdoor activities and attracts visitors wishing to escape to nature. | Mervent Lake, Vouvant village, Walking and cycling trails, Animal park, Historic architecture |
| Pons | A charming small town with a historic ambiance, Pons is less crowded and offers a unique experience. It's ideal for rural tourism and has a cozy atmosphere. | Pons Castle, Historic town center, Church of Saint-Vivien, Local markets, Countryside views |
Understanding Airbnb License Requirements & STR Laws in Chaniers (2025)
While Chaniers, Nouvelle-Aquitaine, France currently shows low STR regulations, specific Airbnb license requirements might still exist or change. Always verify the latest short term rental regulations and Airbnb license requirements directly with local government authorities for Chaniers to ensure full compliance before hosting.
(Source: AirROI data, 2025, based on 6% licensed listings)
Top Performing Airbnb Properties in Chaniers (2025)
Benchmark your potential! Explore examples of top-performing Airbnb properties in Chaniersbased on Trailing Twelve Month (TTM) revenue. Analyze their characteristics, revenue, occupancy rate, and ADR to understand what drives success in this market.
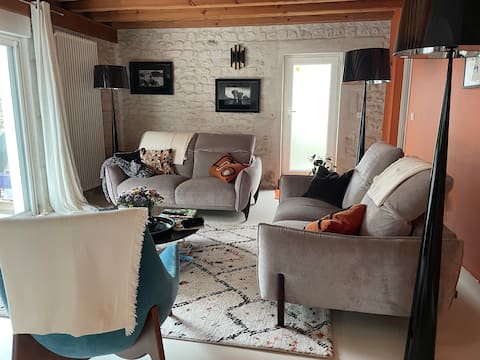
Quiet charming house with pool
Entire Place • 5 bedrooms
Château du Port Hublé
Entire Place • 5 bedrooms
Le Gîte du Port Hublé
Entire Place • 2 bedrooms
Quiet house close to the city
Entire Place • 2 bedrooms
Cocooning en Charente Maritime
Entire Place • 3 bedrooms
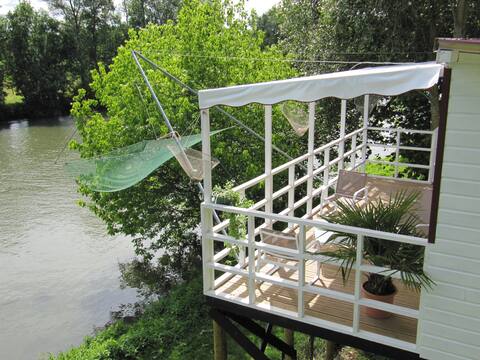
Insolite Carrelet
Entire Place • 2 bedrooms
Note: Performance varies based on location, size, amenities, seasonality, and management quality. Data reflects the past 12 months.
Top Performing Airbnb Hosts in Chaniers (2025)
Learn from the best! This table showcases top-performing Airbnb hosts in Chaniers based on the number of properties managed and estimated total revenue over the past year. Analyze their scale and performance metrics.
| Host Name | Properties | Grossing Revenue | Stay Reviews | Avg Rating |
|---|---|---|---|---|
| Christelle | 1 | $47,324 | 144 | 4.93/5.0 |
| Dom | 1 | $19,006 | 15 | 4.67/5.0 |
| Isabelle | 1 | $16,850 | 52 | 4.85/5.0 |
| Jean Christophe | 4 | $14,106 | 39 | 4.79/5.0 |
| Audrey | 1 | $11,665 | 24 | 4.79/5.0 |
| Peggy | 1 | $10,303 | 9 | 4.89/5.0 |
| Host #37501029 | 1 | $8,884 | 1 | 0.00/5.0 |
| Sandrine | 1 | $8,523 | 33 | 4.76/5.0 |
| Valentin | 1 | $8,418 | 53 | 4.83/5.0 |
| Jessica | 1 | $6,824 | 35 | 4.74/5.0 |
Analyzing the strategies of top hosts, such as their property selection, pricing, and guest communication, can offer valuable lessons for optimizing your own Airbnb operations in Chaniers.
Dive Deeper: Advanced Chaniers STR Market Data (2025)
Ready to unlock more insights? AirROI provides access to advanced metrics and comprehensive Airbnb data for Chaniers. Explore detailed analytics beyond this report to refine your investment strategy, optimize pricing, and maximize your vacation rental profits.
Explore Advanced MetricsChaniers Short-Term Rental Market Composition (2025): Property & Room Types
Room Type Distribution
Property Type Distribution
Market Composition Insights for Chaniers
- The Chaniers Airbnb market composition is heavily skewed towards Entire Home/Apt listings, which make up 82.4% of the 17 active rentals. This indicates strong guest preference for privacy and space.
- Looking at the property type distribution in Chaniers, House properties are the most common (58.8%), reflecting the local real estate landscape.
- Houses represent a significant 58.8% portion, catering likely to families or larger groups.
- The presence of 11.8% Hotel/Boutique listings indicates integration with traditional hospitality.
Chaniers Airbnb Room Capacity Analysis (2025): Bedroom Distribution
Distribution of Listings by Number of Bedrooms
Room Capacity Insights for Chaniers
- The dominant room capacity in Chaniers is 2 bedrooms listings, making up 35.3% of the market. This suggests a strong demand for properties suitable for couples or solo travelers.
- Together, 2 bedrooms and 1 bedroom properties represent 64.7% of the active Airbnb listings in Chaniers, indicating a high concentration in these sizes.
Chaniers Vacation Rental Guest Capacity Trends (2025)
Distribution of Listings by Guest Capacity
Guest Capacity Insights for Chaniers
- The most common guest capacity trend in Chaniers vacation rentals is listings accommodating 4 guests (29.4%). This suggests the primary traveler segment is likely small families or groups.
- Properties designed for 4 guests and 2 guests dominate the Chaniers STR market, accounting for 58.8% of listings.
- 23.6% of properties accommodate 6+ guests, serving the market segment for larger families or group travel in Chaniers.
- On average, properties in Chaniers are equipped to host 3.7 guests.
Chaniers Airbnb Booking Patterns (2025): Available vs. Booked Days
Available Days Distribution
Booked Days Distribution
Booking Pattern Insights for Chaniers
- The most common availability pattern in Chaniers falls within the 271-366 days range, representing 52.9% of listings. This suggests many properties have significant open periods on their calendars.
- Approximately 82.3% of listings show high availability (181+ days open annually), indicating potential for increased bookings or specific owner usage patterns.
- For booked days, the 31-90 days range is most frequent in Chaniers (29.4%), reflecting common guest stay durations or potential owner blocking patterns.
- A notable 23.5% of properties secure long booking periods (181+ days booked per year), highlighting successful long-term rental strategies or significant owner usage.
Chaniers Airbnb Minimum Stay Requirements Analysis
Distribution of Listings by Minimum Night Requirement
1 Night
4 listings
25% of total
2 Nights
7 listings
43.8% of total
3 Nights
2 listings
12.5% of total
7-29 Nights
2 listings
12.5% of total
30+ Nights
1 listings
6.3% of total
Key Insights
- The most prevalent minimum stay requirement in Chaniers is 2 Nights, adopted by 43.8% of listings. This highlights the market's preference for shorter, flexible bookings.
- A strong majority (68.8%) of the Chaniers Airbnb data shows acceptance of very short stays (1-2 nights), indicating a dynamic, high-turnover market.
Recommendations
- Align with the market by considering a 2 Nights minimum stay, as 43.8% of Chaniers hosts use this setting.
- If feasible, allowing 1-night stays, especially midweek or during low season, could capture last-minute bookings, as only 25% currently do.
- Explore offering discounts for stays of 30+ nights to attract the 6.3% of the market seeking extended stays.
- Adjust minimum nights based on seasonality – potentially shorter during low season and longer during peak demand periods in Chaniers.
Chaniers Airbnb Cancellation Policy Trends Analysis (2025)
Flexible
4 listings
23.5% of total
Moderate
11 listings
64.7% of total
Firm
1 listings
5.9% of total
Strict
1 listings
5.9% of total
Cancellation Policy Insights for Chaniers
- The prevailing Airbnb cancellation policy trend in Chaniers is Moderate, used by 64.7% of listings.
- The market strongly favors guest-friendly terms, with 88.2% of listings offering Flexible or Moderate policies. This suggests guests in Chaniers may expect booking flexibility.
- Strict cancellation policies are quite rare (5.9%), potentially making listings with this policy less competitive unless justified by high demand or property type.
Recommendations for Hosts
- Consider adopting a Moderate policy to align with the 64.7% market standard in Chaniers.
- Using a Strict policy might deter some guests, as only 5.9% of listings use it. Evaluate if potential revenue protection outweighs possible lower booking rates.
- Regularly review your cancellation policy against competitors and market demand shifts in Chaniers.
Chaniers STR Booking Lead Time Analysis (2025)
Average Booking Lead Time by Month
Booking Lead Time Insights for Chaniers
- The overall average booking lead time for vacation rentals in Chaniers is 64 days.
- Guests book furthest in advance for stays during January (average 135 days), likely coinciding with peak travel demand or local events.
- The shortest booking windows occur for stays in February (average 10 days), indicating more last-minute travel plans during this time.
- Seasonally, Summer (87 days avg.) sees the longest lead times, while Winter (67 days avg.) has the shortest, reflecting typical travel planning cycles.
Recommendations for Hosts
- Use the overall average lead time (64 days) as a baseline for your pricing and availability strategy in Chaniers.
- For January stays, consider implementing length-of-stay discounts or slightly higher rates for bookings made less than 135 days out to capitalize on advance planning.
- During February, focus on last-minute booking availability and promotions, as guests book with very short notice (10 days avg.).
- Target marketing efforts for the Summer season well in advance (at least 87 days) to capture early planners.
- Monitor your own booking lead times against these Chaniers averages to identify opportunities for dynamic pricing adjustments.
Popular & Essential Airbnb Amenities in Chaniers (2025)
Amenity Prevalence
Amenity Insights for Chaniers
- Popular amenities like Kitchen, Heating, Free parking on premises are common but not universal. Offering these can provide a competitive edge.
- Warning: Wifi is not universally provided but is considered essential globally. Ensure reliable Wifi is offered.
Recommendations for Hosts
- Consider adding popular differentiators like Kitchen or Heating to increase appeal.
- Highlight unique or less common amenities you offer (e.g., hot tub, dedicated workspace, EV charger) in your listing description and photos.
- Regularly check competitor amenities in Chaniers to stay competitive.
Chaniers Airbnb Guest Demographics & Profile Analysis (2025)
Guest Profile Summary for Chaniers
- The typical guest profile for Airbnb in Chaniers consists of primarily domestic travelers (90%), often arriving from nearby Bordeaux, typically belonging to the Post-2000s (Gen Z/Alpha) group (50%), primarily speaking French or English.
- Domestic travelers account for 89.9% of guests.
- Key international markets include France (89.9%) and Belgium (2.5%).
- Top languages spoken are French (48.9%) followed by English (31.9%).
- A significant demographic segment is the Post-2000s (Gen Z/Alpha) group, representing 50% of guests.
Recommendations for Hosts
- Target domestic marketing efforts towards travelers from Bordeaux and Paris.
- Tailor amenities and listing descriptions to appeal to the dominant Post-2000s (Gen Z/Alpha) demographic (e.g., highlight fast WiFi, smart home features, local guides).
- Highlight unique local experiences or amenities relevant to the primary guest profile.
- Consider seasonal promotions aligned with peak travel times for key origin markets.
Nearby Short-Term Rental Market Comparison
How does the Chaniers Airbnb market stack up against its neighbors? Compare key performance metrics like average monthly revenue, ADR, and occupancy rates in surrounding areas to understand the broader regional STR landscape.
| Market | Active Properties | Monthly Revenue | Daily Rate | Avg. Occupancy |
|---|---|---|---|---|
| Saint-Laurent-des-Combes | 11 | $3,526 | $706.18 | 23% |
| Astaffort | 10 | $3,393 | $314.20 | 35% |
| Cénac | 18 | $2,773 | $268.58 | 53% |
| Bourneau | 11 | $2,747 | $442.07 | 35% |
| Nuaillé-d'Aunis | 10 | $2,741 | $373.83 | 37% |
| Cérons | 11 | $2,635 | $196.16 | 39% |
| Galgon | 12 | $2,599 | $210.34 | 48% |
| Eynesse | 14 | $2,564 | $282.87 | 36% |
| Le Bois-Plage-en-Ré | 303 | $2,528 | $284.63 | 45% |
| Le Grand-Pressigny | 11 | $2,511 | $266.72 | 31% |