Chalais Airbnb Market Analysis 2025: Short Term Rental Data & Vacation Rental Statistics in Nouvelle-Aquitaine, France
Is Airbnb profitable in Chalais in 2025? Explore comprehensive Airbnb analytics for Chalais, Nouvelle-Aquitaine, France to uncover income potential. This 2025 STR market report for Chalais, based on AirROI data from April 2024 to March 2025, reveals key trends in the niche market of 30 active listings.
Whether you're considering an Airbnb investment in Chalais, optimizing your existing vacation rental, or exploring rental arbitrage opportunities, understanding the Chalais Airbnb data is crucial. Understanding the local regulations is key to maximizing your short term rental income potential. Let's dive into the specifics.
Key Chalais Airbnb Performance Metrics Overview
Monthly Airbnb Revenue Variations & Income Potential in Chalais (2025)
Understanding the monthly revenue variations for Airbnb listings in Chalais is key to maximizing your short term rental income potential. Seasonality significantly impacts earnings. Our analysis, based on data from the past 12 months, shows that the peak revenue month for STRs in Chalais is typically August, while March often presents the lowest earnings, highlighting opportunities for strategic pricing adjustments during shoulder and low seasons. Explore the typical Airbnb income in Chalais across different performance tiers:
- Best-in-class properties (Top 10%) achieve $2,566+ monthly, often utilizing dynamic pricing and superior guest experiences.
- Strong performing properties (Top 25%) earn $1,279 or more, indicating effective management and desirable locations/amenities.
- Typical properties (Median) generate around $702 per month, representing the average market performance.
- Entry-level properties (Bottom 25%) see earnings around $337, often with potential for optimization.
Average Monthly Airbnb Earnings Trend in Chalais
Chalais Airbnb Occupancy Rate Trends (2025)
Maximize your bookings by understanding the Chalais STR occupancy trends. Seasonal demand shifts significantly influence how often properties are booked. Typically, Augustsees the highest demand (peak season occupancy), while March experiences the lowest (low season). Effective strategies, like adjusting minimum stays or offering promotions, can boost occupancy during slower periods. Here's how different property tiers perform in Chalais:
- Best-in-class properties (Top 10%) achieve 58%+ occupancy, indicating high desirability and potentially optimized availability.
- Strong performing properties (Top 25%) maintain 45% or higher occupancy, suggesting good market fit and guest satisfaction.
- Typical properties (Median) have an occupancy rate around 26%.
- Entry-level properties (Bottom 25%) average 11% occupancy, potentially facing higher vacancy.
Average Monthly Occupancy Rate Trend in Chalais
Average Daily Rate (ADR) Airbnb Trends in Chalais (2025)
Effective short term rental pricing strategy in Chalais involves understanding monthly ADR fluctuations. The Average Daily Rate (ADR) for Airbnb in Chalais typically peaks in July and dips lowest during November. Leveraging Airbnb dynamic pricing tools or strategies based on this seasonality can significantly boost revenue. Here's a look at the typical nightly rates achieved:
- Best-in-class properties (Top 10%) command rates of $301+ per night, often due to premium features or locations.
- Strong performing properties (Top 25%) achieve nightly rates of $202 or more.
- Typical properties (Median) charge around $118 per night.
- Entry-level properties (Bottom 25%) earn around $87 per night.
Average Daily Rate (ADR) Trend by Month in Chalais
Get Live Chalais Market Intelligence 👇

Explore Real-time Analytics
Airbnb Seasonality Analysis & Trends in Chalais (2025)
Peak Season (August, July, June)
- Revenue averages $1,789 per month
- Occupancy rates average 39.6%
- Daily rates average $165
Shoulder Season
- Revenue averages $989 per month
- Occupancy maintains around 28.1%
- Daily rates hold near $147
Low Season (January, March, November)
- Revenue drops to average $572 per month
- Occupancy decreases to average 25.0%
- Daily rates adjust to average $132
Seasonality Insights for Chalais
- The Airbnb seasonality in Chalais shows highly seasonal trends requiring careful strategy. While the sections above show seasonal averages, it's also insightful to look at the extremes:
- During the high season, the absolute peak month showcases Chalais's highest earning potential, with monthly revenues capable of climbing to $2,187, occupancy reaching a high of 51.1%, and ADRs peaking at $167.
- Conversely, the slowest single month of the year, typically falling within the low season, marks the market's lowest point. In this month, revenue might dip to $447, occupancy could drop to 19.4%, and ADRs may adjust down to $128.
- Understanding both the seasonal averages and these monthly peaks and troughs in revenue, occupancy, and ADR is crucial for maximizing your Airbnb profit potential in Chalais.
Seasonal Strategies for Maximizing Profit
- Peak Season: Maximize revenue through premium pricing and potentially longer minimum stays. Ensure high availability.
- Low Season: Offer competitive pricing, special promotions (e.g., extended stay discounts), and flexible cancellation policies. Target off-season travelers like remote workers or budget-conscious guests.
- Shoulder Seasons: Implement dynamic pricing that balances peak and low rates. Target weekend travelers or specific events. Offer slightly more flexible terms than peak season.
- Regularly analyze your own performance against these Chalais seasonality benchmarks and adjust your pricing and availability strategy accordingly.
Best Areas for Airbnb Investment in Chalais (2025)
Exploring the top neighborhoods for short-term rentals in Chalais? This section highlights key areas, outlining why they are attractive for hosts and guests, along with notable local attractions. Consider these locations based on your target guest profile and investment strategy.
| Neighborhood / Area | Why Host Here? (Target Guests & Appeal) | Key Attractions & Landmarks |
|---|---|---|
| Châteauneuf-sur-Charente | Châteauneuf-sur-Charente is a charming village known for its historic architecture and picturesque riverside settings. It's a serene getaway with a local market and beautiful surroundings, perfect for families and couples seeking a tranquil retreat. | La Charente River, Lisle-en-Rigault, Local markets, Eglise Saint-Etienne, Cycling paths |
| Angoulême | The capital of the Charente department is famous for its comic strip history and vibrant cultural scene. It's a hotspot for tourists with its museums, festivals, and a lively town center, making it ideal for year-round hosting. | Museum of Comics, Angoulême Cathedral, Palais de la Source, Festival International de la Bande Dessinée, Historic town center |
| Cognac | Home to the world-renowned Cognac brandy, this town attracts visitors for its distilleries, riverfront views, and cultural heritage. It offers a unique experience for those interested in gastronomy and history, suitable for luxury travelers. | Cognac distilleries, Hennessy Visitor Center, Cognac Museum, Cognac river walks, La Maison de la Cognac |
| Ruffec | Ruffec is a quaint market town surrounded by beautiful parks and nature, perfect for those looking to escape the city's hustle. The local amenities and scenic views appeal to visitors looking for outdoor experiences and relaxation. | Civray Market, Lacs de Haute Charente, Local shops, Historic churches, Nature trails |
| Confolens | Known for its medieval heritage and vibrant arts scene, Confolens is a lovely riverside town that attracts tourists interested in local festivals and cultural events, making it a great Airbnb market for cultural seekers. | Confolens Festival, Historic bridges, Church of Saint Bartholomew, Local artisan shops, River Charente |
| Jarnac | Located on the banks of the Charente River, Jarnac is famous for its cognac production and beautiful scenery. It's a peaceful town that offers scenic walks and local culinary experiences. | Cognac distilleries, River activities, Local vineyards, Museum of Cognac, Château de Jarnac |
| Montmoreau-Saint-Cybard | This small village provides a quaint rural setting with rich history, showcasing charming architecture and a friendly atmosphere, perfect for tourists seeking a peaceful escape in the French countryside. | Church of Saint-Cybard, Village markets, Walking trails, Local vineyards, Historic sites |
| Villebois-Lavalette | A scenic village noted for its historic castle and beautiful landscapes, Villebois-Lavalette is attractive to visitors who enjoy history and relaxed rural living, offering a unique Airbnb experience. | Villebois Castle, Local parks, Cultural festivals, Historic village centre, Scenic hiking paths |
Understanding Airbnb License Requirements & STR Laws in Chalais (2025)
With 13% of listings showing registration in 2025, understanding potential Airbnb license requirements is crucial in Chalais. Always verify the latest short term rental regulations and Airbnb license requirements directly with local government authorities for Chalais to ensure full compliance before hosting.
(Source: AirROI data, 2025, based on 13% licensed listings)
Top Performing Airbnb Properties in Chalais (2025)
Benchmark your potential! Explore examples of top-performing Airbnb properties in Chalaisbased on Trailing Twelve Month (TTM) revenue. Analyze their characteristics, revenue, occupancy rate, and ADR to understand what drives success in this market.

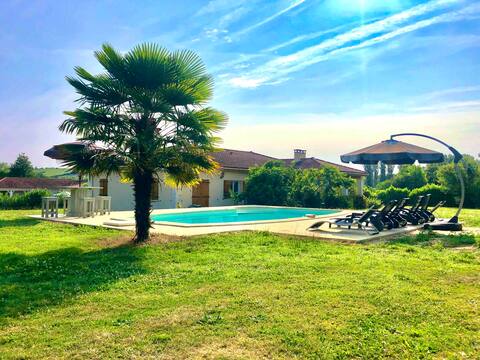
Private pool , 3 bedroom countryside house .
Entire Place • 3 bedrooms
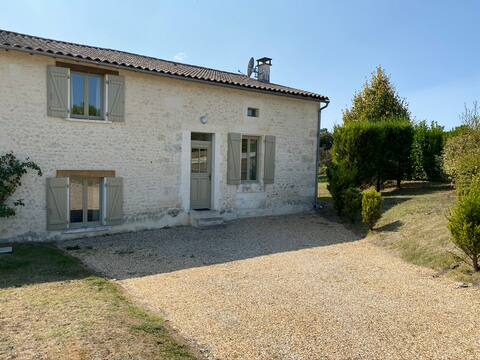
Private house with swimming pool on the border of the Dordogne
Entire Place • 4 bedrooms
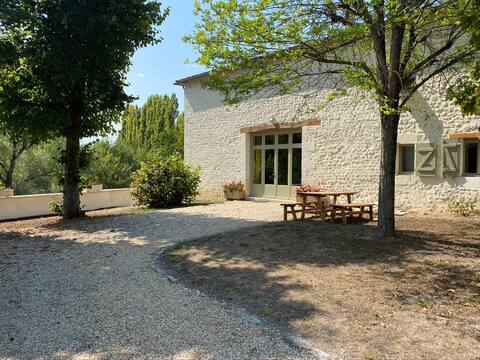
Le Buis - Old barn with private pool
Entire Place • 4 bedrooms

La Belle Des Champs
Entire Place • 2 bedrooms

Chalet du Trèfle
Entire Place • 3 bedrooms
Le Tamaris - Old barn with private pool
Entire Place • 5 bedrooms
Note: Performance varies based on location, size, amenities, seasonality, and management quality. Data reflects the past 12 months.
Top Performing Airbnb Hosts in Chalais (2025)
Learn from the best! This table showcases top-performing Airbnb hosts in Chalais based on the number of properties managed and estimated total revenue over the past year. Analyze their scale and performance metrics.
| Host Name | Properties | Grossing Revenue | Stay Reviews | Avg Rating |
|---|---|---|---|---|
| Host #137225270 | 1 | $41,240 | 2 | 0.00/5.0 |
| Colin | 3 | $37,399 | 18 | 3.25/5.0 |
| Babette | 2 | $22,860 | 28 | 4.88/5.0 |
| Matthijs | 1 | $21,767 | 8 | 5.00/5.0 |
| Michael John | 2 | $17,847 | 25 | 4.74/5.0 |
| Angelique | 1 | $16,994 | 6 | 5.00/5.0 |
| Déborah | 1 | $16,758 | 35 | 4.66/5.0 |
| Marina | 4 | $14,014 | 357 | 4.91/5.0 |
| J-Pierre-Nicole | 1 | $12,225 | 185 | 4.91/5.0 |
| Jenny | 3 | $9,703 | 13 | 4.92/5.0 |
Analyzing the strategies of top hosts, such as their property selection, pricing, and guest communication, can offer valuable lessons for optimizing your own Airbnb operations in Chalais.
Dive Deeper: Advanced Chalais STR Market Data (2025)
Ready to unlock more insights? AirROI provides access to advanced metrics and comprehensive Airbnb data for Chalais. Explore detailed analytics beyond this report to refine your investment strategy, optimize pricing, and maximize your vacation rental profits.
Explore Advanced MetricsChalais Short-Term Rental Market Composition (2025): Property & Room Types
Room Type Distribution
Property Type Distribution
Market Composition Insights for Chalais
- The Chalais Airbnb market composition is heavily skewed towards Entire Home/Apt listings, which make up 70% of the 30 active rentals. This indicates strong guest preference for privacy and space.
- Looking at the property type distribution in Chalais, House properties are the most common (70%), reflecting the local real estate landscape.
- Houses represent a significant 70% portion, catering likely to families or larger groups.
- The presence of 16.7% Hotel/Boutique listings indicates integration with traditional hospitality.
Chalais Airbnb Room Capacity Analysis (2025): Bedroom Distribution
Distribution of Listings by Number of Bedrooms
Room Capacity Insights for Chalais
- The dominant room capacity in Chalais is 2 bedrooms listings, making up 30% of the market. This suggests a strong demand for properties suitable for couples or solo travelers.
- Together, 2 bedrooms and 4 bedrooms properties represent 46.7% of the active Airbnb listings in Chalais, indicating a high concentration in these sizes.
- A significant 40.1% of listings offer 3+ bedrooms, catering to larger groups and families seeking more space in Chalais.
Chalais Vacation Rental Guest Capacity Trends (2025)
Distribution of Listings by Guest Capacity
Guest Capacity Insights for Chalais
- The most common guest capacity trend in Chalais vacation rentals is listings accommodating 8+ guests (23.3%). This suggests the primary traveler segment is likely larger groups.
- Properties designed for 8+ guests and 4 guests dominate the Chalais STR market, accounting for 40.0% of listings.
- 36.6% of properties accommodate 6+ guests, serving the market segment for larger families or group travel in Chalais.
- On average, properties in Chalais are equipped to host 4.0 guests.
Chalais Airbnb Booking Patterns (2025): Available vs. Booked Days
Available Days Distribution
Booked Days Distribution
Booking Pattern Insights for Chalais
- The most common availability pattern in Chalais falls within the 271-366 days range, representing 60% of listings. This suggests many properties have significant open periods on their calendars.
- Approximately 93.3% of listings show high availability (181+ days open annually), indicating potential for increased bookings or specific owner usage patterns.
- For booked days, the 31-90 days range is most frequent in Chalais (33.3%), reflecting common guest stay durations or potential owner blocking patterns.
- A notable 10.0% of properties secure long booking periods (181+ days booked per year), highlighting successful long-term rental strategies or significant owner usage.
Chalais Airbnb Minimum Stay Requirements Analysis
Distribution of Listings by Minimum Night Requirement
1 Night
13 listings
43.3% of total
2 Nights
5 listings
16.7% of total
3 Nights
3 listings
10% of total
4-6 Nights
4 listings
13.3% of total
7-29 Nights
3 listings
10% of total
30+ Nights
2 listings
6.7% of total
Key Insights
- The most prevalent minimum stay requirement in Chalais is 1 Night, adopted by 43.3% of listings. This highlights the market's preference for shorter, flexible bookings.
Recommendations
- Align with the market by considering a 1 Night minimum stay, as 43.3% of Chalais hosts use this setting.
- Explore offering discounts for stays of 30+ nights to attract the 6.7% of the market seeking extended stays.
- Adjust minimum nights based on seasonality – potentially shorter during low season and longer during peak demand periods in Chalais.
Chalais Airbnb Cancellation Policy Trends Analysis (2025)
Refundable
2 listings
7.4% of total
Flexible
8 listings
29.6% of total
Moderate
5 listings
18.5% of total
Firm
6 listings
22.2% of total
Strict
6 listings
22.2% of total
Cancellation Policy Insights for Chalais
- The prevailing Airbnb cancellation policy trend in Chalais is Flexible, used by 29.6% of listings.
- There's a relatively balanced mix between guest-friendly (48.1%) and stricter (44.4%) policies, offering choices for different guest needs.
Recommendations for Hosts
- Consider adopting a Flexible policy to align with the 29.6% market standard in Chalais.
- Regularly review your cancellation policy against competitors and market demand shifts in Chalais.
Chalais STR Booking Lead Time Analysis (2025)
Average Booking Lead Time by Month
Booking Lead Time Insights for Chalais
- The overall average booking lead time for vacation rentals in Chalais is 54 days.
- Guests book furthest in advance for stays during May (average 88 days), likely coinciding with peak travel demand or local events.
- The shortest booking windows occur for stays in March (average 20 days), indicating more last-minute travel plans during this time.
- Seasonally, Summer (67 days avg.) sees the longest lead times, while Spring (51 days avg.) has the shortest, reflecting typical travel planning cycles.
Recommendations for Hosts
- Use the overall average lead time (54 days) as a baseline for your pricing and availability strategy in Chalais.
- For May stays, consider implementing length-of-stay discounts or slightly higher rates for bookings made less than 88 days out to capitalize on advance planning.
- Target marketing efforts for the Summer season well in advance (at least 67 days) to capture early planners.
- Monitor your own booking lead times against these Chalais averages to identify opportunities for dynamic pricing adjustments.
Popular & Essential Airbnb Amenities in Chalais (2025)
Amenity Prevalence
Amenity Insights for Chalais
- Essential amenities in Chalais that guests expect include: Wifi, Heating. Lacking these (any) could significantly impact bookings.
- Popular amenities like Free parking on premises, Essentials, Kitchen are common but not universal. Offering these can provide a competitive edge.
Recommendations for Hosts
- Ensure your listing includes all essential amenities for Chalais: Wifi, Heating.
- Prioritize adding missing essentials: Wifi, Heating.
- Consider adding popular differentiators like Free parking on premises or Essentials to increase appeal.
- Highlight unique or less common amenities you offer (e.g., hot tub, dedicated workspace, EV charger) in your listing description and photos.
- Regularly check competitor amenities in Chalais to stay competitive.
Chalais Airbnb Guest Demographics & Profile Analysis (2025)
Guest Profile Summary for Chalais
- The typical guest profile for Airbnb in Chalais consists of primarily domestic travelers (89%), often arriving from nearby Paris, typically belonging to the Post-2000s (Gen Z/Alpha) group (50%), primarily speaking French or English.
- Domestic travelers account for 88.5% of guests.
- Key international markets include France (88.5%) and United Kingdom (6.3%).
- Top languages spoken are French (41.3%) followed by English (32%).
- A significant demographic segment is the Post-2000s (Gen Z/Alpha) group, representing 50% of guests.
Recommendations for Hosts
- Target domestic marketing efforts towards travelers from Paris and Bordeaux.
- Tailor amenities and listing descriptions to appeal to the dominant Post-2000s (Gen Z/Alpha) demographic (e.g., highlight fast WiFi, smart home features, local guides).
- Highlight unique local experiences or amenities relevant to the primary guest profile.
- Consider seasonal promotions aligned with peak travel times for key origin markets.
Nearby Short-Term Rental Market Comparison
How does the Chalais Airbnb market stack up against its neighbors? Compare key performance metrics like average monthly revenue, ADR, and occupancy rates in surrounding areas to understand the broader regional STR landscape.
| Market | Active Properties | Monthly Revenue | Daily Rate | Avg. Occupancy |
|---|---|---|---|---|
| Saint-Laurent-des-Combes | 11 | $3,526 | $706.18 | 23% |
| Astaffort | 10 | $3,393 | $314.20 | 35% |
| Cénac | 18 | $2,773 | $268.58 | 53% |
| Bourneau | 11 | $2,747 | $442.07 | 35% |
| Nuaillé-d'Aunis | 10 | $2,741 | $373.83 | 37% |
| Cérons | 11 | $2,635 | $196.16 | 39% |
| Galgon | 12 | $2,599 | $210.34 | 48% |
| Eynesse | 14 | $2,564 | $282.87 | 36% |
| Le Grand-Pressigny | 11 | $2,511 | $266.72 | 31% |
| Bourrou | 10 | $2,475 | $247.57 | 36% |