Cestas Airbnb Market Analysis 2025: Short Term Rental Data & Vacation Rental Statistics in Nouvelle-Aquitaine, France
Is Airbnb profitable in Cestas in 2025? Explore comprehensive Airbnb analytics for Cestas, Nouvelle-Aquitaine, France to uncover income potential. This 2025 STR market report for Cestas, based on AirROI data from April 2024 to March 2025, reveals key trends in the niche market of 45 active listings.
Whether you're considering an Airbnb investment in Cestas, optimizing your existing vacation rental, or exploring rental arbitrage opportunities, understanding the Cestas Airbnb data is crucial. Leveraging the low regulation environment is key to maximizing your short term rental income potential. Let's dive into the specifics.
Key Cestas Airbnb Performance Metrics Overview
Monthly Airbnb Revenue Variations & Income Potential in Cestas (2025)
Understanding the monthly revenue variations for Airbnb listings in Cestas is key to maximizing your short term rental income potential. Seasonality significantly impacts earnings. Our analysis, based on data from the past 12 months, shows that the peak revenue month for STRs in Cestas is typically August, while March often presents the lowest earnings, highlighting opportunities for strategic pricing adjustments during shoulder and low seasons. Explore the typical Airbnb income in Cestas across different performance tiers:
- Best-in-class properties (Top 10%) achieve $3,782+ monthly, often utilizing dynamic pricing and superior guest experiences.
- Strong performing properties (Top 25%) earn $2,473 or more, indicating effective management and desirable locations/amenities.
- Typical properties (Median) generate around $1,185 per month, representing the average market performance.
- Entry-level properties (Bottom 25%) see earnings around $697, often with potential for optimization.
Average Monthly Airbnb Earnings Trend in Cestas
Cestas Airbnb Occupancy Rate Trends (2025)
Maximize your bookings by understanding the Cestas STR occupancy trends. Seasonal demand shifts significantly influence how often properties are booked. Typically, Augustsees the highest demand (peak season occupancy), while April experiences the lowest (low season). Effective strategies, like adjusting minimum stays or offering promotions, can boost occupancy during slower periods. Here's how different property tiers perform in Cestas:
- Best-in-class properties (Top 10%) achieve 85%+ occupancy, indicating high desirability and potentially optimized availability.
- Strong performing properties (Top 25%) maintain 66% or higher occupancy, suggesting good market fit and guest satisfaction.
- Typical properties (Median) have an occupancy rate around 43%.
- Entry-level properties (Bottom 25%) average 25% occupancy, potentially facing higher vacancy.
Average Monthly Occupancy Rate Trend in Cestas
Average Daily Rate (ADR) Airbnb Trends in Cestas (2025)
Effective short term rental pricing strategy in Cestas involves understanding monthly ADR fluctuations. The Average Daily Rate (ADR) for Airbnb in Cestas typically peaks in November and dips lowest during April. Leveraging Airbnb dynamic pricing tools or strategies based on this seasonality can significantly boost revenue. Here's a look at the typical nightly rates achieved:
- Best-in-class properties (Top 10%) command rates of $307+ per night, often due to premium features or locations.
- Strong performing properties (Top 25%) achieve nightly rates of $237 or more.
- Typical properties (Median) charge around $89 per night.
- Entry-level properties (Bottom 25%) earn around $56 per night.
Average Daily Rate (ADR) Trend by Month in Cestas
Get Live Cestas Market Intelligence 👇

Explore Real-time Analytics
Airbnb Seasonality Analysis & Trends in Cestas (2025)
Peak Season (August, July, September)
- Revenue averages $3,140 per month
- Occupancy rates average 62.7%
- Daily rates average $151
Shoulder Season
- Revenue averages $1,437 per month
- Occupancy maintains around 42.7%
- Daily rates hold near $148
Low Season (January, March, November)
- Revenue drops to average $899 per month
- Occupancy decreases to average 39.0%
- Daily rates adjust to average $151
Seasonality Insights for Cestas
- The Airbnb seasonality in Cestas shows highly seasonal trends requiring careful strategy. While the sections above show seasonal averages, it's also insightful to look at the extremes:
- During the high season, the absolute peak month showcases Cestas's highest earning potential, with monthly revenues capable of climbing to $3,834, occupancy reaching a high of 71.0%, and ADRs peaking at $153.
- Conversely, the slowest single month of the year, typically falling within the low season, marks the market's lowest point. In this month, revenue might dip to $861, occupancy could drop to 34.0%, and ADRs may adjust down to $146.
- Understanding both the seasonal averages and these monthly peaks and troughs in revenue, occupancy, and ADR is crucial for maximizing your Airbnb profit potential in Cestas.
Seasonal Strategies for Maximizing Profit
- Peak Season: Maximize revenue through premium pricing and potentially longer minimum stays. Ensure high availability.
- Low Season: Offer competitive pricing, special promotions (e.g., extended stay discounts), and flexible cancellation policies. Target off-season travelers like remote workers or budget-conscious guests.
- Shoulder Seasons: Implement dynamic pricing that balances peak and low rates. Target weekend travelers or specific events. Offer slightly more flexible terms than peak season.
- Regularly analyze your own performance against these Cestas seasonality benchmarks and adjust your pricing and availability strategy accordingly.
Best Areas for Airbnb Investment in Cestas (2025)
Exploring the top neighborhoods for short-term rentals in Cestas? This section highlights key areas, outlining why they are attractive for hosts and guests, along with notable local attractions. Consider these locations based on your target guest profile and investment strategy.
| Neighborhood / Area | Why Host Here? (Target Guests & Appeal) | Key Attractions & Landmarks |
|---|---|---|
| Centre-ville de Cestas | L'animation et la convivialité de cette zone en font un lieu idéal pour les visiteurs souhaitant découvrir la culture locale, avec de nombreux restaurants et boutiques. | Église Saint-Jean-Baptiste, Parc de la Mairie, Marché de Cestas, Café de l'Esplanade |
| Cestas Gazinet | Ce quartier est bien desservi par les transports, ce qui le rend attractif pour les voyageurs d'affaires et les familles. | Gare de Gazinet, Parc de l'Église, Commodités locales, Café La Terrasse |
| Cestas La Brède | Proche de la nature et des randonnées, idéal pour ceux cherchant un séjour au calme, tout en étant à proximité de Bordeaux. | Parc Naturel des Landes, Château de la Brède, Vignobles locaux, Activités de plein air |
| Cestas Maubourg | Un quartier résidentiel tranquille, parfait pour les familles ou les personnes cherchant un séjour paisible loin de l'agitation urbaine. | Écoles locales, Parc familial, Commodités de quartier, Restaurants locaux |
| Cestas-Aquitaine | Accès facile aux grands axes routiers et à l'aéroport, ce qui en fait un choix pratique pour les voyageurs. | Aéroports proches, Centres commerciaux, Restauration rapide, Routes touristiques |
| Cestas Pichey | Zone moins fréquentée, idéale pour ceux cherchant à fuir la foule tout en étant à proximité de Bordeaux et des attractions touristiques. | Sentiers de vélo, Cave à vin, Lac local, Espaces verts |
| Cestas Saint-Jean | Un secteur en développement qui attire de nombreux nouveaux résidents et visiteurs, avec un potentiel de croissance dans le domaine locatif. | Nouveaux commerces, Événements communautaires, Parc de jeux pour enfants, Activités culturelles |
| Cestas Mios | Proche de la forêt des Landas et de nombreuses activités en plein air, attirant les amoureux de la nature. | Forêt des Landes, Lac de Cestas, Activités nautiques, Sentiers de randonnée |
Understanding Airbnb License Requirements & STR Laws in Cestas (2025)
While Cestas, Nouvelle-Aquitaine, France currently shows low STR regulations, specific Airbnb license requirements might still exist or change. Always verify the latest short term rental regulations and Airbnb license requirements directly with local government authorities for Cestas to ensure full compliance before hosting.
(Source: AirROI data, 2025, based on 9% licensed listings)
Top Performing Airbnb Properties in Cestas (2025)
Benchmark your potential! Explore examples of top-performing Airbnb properties in Cestasbased on Trailing Twelve Month (TTM) revenue. Analyze their characteristics, revenue, occupancy rate, and ADR to understand what drives success in this market.
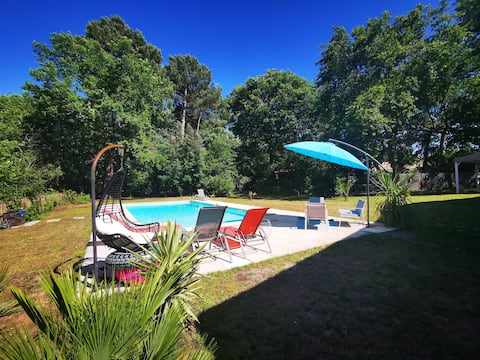
House on the edge of the forest at the gates of Bordeaux
Entire Place • 3 bedrooms
Welcome to our home
Entire Place • 4 bedrooms

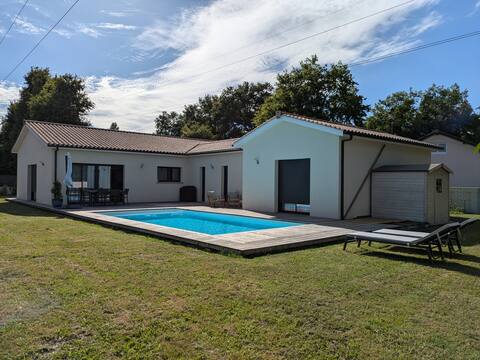
Beautiful villa between Bordeaux and Arcachon
Entire Place • 3 bedrooms

Between Bordeaux and Arcachon
Entire Place • 4 bedrooms

Wellness in Cestas
Entire Place • 4 bedrooms

Ma charmante villa de Cestas
Entire Place • 4 bedrooms
Note: Performance varies based on location, size, amenities, seasonality, and management quality. Data reflects the past 12 months.
Top Performing Airbnb Hosts in Cestas (2025)
Learn from the best! This table showcases top-performing Airbnb hosts in Cestas based on the number of properties managed and estimated total revenue over the past year. Analyze their scale and performance metrics.
| Host Name | Properties | Grossing Revenue | Stay Reviews | Avg Rating |
|---|---|---|---|---|
| Jessica | 1 | $43,963 | 13 | 4.92/5.0 |
| Caroline | 1 | $36,064 | 4 | 5.00/5.0 |
| Christophe | 1 | $28,404 | 7 | 5.00/5.0 |
| Florence | 1 | $26,779 | 5 | 5.00/5.0 |
| Franck | 1 | $26,709 | 18 | 4.83/5.0 |
| Host #586243151 | 1 | $26,378 | 0 | 0.00/5.0 |
| Celine | 1 | $24,726 | 4 | 5.00/5.0 |
| Emy | 1 | $20,352 | 12 | 5.00/5.0 |
| Violaine & Sébastien | 1 | $20,124 | 28 | 4.71/5.0 |
| Virginie | 1 | $20,023 | 495 | 4.72/5.0 |
Analyzing the strategies of top hosts, such as their property selection, pricing, and guest communication, can offer valuable lessons for optimizing your own Airbnb operations in Cestas.
Dive Deeper: Advanced Cestas STR Market Data (2025)
Ready to unlock more insights? AirROI provides access to advanced metrics and comprehensive Airbnb data for Cestas. Explore detailed analytics beyond this report to refine your investment strategy, optimize pricing, and maximize your vacation rental profits.
Explore Advanced MetricsCestas Short-Term Rental Market Composition (2025): Property & Room Types
Room Type Distribution
Property Type Distribution
Market Composition Insights for Cestas
- The Cestas Airbnb market composition is heavily skewed towards Entire Home/Apt listings, which make up 86.7% of the 45 active rentals. This indicates strong guest preference for privacy and space.
- Looking at the property type distribution in Cestas, House properties are the most common (73.3%), reflecting the local real estate landscape.
- Houses represent a significant 73.3% portion, catering likely to families or larger groups.
- The presence of 13.3% Hotel/Boutique listings indicates integration with traditional hospitality.
Cestas Airbnb Room Capacity Analysis (2025): Bedroom Distribution
Distribution of Listings by Number of Bedrooms
Room Capacity Insights for Cestas
- The dominant room capacity in Cestas is 4 bedrooms listings, making up 24.4% of the market. This suggests a strong demand for properties suitable for families or small groups.
- Together, 4 bedrooms and 1 bedroom properties represent 46.6% of the active Airbnb listings in Cestas, indicating a high concentration in these sizes.
- A significant 46.6% of listings offer 3+ bedrooms, catering to larger groups and families seeking more space in Cestas.
Cestas Vacation Rental Guest Capacity Trends (2025)
Distribution of Listings by Guest Capacity
Guest Capacity Insights for Cestas
- The most common guest capacity trend in Cestas vacation rentals is listings accommodating 8+ guests (22.2%). This suggests the primary traveler segment is likely larger groups.
- Properties designed for 8+ guests and 6 guests dominate the Cestas STR market, accounting for 42.2% of listings.
- 44.4% of properties accommodate 6+ guests, serving the market segment for larger families or group travel in Cestas.
- On average, properties in Cestas are equipped to host 4.5 guests.
Cestas Airbnb Booking Patterns (2025): Available vs. Booked Days
Available Days Distribution
Booked Days Distribution
Booking Pattern Insights for Cestas
- The most common availability pattern in Cestas falls within the 271-366 days range, representing 48.9% of listings. This suggests many properties have significant open periods on their calendars.
- Approximately 82.2% of listings show high availability (181+ days open annually), indicating potential for increased bookings or specific owner usage patterns.
- For booked days, the 31-90 days range is most frequent in Cestas (40%), reflecting common guest stay durations or potential owner blocking patterns.
- A notable 20.0% of properties secure long booking periods (181+ days booked per year), highlighting successful long-term rental strategies or significant owner usage.
Cestas Airbnb Minimum Stay Requirements Analysis
Distribution of Listings by Minimum Night Requirement
1 Night
6 listings
13.6% of total
2 Nights
10 listings
22.7% of total
3 Nights
8 listings
18.2% of total
4-6 Nights
3 listings
6.8% of total
7-29 Nights
13 listings
29.5% of total
30+ Nights
4 listings
9.1% of total
Key Insights
- The most prevalent minimum stay requirement in Cestas is 7-29 Nights, adopted by 29.5% of listings. This highlights the market's preference for shorter, flexible bookings.
Recommendations
- Align with the market by considering a 7-29 Nights minimum stay, as 29.5% of Cestas hosts use this setting.
- If feasible, allowing 1-night stays, especially midweek or during low season, could capture last-minute bookings, as only 13.6% currently do.
- Explore offering discounts for stays of 30+ nights to attract the 9.1% of the market seeking extended stays.
- Adjust minimum nights based on seasonality – potentially shorter during low season and longer during peak demand periods in Cestas.
Cestas Airbnb Cancellation Policy Trends Analysis (2025)
Flexible
7 listings
18.9% of total
Moderate
12 listings
32.4% of total
Firm
8 listings
21.6% of total
Strict
10 listings
27% of total
Cancellation Policy Insights for Cestas
- The prevailing Airbnb cancellation policy trend in Cestas is Moderate, used by 32.4% of listings.
- There's a relatively balanced mix between guest-friendly (51.3%) and stricter (48.6%) policies, offering choices for different guest needs.
Recommendations for Hosts
- Consider adopting a Moderate policy to align with the 32.4% market standard in Cestas.
- Regularly review your cancellation policy against competitors and market demand shifts in Cestas.
Cestas STR Booking Lead Time Analysis (2025)
Average Booking Lead Time by Month
Booking Lead Time Insights for Cestas
- The overall average booking lead time for vacation rentals in Cestas is 76 days.
- Guests book furthest in advance for stays during June (average 95 days), likely coinciding with peak travel demand or local events.
- The shortest booking windows occur for stays in January (average 16 days), indicating more last-minute travel plans during this time.
- Seasonally, Summer (81 days avg.) sees the longest lead times, while Winter (25 days avg.) has the shortest, reflecting typical travel planning cycles.
Recommendations for Hosts
- Use the overall average lead time (76 days) as a baseline for your pricing and availability strategy in Cestas.
- For June stays, consider implementing length-of-stay discounts or slightly higher rates for bookings made less than 95 days out to capitalize on advance planning.
- Target marketing efforts for the Summer season well in advance (at least 81 days) to capture early planners.
- Monitor your own booking lead times against these Cestas averages to identify opportunities for dynamic pricing adjustments.
Popular & Essential Airbnb Amenities in Cestas (2025)
Amenity Prevalence
Amenity Insights for Cestas
- Essential amenities in Cestas that guests expect include: Kitchen. Lacking these (this) could significantly impact bookings.
- Popular amenities like Wifi, Heating, Hot water are common but not universal. Offering these can provide a competitive edge.
- Warning: Wifi is not universally provided but is considered essential globally. Ensure reliable Wifi is offered.
Recommendations for Hosts
- Ensure your listing includes all essential amenities for Cestas: Kitchen.
- Prioritize adding missing essentials: Kitchen.
- Consider adding popular differentiators like Wifi or Heating to increase appeal.
- Highlight unique or less common amenities you offer (e.g., hot tub, dedicated workspace, EV charger) in your listing description and photos.
- Regularly check competitor amenities in Cestas to stay competitive.
Cestas Airbnb Guest Demographics & Profile Analysis (2025)
Guest Profile Summary for Cestas
- The typical guest profile for Airbnb in Cestas consists of primarily domestic travelers (82%), often arriving from nearby Paris, typically belonging to the Post-2000s (Gen Z/Alpha) group (50%), primarily speaking French or English.
- Domestic travelers account for 82.2% of guests.
- Key international markets include France (82.2%) and United Kingdom (3.9%).
- Top languages spoken are French (41%) followed by English (28.4%).
- A significant demographic segment is the Post-2000s (Gen Z/Alpha) group, representing 50% of guests.
Recommendations for Hosts
- Target domestic marketing efforts towards travelers from Paris and Cestas.
- Tailor amenities and listing descriptions to appeal to the dominant Post-2000s (Gen Z/Alpha) demographic (e.g., highlight fast WiFi, smart home features, local guides).
- Highlight unique local experiences or amenities relevant to the primary guest profile.
- Consider seasonal promotions aligned with peak travel times for key origin markets.
Nearby Short-Term Rental Market Comparison
How does the Cestas Airbnb market stack up against its neighbors? Compare key performance metrics like average monthly revenue, ADR, and occupancy rates in surrounding areas to understand the broader regional STR landscape.
| Market | Active Properties | Monthly Revenue | Daily Rate | Avg. Occupancy |
|---|---|---|---|---|
| San Sebastián | 1,426 | $3,546 | $262.81 | 49% |
| Saint-Laurent-des-Combes | 11 | $3,526 | $706.18 | 23% |
| Astaffort | 10 | $3,393 | $314.20 | 35% |
| Cénac | 18 | $2,773 | $268.58 | 53% |
| Cérons | 11 | $2,635 | $196.16 | 39% |
| Galgon | 12 | $2,599 | $210.34 | 48% |
| Hernani | 11 | $2,572 | $345.16 | 40% |
| Eynesse | 14 | $2,564 | $282.87 | 36% |
| Bourrou | 10 | $2,475 | $247.57 | 36% |
| Saint-Hippolyte | 10 | $2,443 | $204.98 | 44% |