Capbreton Airbnb Market Analysis 2025: Short Term Rental Data & Vacation Rental Statistics in Nouvelle-Aquitaine, France
Is Airbnb profitable in Capbreton in 2025? Explore comprehensive Airbnb analytics for Capbreton, Nouvelle-Aquitaine, France to uncover income potential. This 2025 STR market report for Capbreton, based on AirROI data from April 2024 to March 2025, reveals key trends in the bustling market of 1,112 active listings.
Whether you're considering an Airbnb investment in Capbreton, optimizing your existing vacation rental, or exploring rental arbitrage opportunities, understanding the Capbreton Airbnb data is crucial. Navigating the high regulation landscape is key to maximizing your short term rental income potential. Let's dive into the specifics.
Key Capbreton Airbnb Performance Metrics Overview
Monthly Airbnb Revenue Variations & Income Potential in Capbreton (2025)
Understanding the monthly revenue variations for Airbnb listings in Capbreton is key to maximizing your short term rental income potential. Seasonality significantly impacts earnings. Our analysis, based on data from the past 12 months, shows that the peak revenue month for STRs in Capbreton is typically August, while February often presents the lowest earnings, highlighting opportunities for strategic pricing adjustments during shoulder and low seasons. Explore the typical Airbnb income in Capbreton across different performance tiers:
- Best-in-class properties (Top 10%) achieve $3,908+ monthly, often utilizing dynamic pricing and superior guest experiences.
- Strong performing properties (Top 25%) earn $2,401 or more, indicating effective management and desirable locations/amenities.
- Typical properties (Median) generate around $1,370 per month, representing the average market performance.
- Entry-level properties (Bottom 25%) see earnings around $721, often with potential for optimization.
Average Monthly Airbnb Earnings Trend in Capbreton
Capbreton Airbnb Occupancy Rate Trends (2025)
Maximize your bookings by understanding the Capbreton STR occupancy trends. Seasonal demand shifts significantly influence how often properties are booked. Typically, Augustsees the highest demand (peak season occupancy), while January experiences the lowest (low season). Effective strategies, like adjusting minimum stays or offering promotions, can boost occupancy during slower periods. Here's how different property tiers perform in Capbreton:
- Best-in-class properties (Top 10%) achieve 76%+ occupancy, indicating high desirability and potentially optimized availability.
- Strong performing properties (Top 25%) maintain 56% or higher occupancy, suggesting good market fit and guest satisfaction.
- Typical properties (Median) have an occupancy rate around 34%.
- Entry-level properties (Bottom 25%) average 17% occupancy, potentially facing higher vacancy.
Average Monthly Occupancy Rate Trend in Capbreton
Average Daily Rate (ADR) Airbnb Trends in Capbreton (2025)
Effective short term rental pricing strategy in Capbreton involves understanding monthly ADR fluctuations. The Average Daily Rate (ADR) for Airbnb in Capbreton typically peaks in August and dips lowest during March. Leveraging Airbnb dynamic pricing tools or strategies based on this seasonality can significantly boost revenue. Here's a look at the typical nightly rates achieved:
- Best-in-class properties (Top 10%) command rates of $321+ per night, often due to premium features or locations.
- Strong performing properties (Top 25%) achieve nightly rates of $190 or more.
- Typical properties (Median) charge around $122 per night.
- Entry-level properties (Bottom 25%) earn around $91 per night.
Average Daily Rate (ADR) Trend by Month in Capbreton
Get Live Capbreton Market Intelligence 👇

Explore Real-time Analytics
Airbnb Seasonality Analysis & Trends in Capbreton (2025)
Peak Season (August, July, September)
- Revenue averages $3,258 per month
- Occupancy rates average 58.5%
- Daily rates average $182
Shoulder Season
- Revenue averages $1,665 per month
- Occupancy maintains around 33.8%
- Daily rates hold near $165
Low Season (January, February, March)
- Revenue drops to average $942 per month
- Occupancy decreases to average 26.6%
- Daily rates adjust to average $152
Seasonality Insights for Capbreton
- The Airbnb seasonality in Capbreton shows highly seasonal trends requiring careful strategy. While the sections above show seasonal averages, it's also insightful to look at the extremes:
- During the high season, the absolute peak month showcases Capbreton's highest earning potential, with monthly revenues capable of climbing to $4,149, occupancy reaching a high of 70.7%, and ADRs peaking at $187.
- Conversely, the slowest single month of the year, typically falling within the low season, marks the market's lowest point. In this month, revenue might dip to $897, occupancy could drop to 23.2%, and ADRs may adjust down to $150.
- Understanding both the seasonal averages and these monthly peaks and troughs in revenue, occupancy, and ADR is crucial for maximizing your Airbnb profit potential in Capbreton.
Seasonal Strategies for Maximizing Profit
- Peak Season: Maximize revenue through premium pricing and potentially longer minimum stays. Ensure high availability.
- Low Season: Offer competitive pricing, special promotions (e.g., extended stay discounts), and flexible cancellation policies. Target off-season travelers like remote workers or budget-conscious guests.
- Shoulder Seasons: Implement dynamic pricing that balances peak and low rates. Target weekend travelers or specific events. Offer slightly more flexible terms than peak season.
- Regularly analyze your own performance against these Capbreton seasonality benchmarks and adjust your pricing and availability strategy accordingly.
Best Areas for Airbnb Investment in Capbreton (2025)
Exploring the top neighborhoods for short-term rentals in Capbreton? This section highlights key areas, outlining why they are attractive for hosts and guests, along with notable local attractions. Consider these locations based on your target guest profile and investment strategy.
| Neighborhood / Area | Why Host Here? (Target Guests & Appeal) | Key Attractions & Landmarks |
|---|---|---|
| Plage de Capbreton | Beautiful sandy beach that attracts sunbathers and surfers alike. A popular location for tourists looking for beach activities, dining, and relaxation. | Capbreton Beach, Surf schools, Beachfront restaurants, Lighthouse of Capbreton, Capbreton Marina |
| Les Landes Forest | A stunning natural area offering outdoor activities such as hiking and cycling. This location is perfect for eco-tourists and nature lovers. | The Landes Forest, Cycling paths, Hiking trails, Wildlife watching, Picnic areas |
| Capbreton Marina | A lively area with a variety of restaurants, shops, and boating activities. Great for visitors looking for a vibrant atmosphere and water sports. | Capbreton Marina, Restaurants by the water, Sailing tours, Fishing excursions, Shopping boutiques |
| Market Square | The heart of Capbreton with a local market and shops, providing a taste of local life. Attractive for those who want to experience the local culture. | Local market, Cafés, Shops, Cultural events, Artisan stalls |
| Les Estagnots | A quieter beach area, perfect for families and those looking for a more relaxed atmosphere away from the main tourist spots. | Les Estagnots Beach, Family-friendly activities, Beachside cafés, Relaxing spots, Nature walks |
| The Coastal Path | A scenic route ideal for walking and cycling along the coastline, drawing those who appreciate stunning views and outdoor activities. | Scenic coastal views, Walking and biking paths, Access to hidden beaches, Picnic spots, Wildflower viewing |
| Capbreton Old Town | Charming streets with traditional architecture, filled with history and culture. Intriguing for visitors who enjoy exploring local heritage. | Historic buildings, Local galleries, Traditional restaurants, Art shops, Cultural heritage sites |
| Boudigau River | A tranquil area by the river, ideal for kayaking and paddleboarding. Attracts those looking for water sports and peaceful nature settings. | Kayaking, Paddleboarding, Picnic areas, Fishing spots, Nature parks |
Understanding Airbnb License Requirements & STR Laws in Capbreton (2025)
Yes, Capbreton, Nouvelle-Aquitaine, France enforces high STR regulations. Obtaining a license and ensuring compliance is almost certainly required according to current 2025 STR laws. Always verify the latest short term rental regulations and Airbnb license requirements directly with local government authorities for Capbreton to ensure full compliance before hosting.
(Source: AirROI data, 2025, based on 75% licensed listings)
Top Performing Airbnb Properties in Capbreton (2025)
Benchmark your potential! Explore examples of top-performing Airbnb properties in Capbretonbased on Trailing Twelve Month (TTM) revenue. Analyze their characteristics, revenue, occupancy rate, and ADR to understand what drives success in this market.

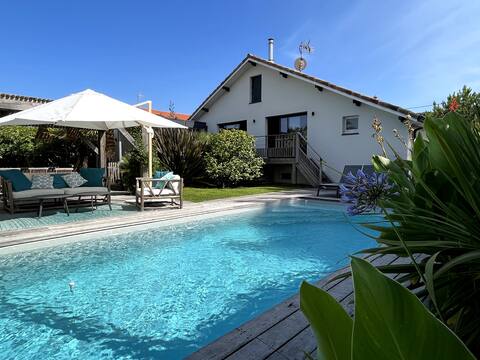
Contemporary Villa -Heated Pool. Beach on foot
Entire Place • 4 bedrooms
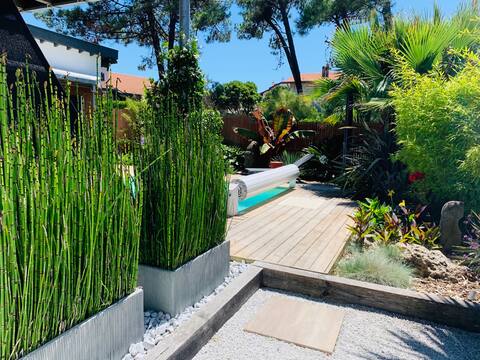
Exotic house, 12 pers., close to the beach, swimming pool
Entire Place • 5 bedrooms
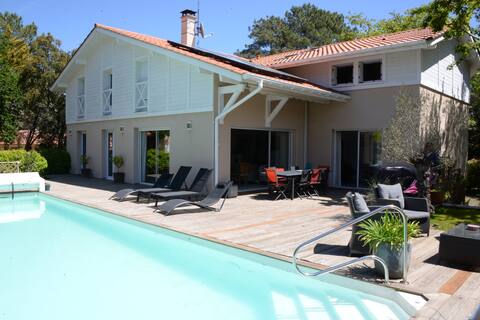
Splendid villa 5*,200m from the beach-Pool, bike
Entire Place • 5 bedrooms
House 230 m2, sleeps 15
Entire Place • 6 bedrooms
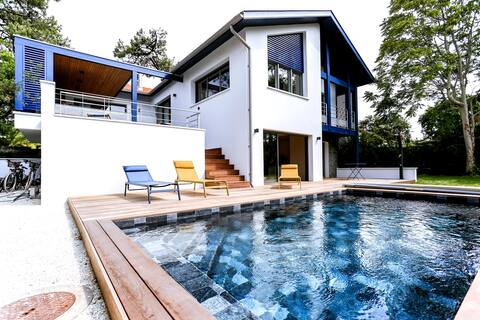
Beautiful villa, heated pool, ocean 500 m away!
Entire Place • 5 bedrooms
The Ocean - Welkeys apartment
Entire Place • 3 bedrooms
Note: Performance varies based on location, size, amenities, seasonality, and management quality. Data reflects the past 12 months.
Top Performing Airbnb Hosts in Capbreton (2025)
Learn from the best! This table showcases top-performing Airbnb hosts in Capbreton based on the number of properties managed and estimated total revenue over the past year. Analyze their scale and performance metrics.
| Host Name | Properties | Grossing Revenue | Stay Reviews | Avg Rating |
|---|---|---|---|---|
| Morgane | 17 | $506,451 | 272 | 4.32/5.0 |
| Mathieu | 11 | $424,968 | 320 | 4.80/5.0 |
| Rive Gauche | 41 | $338,973 | 108 | 1.84/5.0 |
| Eulalie - Interhome Group | 41 | $286,208 | 125 | 2.37/5.0 |
| Audrey | 3 | $187,631 | 19 | 3.21/5.0 |
| Déborah | 27 | $186,338 | 148 | 2.21/5.0 |
| Philippe | 2 | $143,883 | 311 | 4.97/5.0 |
| Aude | 10 | $136,523 | 316 | 4.77/5.0 |
| Welkeys | 3 | $119,664 | 53 | 4.62/5.0 |
| Teddy | 4 | $113,072 | 518 | 4.84/5.0 |
Analyzing the strategies of top hosts, such as their property selection, pricing, and guest communication, can offer valuable lessons for optimizing your own Airbnb operations in Capbreton.
Dive Deeper: Advanced Capbreton STR Market Data (2025)
Ready to unlock more insights? AirROI provides access to advanced metrics and comprehensive Airbnb data for Capbreton. Explore detailed analytics beyond this report to refine your investment strategy, optimize pricing, and maximize your vacation rental profits.
Explore Advanced MetricsCapbreton Short-Term Rental Market Composition (2025): Property & Room Types
Room Type Distribution
Property Type Distribution
Market Composition Insights for Capbreton
- The Capbreton Airbnb market composition is heavily skewed towards Entire Home/Apt listings, which make up 97.1% of the 1,112 active rentals. This indicates strong guest preference for privacy and space.
- Looking at the property type distribution in Capbreton, Apartment/Condo properties are the most common (57.1%), reflecting the local real estate landscape.
- Houses represent a significant 39.7% portion, catering likely to families or larger groups.
- Smaller segments like hotel/boutique, outdoor/unique, others, unique stays (combined 3.1%) offer potential for unique stay experiences.
Capbreton Airbnb Room Capacity Analysis (2025): Bedroom Distribution
Distribution of Listings by Number of Bedrooms
Room Capacity Insights for Capbreton
- The dominant room capacity in Capbreton is 1 bedroom listings, making up 35.2% of the market. This suggests a strong demand for properties suitable for couples or solo travelers.
- Together, 1 bedroom and 2 bedrooms properties represent 63.8% of the active Airbnb listings in Capbreton, indicating a high concentration in these sizes.
- A significant 26.7% of listings offer 3+ bedrooms, catering to larger groups and families seeking more space in Capbreton.
Capbreton Vacation Rental Guest Capacity Trends (2025)
Distribution of Listings by Guest Capacity
Guest Capacity Insights for Capbreton
- The most common guest capacity trend in Capbreton vacation rentals is listings accommodating 4 guests (40%). This suggests the primary traveler segment is likely small families or groups.
- Properties designed for 4 guests and 6 guests dominate the Capbreton STR market, accounting for 57.4% of listings.
- 32.4% of properties accommodate 6+ guests, serving the market segment for larger families or group travel in Capbreton.
- On average, properties in Capbreton are equipped to host 4.6 guests.
Capbreton Airbnb Booking Patterns (2025): Available vs. Booked Days
Available Days Distribution
Booked Days Distribution
Booking Pattern Insights for Capbreton
- The most common availability pattern in Capbreton falls within the 271-366 days range, representing 56.6% of listings. This suggests many properties have significant open periods on their calendars.
- Approximately 88.1% of listings show high availability (181+ days open annually), indicating potential for increased bookings or specific owner usage patterns.
- For booked days, the 31-90 days range is most frequent in Capbreton (38.9%), reflecting common guest stay durations or potential owner blocking patterns.
- A notable 13.3% of properties secure long booking periods (181+ days booked per year), highlighting successful long-term rental strategies or significant owner usage.
Capbreton Airbnb Minimum Stay Requirements Analysis
Distribution of Listings by Minimum Night Requirement
1 Night
146 listings
14.4% of total
2 Nights
263 listings
25.9% of total
3 Nights
157 listings
15.4% of total
4-6 Nights
208 listings
20.5% of total
7-29 Nights
133 listings
13.1% of total
30+ Nights
110 listings
10.8% of total
Key Insights
- The most prevalent minimum stay requirement in Capbreton is 2 Nights, adopted by 25.9% of listings. This highlights the market's preference for shorter, flexible bookings.
- A significant segment (10.8%) caters to monthly stays (30+ nights) in Capbreton, pointing to opportunities in the extended-stay market.
Recommendations
- Align with the market by considering a 2 Nights minimum stay, as 25.9% of Capbreton hosts use this setting.
- If feasible, allowing 1-night stays, especially midweek or during low season, could capture last-minute bookings, as only 14.4% currently do.
- Explore offering discounts for stays of 30+ nights to attract the 10.8% of the market seeking extended stays.
- Adjust minimum nights based on seasonality – potentially shorter during low season and longer during peak demand periods in Capbreton.
Capbreton Airbnb Cancellation Policy Trends Analysis (2025)
Super Strict 30 Days
3 listings
0.3% of total
Flexible
112 listings
12.5% of total
Moderate
203 listings
22.6% of total
Firm
251 listings
28% of total
Strict
329 listings
36.6% of total
Cancellation Policy Insights for Capbreton
- The prevailing Airbnb cancellation policy trend in Capbreton is Strict, used by 36.6% of listings.
- A majority (64.6%) of hosts in Capbreton utilize Firm or Strict policies, indicating a market where hosts prioritize booking security.
Recommendations for Hosts
- Consider adopting a Strict policy to align with the 36.6% market standard in Capbreton.
- With 36.6% using Strict terms, this is a viable option in Capbreton, particularly for high-value properties or during peak demand periods.
- Regularly review your cancellation policy against competitors and market demand shifts in Capbreton.
Capbreton STR Booking Lead Time Analysis (2025)
Average Booking Lead Time by Month
Booking Lead Time Insights for Capbreton
- The overall average booking lead time for vacation rentals in Capbreton is 60 days.
- Guests book furthest in advance for stays during July (average 101 days), likely coinciding with peak travel demand or local events.
- The shortest booking windows occur for stays in March (average 24 days), indicating more last-minute travel plans during this time.
- Seasonally, Summer (92 days avg.) sees the longest lead times, while Winter (36 days avg.) has the shortest, reflecting typical travel planning cycles.
Recommendations for Hosts
- Use the overall average lead time (60 days) as a baseline for your pricing and availability strategy in Capbreton.
- For July stays, consider implementing length-of-stay discounts or slightly higher rates for bookings made less than 101 days out to capitalize on advance planning.
- Target marketing efforts for the Summer season well in advance (at least 92 days) to capture early planners.
- Monitor your own booking lead times against these Capbreton averages to identify opportunities for dynamic pricing adjustments.
Popular & Essential Airbnb Amenities in Capbreton (2025)
Amenity Prevalence
Amenity Insights for Capbreton
- Essential amenities in Capbreton that guests expect include: Kitchen. Lacking these (this) could significantly impact bookings.
- Popular amenities like Heating, Hot water, TV are common but not universal. Offering these can provide a competitive edge.
Recommendations for Hosts
- Ensure your listing includes all essential amenities for Capbreton: Kitchen.
- Prioritize adding missing essentials: Kitchen.
- Consider adding popular differentiators like Heating or Hot water to increase appeal.
- Highlight unique or less common amenities you offer (e.g., hot tub, dedicated workspace, EV charger) in your listing description and photos.
- Regularly check competitor amenities in Capbreton to stay competitive.
Capbreton Airbnb Guest Demographics & Profile Analysis (2025)
Guest Profile Summary for Capbreton
- The typical guest profile for Airbnb in Capbreton consists of primarily domestic travelers (78%), often arriving from nearby Toulouse, typically belonging to the Post-2000s (Gen Z/Alpha) group (50%), primarily speaking French or English.
- Domestic travelers account for 77.9% of guests.
- Key international markets include France (77.9%) and Spain (5.1%).
- Top languages spoken are French (38.7%) followed by English (33.6%).
- A significant demographic segment is the Post-2000s (Gen Z/Alpha) group, representing 50% of guests.
Recommendations for Hosts
- Target domestic marketing efforts towards travelers from Toulouse and Paris.
- Tailor amenities and listing descriptions to appeal to the dominant Post-2000s (Gen Z/Alpha) demographic (e.g., highlight fast WiFi, smart home features, local guides).
- Highlight unique local experiences or amenities relevant to the primary guest profile.
- Consider seasonal promotions aligned with peak travel times for key origin markets.
Nearby Short-Term Rental Market Comparison
How does the Capbreton Airbnb market stack up against its neighbors? Compare key performance metrics like average monthly revenue, ADR, and occupancy rates in surrounding areas to understand the broader regional STR landscape.
| Market | Active Properties | Monthly Revenue | Daily Rate | Avg. Occupancy |
|---|---|---|---|---|
| San Sebastián | 1,426 | $3,546 | $262.81 | 49% |
| Saint-Laurent-des-Combes | 11 | $3,526 | $706.18 | 23% |
| Gautegiz Arteaga | 21 | $2,865 | $293.66 | 38% |
| Cénac | 18 | $2,773 | $268.58 | 53% |
| Labastida/Bastida | 11 | $2,662 | $268.80 | 34% |
| Cérons | 11 | $2,635 | $196.16 | 39% |
| Barrika | 13 | $2,629 | $314.61 | 41% |
| Galgon | 12 | $2,599 | $210.34 | 48% |
| Esteribar | 20 | $2,574 | $276.81 | 32% |
| Hernani | 11 | $2,572 | $345.16 | 40% |