Campagne Airbnb Market Analysis 2025: Short Term Rental Data & Vacation Rental Statistics in Nouvelle-Aquitaine, France
Is Airbnb profitable in Campagne in 2025? Explore comprehensive Airbnb analytics for Campagne, Nouvelle-Aquitaine, France to uncover income potential. This 2025 STR market report for Campagne, based on AirROI data from April 2024 to March 2025, reveals key trends in the niche market of 21 active listings.
Whether you're considering an Airbnb investment in Campagne, optimizing your existing vacation rental, or exploring rental arbitrage opportunities, understanding the Campagne Airbnb data is crucial. Understanding the local regulations is key to maximizing your short term rental income potential. Let's dive into the specifics.
Key Campagne Airbnb Performance Metrics Overview
Monthly Airbnb Revenue Variations & Income Potential in Campagne (2025)
Understanding the monthly revenue variations for Airbnb listings in Campagne is key to maximizing your short term rental income potential. Seasonality significantly impacts earnings. Our analysis, based on data from the past 12 months, shows that the peak revenue month for STRs in Campagne is typically August, while March often presents the lowest earnings, highlighting opportunities for strategic pricing adjustments during shoulder and low seasons. Explore the typical Airbnb income in Campagne across different performance tiers:
- Best-in-class properties (Top 10%) achieve $2,857+ monthly, often utilizing dynamic pricing and superior guest experiences.
- Strong performing properties (Top 25%) earn $1,889 or more, indicating effective management and desirable locations/amenities.
- Typical properties (Median) generate around $1,005 per month, representing the average market performance.
- Entry-level properties (Bottom 25%) see earnings around $728, often with potential for optimization.
Average Monthly Airbnb Earnings Trend in Campagne
Campagne Airbnb Occupancy Rate Trends (2025)
Maximize your bookings by understanding the Campagne STR occupancy trends. Seasonal demand shifts significantly influence how often properties are booked. Typically, Novembersees the highest demand (peak season occupancy), while December experiences the lowest (low season). Effective strategies, like adjusting minimum stays or offering promotions, can boost occupancy during slower periods. Here's how different property tiers perform in Campagne:
- Best-in-class properties (Top 10%) achieve 74%+ occupancy, indicating high desirability and potentially optimized availability.
- Strong performing properties (Top 25%) maintain 56% or higher occupancy, suggesting good market fit and guest satisfaction.
- Typical properties (Median) have an occupancy rate around 33%.
- Entry-level properties (Bottom 25%) average 23% occupancy, potentially facing higher vacancy.
Average Monthly Occupancy Rate Trend in Campagne
Average Daily Rate (ADR) Airbnb Trends in Campagne (2025)
Effective short term rental pricing strategy in Campagne involves understanding monthly ADR fluctuations. The Average Daily Rate (ADR) for Airbnb in Campagne typically peaks in July and dips lowest during March. Leveraging Airbnb dynamic pricing tools or strategies based on this seasonality can significantly boost revenue. Here's a look at the typical nightly rates achieved:
- Best-in-class properties (Top 10%) command rates of $236+ per night, often due to premium features or locations.
- Strong performing properties (Top 25%) achieve nightly rates of $161 or more.
- Typical properties (Median) charge around $111 per night.
- Entry-level properties (Bottom 25%) earn around $83 per night.
Average Daily Rate (ADR) Trend by Month in Campagne
Get Live Campagne Market Intelligence 👇

Explore Real-time Analytics
Airbnb Seasonality Analysis & Trends in Campagne (2025)
Peak Season (August, July, November)
- Revenue averages $2,454 per month
- Occupancy rates average 66.5%
- Daily rates average $139
Shoulder Season
- Revenue averages $1,339 per month
- Occupancy maintains around 41.8%
- Daily rates hold near $132
Low Season (March, May, December)
- Revenue drops to average $748 per month
- Occupancy decreases to average 22.3%
- Daily rates adjust to average $129
Seasonality Insights for Campagne
- The Airbnb seasonality in Campagne shows highly seasonal trends requiring careful strategy. While the sections above show seasonal averages, it's also insightful to look at the extremes:
- During the high season, the absolute peak month showcases Campagne's highest earning potential, with monthly revenues capable of climbing to $3,000, occupancy reaching a high of 80.0%, and ADRs peaking at $144.
- Conversely, the slowest single month of the year, typically falling within the low season, marks the market's lowest point. In this month, revenue might dip to $516, occupancy could drop to 20.6%, and ADRs may adjust down to $126.
- Understanding both the seasonal averages and these monthly peaks and troughs in revenue, occupancy, and ADR is crucial for maximizing your Airbnb profit potential in Campagne.
Seasonal Strategies for Maximizing Profit
- Peak Season: Maximize revenue through premium pricing and potentially longer minimum stays. Ensure high availability.
- Low Season: Offer competitive pricing, special promotions (e.g., extended stay discounts), and flexible cancellation policies. Target off-season travelers like remote workers or budget-conscious guests.
- Shoulder Seasons: Implement dynamic pricing that balances peak and low rates. Target weekend travelers or specific events. Offer slightly more flexible terms than peak season.
- Regularly analyze your own performance against these Campagne seasonality benchmarks and adjust your pricing and availability strategy accordingly.
Best Areas for Airbnb Investment in Campagne (2025)
Exploring the top neighborhoods for short-term rentals in Campagne? This section highlights key areas, outlining why they are attractive for hosts and guests, along with notable local attractions. Consider these locations based on your target guest profile and investment strategy.
| Neighborhood / Area | Why Host Here? (Target Guests & Appeal) | Key Attractions & Landmarks |
|---|---|---|
| Bordeaux | Cultural hub of Nouvelle-Aquitaine, renowned for its wine and rich history. Attracts tourists interested in gastronomy, art, and architecture. | Place de la Bourse, Cité du Vin, Bordeaux's Historic Centre, Puy du Fou, Les Quais de Bordeaux |
| Arcachon | Popular summer destination known for its beautiful beaches and the Dune du Pilat, the highest sand dune in Europe. Ideal for vacation rentals and beach lovers. | Dune du Pilat, Cabin de Bain Beach, Arcachon Bay, Village de l'Herbe, Parc Mauresque |
| Saint-Émilion | World-famous wine region with UNESCO World Heritage status. Attracts visitors for wine tours and picturesque medieval architecture. | Monolithic Church of Saint-Émilion, Wine estates, Saint-Émilion village, Catalan Cross, La Grotte de l'Ermitage |
| La Rochelle | Seaside city with a vibrant port and historical fortifications. Popular with tourists for maritime culture and beautiful coastlines. | La Rochelle Aquarium, Old Port, Towers of La Rochelle, Les Minimes Beach, Fortifications |
| Pau | Charming city with views of the Pyrenees mountains. Known for its parks and historical sites, appealing to outdoor enthusiasts and history buffs alike. | Château de Pau, Boulevard des Pyrénées, Parc Beaumont, Funicular of Pau, Museums of Pau |
| Bayonne | Bilingual Basque city with a rich cultural heritage, renowned for its gastronomy, and proximity to the Basque coast. | Grand Bayonne, Bayonne Cathedral, Chocolateries, Basque cuisine, Basque Coast |
| Dax | Thermal spa town known for its wellness offerings and proximity to the Adour River, attracting visitors looking for relaxation and health. | Thermes de Dax, Adour River, Dax Cathedral, Fountain of Notre-Dame, Les Jardins de l'Hotel de Ville |
| Cognac | Famous for its brandy, Cognac draws visitors for distillery tours and tasting experiences, along with its picturesque countryside. | Cognac distilleries, Hennessy Cognac, Cognac Museum, Riverside stroll, Cognac vineyards |
Understanding Airbnb License Requirements & STR Laws in Campagne (2025)
With 19% of listings showing registration in 2025, understanding potential Airbnb license requirements is crucial in Campagne. Always verify the latest short term rental regulations and Airbnb license requirements directly with local government authorities for Campagne to ensure full compliance before hosting.
(Source: AirROI data, 2025, based on 19% licensed listings)
Top Performing Airbnb Properties in Campagne (2025)
Benchmark your potential! Explore examples of top-performing Airbnb properties in Campagnebased on Trailing Twelve Month (TTM) revenue. Analyze their characteristics, revenue, occupancy rate, and ADR to understand what drives success in this market.
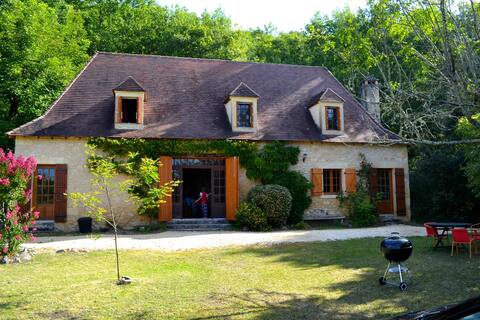
Gite with pool in the heart of the Dordogne
Entire Place • 2 bedrooms
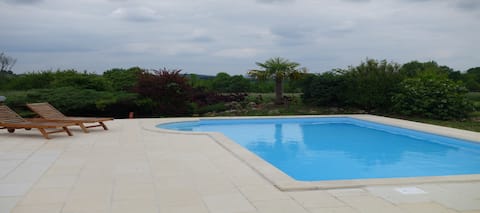
Gîte les pins de campagne
Entire Place • 2 bedrooms
Les Ambiances Perigourdines
Entire Place • 2 bedrooms
gite des Allas apartment in a quiet and nature
Entire Place • 1 bedroom
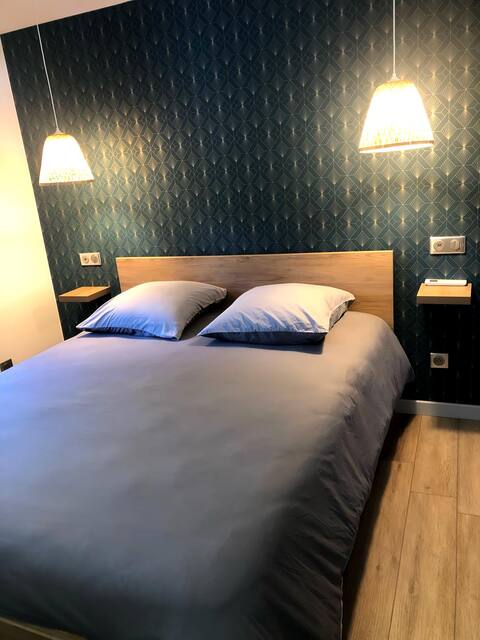
Bed and breakfast La Borie - Black Périgord
Private Room • 1 bedroom
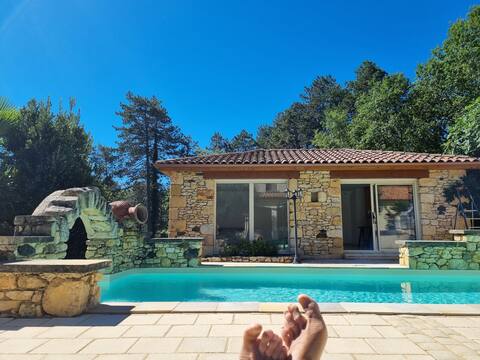
Spacious Villa With Pool
Entire Place • 3 bedrooms
Note: Performance varies based on location, size, amenities, seasonality, and management quality. Data reflects the past 12 months.
Top Performing Airbnb Hosts in Campagne (2025)
Learn from the best! This table showcases top-performing Airbnb hosts in Campagne based on the number of properties managed and estimated total revenue over the past year. Analyze their scale and performance metrics.
| Host Name | Properties | Grossing Revenue | Stay Reviews | Avg Rating |
|---|---|---|---|---|
| Evelyne | 4 | $24,858 | 171 | 4.95/5.0 |
| Alex | 1 | $24,795 | 21 | 4.86/5.0 |
| Laurent | 2 | $21,956 | 24 | 2.46/5.0 |
| Sylvie | 1 | $17,429 | 16 | 4.94/5.0 |
| Christine Et Olivier | 1 | $13,972 | 101 | 4.99/5.0 |
| Soemini | 1 | $11,557 | 26 | 4.58/5.0 |
| Julien | 1 | $9,590 | 28 | 5.00/5.0 |
| Sandra | 1 | $9,207 | 19 | 4.95/5.0 |
| Jan En Bea | 1 | $9,002 | 72 | 4.86/5.0 |
| Host #86484420 | 1 | $6,928 | 0 | 0.00/5.0 |
Analyzing the strategies of top hosts, such as their property selection, pricing, and guest communication, can offer valuable lessons for optimizing your own Airbnb operations in Campagne.
Dive Deeper: Advanced Campagne STR Market Data (2025)
Ready to unlock more insights? AirROI provides access to advanced metrics and comprehensive Airbnb data for Campagne. Explore detailed analytics beyond this report to refine your investment strategy, optimize pricing, and maximize your vacation rental profits.
Explore Advanced MetricsCampagne Short-Term Rental Market Composition (2025): Property & Room Types
Room Type Distribution
Property Type Distribution
Market Composition Insights for Campagne
- The Campagne Airbnb market composition is heavily skewed towards Entire Home/Apt listings, which make up 85.7% of the 21 active rentals. This indicates strong guest preference for privacy and space.
- Looking at the property type distribution in Campagne, House properties are the most common (57.1%), reflecting the local real estate landscape.
- Houses represent a significant 57.1% portion, catering likely to families or larger groups.
- The presence of 33.3% Hotel/Boutique listings indicates integration with traditional hospitality.
- Smaller segments like outdoor/unique, apartment/condo (combined 9.6%) offer potential for unique stay experiences.
Campagne Airbnb Room Capacity Analysis (2025): Bedroom Distribution
Distribution of Listings by Number of Bedrooms
Room Capacity Insights for Campagne
- The dominant room capacity in Campagne is 2 bedrooms listings, making up 42.9% of the market. This suggests a strong demand for properties suitable for couples or solo travelers.
- Together, 2 bedrooms and 1 bedroom properties represent 61.9% of the active Airbnb listings in Campagne, indicating a high concentration in these sizes.
- A significant 28.5% of listings offer 3+ bedrooms, catering to larger groups and families seeking more space in Campagne.
Campagne Vacation Rental Guest Capacity Trends (2025)
Distribution of Listings by Guest Capacity
Guest Capacity Insights for Campagne
- The most common guest capacity trend in Campagne vacation rentals is listings accommodating 4 guests (33.3%). This suggests the primary traveler segment is likely small families or groups.
- Properties designed for 4 guests and 6 guests dominate the Campagne STR market, accounting for 57.1% of listings.
- 33.4% of properties accommodate 6+ guests, serving the market segment for larger families or group travel in Campagne.
- On average, properties in Campagne are equipped to host 4.2 guests.
Campagne Airbnb Booking Patterns (2025): Available vs. Booked Days
Available Days Distribution
Booked Days Distribution
Booking Pattern Insights for Campagne
- The most common availability pattern in Campagne falls within the 271-366 days range, representing 76.2% of listings. This suggests many properties have significant open periods on their calendars.
- Approximately 90.5% of listings show high availability (181+ days open annually), indicating potential for increased bookings or specific owner usage patterns.
- For booked days, the 31-90 days range is most frequent in Campagne (52.4%), reflecting common guest stay durations or potential owner blocking patterns.
- A notable 9.5% of properties secure long booking periods (181+ days booked per year), highlighting successful long-term rental strategies or significant owner usage.
Campagne Airbnb Minimum Stay Requirements Analysis
Distribution of Listings by Minimum Night Requirement
1 Night
3 listings
15% of total
2 Nights
3 listings
15% of total
3 Nights
2 listings
10% of total
4-6 Nights
8 listings
40% of total
7-29 Nights
4 listings
20% of total
Key Insights
- The most prevalent minimum stay requirement in Campagne is 4-6 Nights, adopted by 40% of listings. This highlights the market's preference for longer commitments.
Recommendations
- Align with the market by considering a 4-6 Nights minimum stay, as 40% of Campagne hosts use this setting.
- If feasible, allowing 1-night stays, especially midweek or during low season, could capture last-minute bookings, as only 15% currently do.
- Adjust minimum nights based on seasonality – potentially shorter during low season and longer during peak demand periods in Campagne.
Campagne Airbnb Cancellation Policy Trends Analysis (2025)
Flexible
5 listings
27.8% of total
Moderate
7 listings
38.9% of total
Firm
3 listings
16.7% of total
Strict
3 listings
16.7% of total
Cancellation Policy Insights for Campagne
- The prevailing Airbnb cancellation policy trend in Campagne is Moderate, used by 38.9% of listings.
- There's a relatively balanced mix between guest-friendly (66.7%) and stricter (33.4%) policies, offering choices for different guest needs.
Recommendations for Hosts
- Consider adopting a Moderate policy to align with the 38.9% market standard in Campagne.
- Regularly review your cancellation policy against competitors and market demand shifts in Campagne.
Campagne STR Booking Lead Time Analysis (2025)
Average Booking Lead Time by Month
Booking Lead Time Insights for Campagne
- The overall average booking lead time for vacation rentals in Campagne is 74 days.
- Guests book furthest in advance for stays during November (average 198 days), likely coinciding with peak travel demand or local events.
- The shortest booking windows occur for stays in December (average 11 days), indicating more last-minute travel plans during this time.
- Seasonally, Summer (110 days avg.) sees the longest lead times, while Winter (16 days avg.) has the shortest, reflecting typical travel planning cycles.
Recommendations for Hosts
- Use the overall average lead time (74 days) as a baseline for your pricing and availability strategy in Campagne.
- For November stays, consider implementing length-of-stay discounts or slightly higher rates for bookings made less than 198 days out to capitalize on advance planning.
- During December, focus on last-minute booking availability and promotions, as guests book with very short notice (11 days avg.).
- Target marketing efforts for the Summer season well in advance (at least 110 days) to capture early planners.
- Monitor your own booking lead times against these Campagne averages to identify opportunities for dynamic pricing adjustments.
Popular & Essential Airbnb Amenities in Campagne (2025)
Amenity Prevalence
Amenity Insights for Campagne
- Essential amenities in Campagne that guests expect include: Free parking on premises. Lacking these (this) could significantly impact bookings.
- Popular amenities like Kitchen, Wifi, Hot water are common but not universal. Offering these can provide a competitive edge.
- Warning: Wifi is not universally provided but is considered essential globally. Ensure reliable Wifi is offered.
Recommendations for Hosts
- Ensure your listing includes all essential amenities for Campagne: Free parking on premises.
- Consider adding popular differentiators like Kitchen or Wifi to increase appeal.
- Highlight unique or less common amenities you offer (e.g., hot tub, dedicated workspace, EV charger) in your listing description and photos.
- Regularly check competitor amenities in Campagne to stay competitive.
Campagne Airbnb Guest Demographics & Profile Analysis (2025)
Guest Profile Summary for Campagne
- The typical guest profile for Airbnb in Campagne consists of primarily domestic travelers (70%), often arriving from nearby Paris, typically belonging to the Post-2000s (Gen Z/Alpha) group (50%), primarily speaking French or English.
- Domestic travelers account for 70.0% of guests.
- Key international markets include France (70%) and United Kingdom (10%).
- Top languages spoken are French (37.9%) followed by English (31%).
- A significant demographic segment is the Post-2000s (Gen Z/Alpha) group, representing 50% of guests.
Recommendations for Hosts
- Target domestic marketing efforts towards travelers from Paris and Bordeaux.
- Tailor amenities and listing descriptions to appeal to the dominant Post-2000s (Gen Z/Alpha) demographic (e.g., highlight fast WiFi, smart home features, local guides).
- Highlight unique local experiences or amenities relevant to the primary guest profile.
- Consider seasonal promotions aligned with peak travel times for key origin markets.
Nearby Short-Term Rental Market Comparison
How does the Campagne Airbnb market stack up against its neighbors? Compare key performance metrics like average monthly revenue, ADR, and occupancy rates in surrounding areas to understand the broader regional STR landscape.
| Market | Active Properties | Monthly Revenue | Daily Rate | Avg. Occupancy |
|---|---|---|---|---|
| Saint-Laurent-des-Combes | 11 | $3,526 | $706.18 | 23% |
| Astaffort | 10 | $3,393 | $314.20 | 35% |
| Cénac | 18 | $2,773 | $268.58 | 53% |
| Cérons | 11 | $2,635 | $196.16 | 39% |
| Galgon | 12 | $2,599 | $210.34 | 48% |
| Eynesse | 14 | $2,564 | $282.87 | 36% |
| Bourrou | 10 | $2,475 | $247.57 | 36% |
| Saint-Hippolyte | 10 | $2,443 | $204.98 | 44% |
| Carignan-de-Bordeaux | 30 | $2,418 | $236.77 | 48% |
| Abzac | 12 | $2,415 | $349.03 | 36% |