Cambo-les-Bains Airbnb Market Analysis 2025: Short Term Rental Data & Vacation Rental Statistics in Nouvelle-Aquitaine, France
Is Airbnb profitable in Cambo-les-Bains in 2025? Explore comprehensive Airbnb analytics for Cambo-les-Bains, Nouvelle-Aquitaine, France to uncover income potential. This 2025 STR market report for Cambo-les-Bains, based on AirROI data from April 2024 to March 2025, reveals key trends in the niche market of 191 active listings.
Whether you're considering an Airbnb investment in Cambo-les-Bains, optimizing your existing vacation rental, or exploring rental arbitrage opportunities, understanding the Cambo-les-Bains Airbnb data is crucial. Understanding the local regulations is key to maximizing your short term rental income potential. Let's dive into the specifics.
Key Cambo-les-Bains Airbnb Performance Metrics Overview
Monthly Airbnb Revenue Variations & Income Potential in Cambo-les-Bains (2025)
Understanding the monthly revenue variations for Airbnb listings in Cambo-les-Bains is key to maximizing your short term rental income potential. Seasonality significantly impacts earnings. Our analysis, based on data from the past 12 months, shows that the peak revenue month for STRs in Cambo-les-Bains is typically August, while January often presents the lowest earnings, highlighting opportunities for strategic pricing adjustments during shoulder and low seasons. Explore the typical Airbnb income in Cambo-les-Bains across different performance tiers:
- Best-in-class properties (Top 10%) achieve $2,195+ monthly, often utilizing dynamic pricing and superior guest experiences.
- Strong performing properties (Top 25%) earn $1,592 or more, indicating effective management and desirable locations/amenities.
- Typical properties (Median) generate around $1,112 per month, representing the average market performance.
- Entry-level properties (Bottom 25%) see earnings around $707, often with potential for optimization.
Average Monthly Airbnb Earnings Trend in Cambo-les-Bains
Cambo-les-Bains Airbnb Occupancy Rate Trends (2025)
Maximize your bookings by understanding the Cambo-les-Bains STR occupancy trends. Seasonal demand shifts significantly influence how often properties are booked. Typically, Augustsees the highest demand (peak season occupancy), while January experiences the lowest (low season). Effective strategies, like adjusting minimum stays or offering promotions, can boost occupancy during slower periods. Here's how different property tiers perform in Cambo-les-Bains:
- Best-in-class properties (Top 10%) achieve 87%+ occupancy, indicating high desirability and potentially optimized availability.
- Strong performing properties (Top 25%) maintain 71% or higher occupancy, suggesting good market fit and guest satisfaction.
- Typical properties (Median) have an occupancy rate around 54%.
- Entry-level properties (Bottom 25%) average 31% occupancy, potentially facing higher vacancy.
Average Monthly Occupancy Rate Trend in Cambo-les-Bains
Average Daily Rate (ADR) Airbnb Trends in Cambo-les-Bains (2025)
Effective short term rental pricing strategy in Cambo-les-Bains involves understanding monthly ADR fluctuations. The Average Daily Rate (ADR) for Airbnb in Cambo-les-Bains typically peaks in August and dips lowest during January. Leveraging Airbnb dynamic pricing tools or strategies based on this seasonality can significantly boost revenue. Here's a look at the typical nightly rates achieved:
- Best-in-class properties (Top 10%) command rates of $164+ per night, often due to premium features or locations.
- Strong performing properties (Top 25%) achieve nightly rates of $92 or more.
- Typical properties (Median) charge around $69 per night.
- Entry-level properties (Bottom 25%) earn around $54 per night.
Average Daily Rate (ADR) Trend by Month in Cambo-les-Bains
Get Live Cambo-les-Bains Market Intelligence 👇

Explore Real-time Analytics
Airbnb Seasonality Analysis & Trends in Cambo-les-Bains (2025)
Peak Season (August, July, September)
- Revenue averages $1,948 per month
- Occupancy rates average 70.7%
- Daily rates average $99
Shoulder Season
- Revenue averages $1,254 per month
- Occupancy maintains around 52.1%
- Daily rates hold near $91
Low Season (January, February, December)
- Revenue drops to average $621 per month
- Occupancy decreases to average 30.3%
- Daily rates adjust to average $82
Seasonality Insights for Cambo-les-Bains
- The Airbnb seasonality in Cambo-les-Bains shows highly seasonal trends requiring careful strategy. While the sections above show seasonal averages, it's also insightful to look at the extremes:
- During the high season, the absolute peak month showcases Cambo-les-Bains's highest earning potential, with monthly revenues capable of climbing to $2,192, occupancy reaching a high of 74.1%, and ADRs peaking at $101.
- Conversely, the slowest single month of the year, typically falling within the low season, marks the market's lowest point. In this month, revenue might dip to $575, occupancy could drop to 27.1%, and ADRs may adjust down to $81.
- Understanding both the seasonal averages and these monthly peaks and troughs in revenue, occupancy, and ADR is crucial for maximizing your Airbnb profit potential in Cambo-les-Bains.
Seasonal Strategies for Maximizing Profit
- Peak Season: Maximize revenue through premium pricing and potentially longer minimum stays. Ensure high availability.
- Low Season: Offer competitive pricing, special promotions (e.g., extended stay discounts), and flexible cancellation policies. Target off-season travelers like remote workers or budget-conscious guests.
- Shoulder Seasons: Implement dynamic pricing that balances peak and low rates. Target weekend travelers or specific events. Offer slightly more flexible terms than peak season.
- Regularly analyze your own performance against these Cambo-les-Bains seasonality benchmarks and adjust your pricing and availability strategy accordingly.
Best Areas for Airbnb Investment in Cambo-les-Bains (2025)
Exploring the top neighborhoods for short-term rentals in Cambo-les-Bains? This section highlights key areas, outlining why they are attractive for hosts and guests, along with notable local attractions. Consider these locations based on your target guest profile and investment strategy.
| Neighborhood / Area | Why Host Here? (Target Guests & Appeal) | Key Attractions & Landmarks |
|---|---|---|
| Cambo-les-Bains City Center | The heart of Cambo-les-Bains, perfect for visitors looking to explore local shops, restaurants, and the beautiful architecture of the town. Close to historical sites and local amenities. | Villa Arnaga, Eglise Saint-Laurent, Jardin de la Villa Arnaga, Chocolate Museum, Local artisan shops |
| Thermal Spa District | Known for its thermal baths and wellness centers, this area attracts health-conscious travelers looking for relaxation and rejuvenation. | Cambo-les-Bains Thermal Spa, Spas and wellness centers, Natural springs, Relaxation gardens, Health retreats |
| Hiking Trails | Ideal for outdoor enthusiasts, this area provides access to beautiful hiking trails in the surrounding Basque countryside, appealing to nature lovers and adventure seekers. | Sentier de la Rhune, Walking paths through the woods, Birdwatching spots, Scenic viewpoints, Basque Country nature |
| Cambo-les-Bains Golf Course | A prime choice for golf lovers, this area offers a serene environment with beautiful views, attracting both local and visiting golfers. | Cambo-les-Bains Golf Club, Beautiful landscapes, Clubhouse dining, Golf events and tournaments, Practice facilities |
| Basque Cuisine Area | This region is celebrated for its culinary delights and traditional Basque restaurants, making it a hotspot for foodies and culinary tourists. | Local tapas bars, Basque cooking classes, Street food markets, Wine tasting tours, Gastronomic festivals |
| Nearby Villages | The charming nearby villages offer a quaint experience for those wanting a more tranquil stay away from the town buzz, perfect for family-friendly vacations. | Historical villages, Quaint cafes, Local markets, Artisan crafts, Countryside landscapes |
| Cultural Festivals Zone | This area hosts various cultural events and festivals throughout the year, attracting tourists looking for authentic experiences and local culture. | Annual Basque Festival, Cultural exhibitions, Music and dance events, Local artisan markets, Theater performances |
| Nature Parks | Surrounded by stunning nature parks, this area appeals to eco-tourists and families wanting to explore the rich biodiversity of the region. | Parc Naturel Régional des Pyrénées, Bird watching, Nature trails, Family picnic spots, Outdoor activities |
Understanding Airbnb License Requirements & STR Laws in Cambo-les-Bains (2025)
With 16% of listings showing registration in 2025, understanding potential Airbnb license requirements is crucial in Cambo-les-Bains. Always verify the latest short term rental regulations and Airbnb license requirements directly with local government authorities for Cambo-les-Bains to ensure full compliance before hosting.
(Source: AirROI data, 2025, based on 16% licensed listings)
Top Performing Airbnb Properties in Cambo-les-Bains (2025)
Benchmark your potential! Explore examples of top-performing Airbnb properties in Cambo-les-Bainsbased on Trailing Twelve Month (TTM) revenue. Analyze their characteristics, revenue, occupancy rate, and ADR to understand what drives success in this market.
Large Basque house from the 1920s
Entire Place • 4 bedrooms

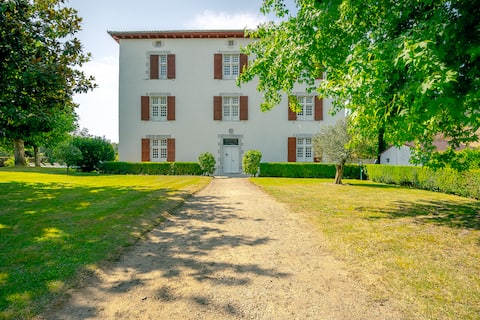
Beautiful completely renovated Basque farmhouse
Entire Place • 7 bedrooms
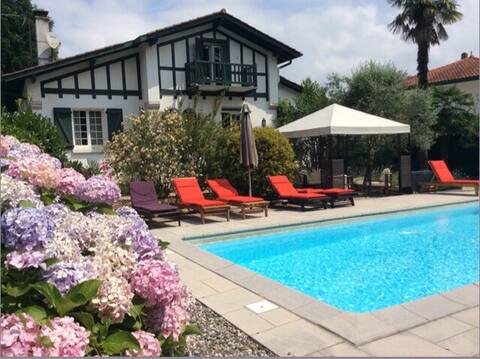
Beautiful 16thcentury villa with swimming pool
Entire Place • 8 bedrooms
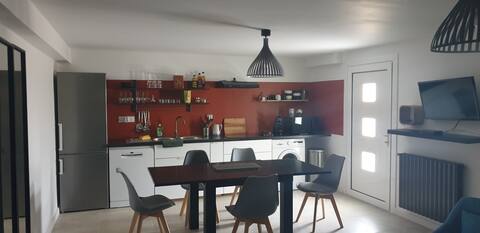
Comfortable house
Entire Place • 2 bedrooms
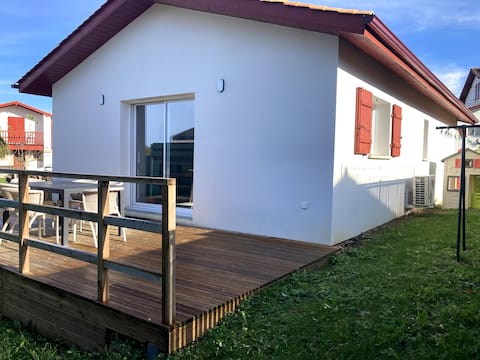
"Green" accommodation, with terraces
Entire Place • 2 bedrooms
Basque House
Entire Place • 2 bedrooms
Note: Performance varies based on location, size, amenities, seasonality, and management quality. Data reflects the past 12 months.
Top Performing Airbnb Hosts in Cambo-les-Bains (2025)
Learn from the best! This table showcases top-performing Airbnb hosts in Cambo-les-Bains based on the number of properties managed and estimated total revenue over the past year. Analyze their scale and performance metrics.
| Host Name | Properties | Grossing Revenue | Stay Reviews | Avg Rating |
|---|---|---|---|---|
| Paul | 6 | $104,386 | 362 | 4.81/5.0 |
| Claire | 2 | $88,167 | 63 | 4.94/5.0 |
| Virginie | 2 | $39,624 | 117 | 4.86/5.0 |
| Véronique | 1 | $36,057 | 27 | 4.93/5.0 |
| Olivier | 2 | $34,643 | 110 | 4.81/5.0 |
| Murielle | 1 | $33,718 | 3 | 5.00/5.0 |
| Thierry | 1 | $31,532 | 35 | 4.89/5.0 |
| Martine | 2 | $31,097 | 69 | 4.86/5.0 |
| Elorry | 1 | $26,044 | 10 | 4.90/5.0 |
| Cathy | 1 | $25,920 | 95 | 4.81/5.0 |
Analyzing the strategies of top hosts, such as their property selection, pricing, and guest communication, can offer valuable lessons for optimizing your own Airbnb operations in Cambo-les-Bains.
Dive Deeper: Advanced Cambo-les-Bains STR Market Data (2025)
Ready to unlock more insights? AirROI provides access to advanced metrics and comprehensive Airbnb data for Cambo-les-Bains. Explore detailed analytics beyond this report to refine your investment strategy, optimize pricing, and maximize your vacation rental profits.
Explore Advanced MetricsCambo-les-Bains Short-Term Rental Market Composition (2025): Property & Room Types
Room Type Distribution
Property Type Distribution
Market Composition Insights for Cambo-les-Bains
- The Cambo-les-Bains Airbnb market composition is heavily skewed towards Entire Home/Apt listings, which make up 94.2% of the 191 active rentals. This indicates strong guest preference for privacy and space.
- Looking at the property type distribution in Cambo-les-Bains, Apartment/Condo properties are the most common (71.7%), reflecting the local real estate landscape.
- Houses represent a significant 20.4% portion, catering likely to families or larger groups.
- The presence of 6.3% Hotel/Boutique listings indicates integration with traditional hospitality.
- Smaller segments like others, unique stays (combined 1.5%) offer potential for unique stay experiences.
Cambo-les-Bains Airbnb Room Capacity Analysis (2025): Bedroom Distribution
Distribution of Listings by Number of Bedrooms
Room Capacity Insights for Cambo-les-Bains
- The dominant room capacity in Cambo-les-Bains is 1 bedroom listings, making up 56.5% of the market. This suggests a strong demand for properties suitable for couples or solo travelers.
- Together, 1 bedroom and 2 bedrooms properties represent 75.3% of the active Airbnb listings in Cambo-les-Bains, indicating a high concentration in these sizes.
- With over half the market (56.5%) consisting of studios or 1-bedroom units, Cambo-les-Bains is particularly well-suited for individuals or couples.
- Listings with 3+ bedrooms (8.9%) represent a smaller niche, potentially indicating an underserved market for larger group accommodations in Cambo-les-Bains.
Cambo-les-Bains Vacation Rental Guest Capacity Trends (2025)
Distribution of Listings by Guest Capacity
Guest Capacity Insights for Cambo-les-Bains
- The most common guest capacity trend in Cambo-les-Bains vacation rentals is listings accommodating 2 guests (46.6%). This suggests the primary traveler segment is likely couples or solo travelers.
- Properties designed for 2 guests and 4 guests dominate the Cambo-les-Bains STR market, accounting for 75.4% of listings.
- A significant 46.6% of listings cater specifically to 1-2 guests, highlighting strong demand from couples and solo travelers in Cambo-les-Bains.
- 12.6% of properties accommodate 6+ guests, serving the market segment for larger families or group travel in Cambo-les-Bains.
- On average, properties in Cambo-les-Bains are equipped to host 3.2 guests.
Cambo-les-Bains Airbnb Booking Patterns (2025): Available vs. Booked Days
Available Days Distribution
Booked Days Distribution
Booking Pattern Insights for Cambo-les-Bains
- The most common availability pattern in Cambo-les-Bains falls within the 271-366 days range, representing 34.6% of listings. This suggests many properties have significant open periods on their calendars.
- Approximately 64.4% of listings show high availability (181+ days open annually), indicating potential for increased bookings or specific owner usage patterns.
- For booked days, the 181-270 days range is most frequent in Cambo-les-Bains (31.4%), reflecting common guest stay durations or potential owner blocking patterns.
- A notable 36.6% of properties secure long booking periods (181+ days booked per year), highlighting successful long-term rental strategies or significant owner usage.
Cambo-les-Bains Airbnb Minimum Stay Requirements Analysis
Distribution of Listings by Minimum Night Requirement
1 Night
13 listings
7.2% of total
2 Nights
42 listings
23.3% of total
3 Nights
18 listings
10% of total
4-6 Nights
56 listings
31.1% of total
7-29 Nights
36 listings
20% of total
30+ Nights
15 listings
8.3% of total
Key Insights
- The most prevalent minimum stay requirement in Cambo-les-Bains is 4-6 Nights, adopted by 31.1% of listings. This highlights the market's preference for longer commitments.
Recommendations
- Align with the market by considering a 4-6 Nights minimum stay, as 31.1% of Cambo-les-Bains hosts use this setting.
- If feasible, allowing 1-night stays, especially midweek or during low season, could capture last-minute bookings, as only 7.2% currently do.
- Explore offering discounts for stays of 30+ nights to attract the 8.3% of the market seeking extended stays.
- Adjust minimum nights based on seasonality – potentially shorter during low season and longer during peak demand periods in Cambo-les-Bains.
Cambo-les-Bains Airbnb Cancellation Policy Trends Analysis (2025)
Flexible
46 listings
26.4% of total
Moderate
32 listings
18.4% of total
Firm
41 listings
23.6% of total
Strict
55 listings
31.6% of total
Cancellation Policy Insights for Cambo-les-Bains
- The prevailing Airbnb cancellation policy trend in Cambo-les-Bains is Strict, used by 31.6% of listings.
- A majority (55.2%) of hosts in Cambo-les-Bains utilize Firm or Strict policies, indicating a market where hosts prioritize booking security.
Recommendations for Hosts
- Consider adopting a Strict policy to align with the 31.6% market standard in Cambo-les-Bains.
- With 31.6% using Strict terms, this is a viable option in Cambo-les-Bains, particularly for high-value properties or during peak demand periods.
- Regularly review your cancellation policy against competitors and market demand shifts in Cambo-les-Bains.
Cambo-les-Bains STR Booking Lead Time Analysis (2025)
Average Booking Lead Time by Month
Booking Lead Time Insights for Cambo-les-Bains
- The overall average booking lead time for vacation rentals in Cambo-les-Bains is 90 days.
- Guests book furthest in advance for stays during October (average 156 days), likely coinciding with peak travel demand or local events.
- The shortest booking windows occur for stays in January (average 36 days), indicating more last-minute travel plans during this time.
- Seasonally, Fall (135 days avg.) sees the longest lead times, while Winter (46 days avg.) has the shortest, reflecting typical travel planning cycles.
Recommendations for Hosts
- Use the overall average lead time (90 days) as a baseline for your pricing and availability strategy in Cambo-les-Bains.
- For October stays, consider implementing length-of-stay discounts or slightly higher rates for bookings made less than 156 days out to capitalize on advance planning.
- Target marketing efforts for the Fall season well in advance (at least 135 days) to capture early planners.
- Monitor your own booking lead times against these Cambo-les-Bains averages to identify opportunities for dynamic pricing adjustments.
Popular & Essential Airbnb Amenities in Cambo-les-Bains (2025)
Amenity Prevalence
Amenity Insights for Cambo-les-Bains
- Essential amenities in Cambo-les-Bains that guests expect include: TV, Kitchen, Heating. Lacking these (any) could significantly impact bookings.
- Popular amenities like Free parking on premises, Hot water, Smoke alarm are common but not universal. Offering these can provide a competitive edge.
- Warning: Wifi is not universally provided but is considered essential globally. Ensure reliable Wifi is offered.
Recommendations for Hosts
- Ensure your listing includes all essential amenities for Cambo-les-Bains: TV, Kitchen, Heating.
- Prioritize adding missing essentials: TV, Kitchen, Heating.
- Consider adding popular differentiators like Free parking on premises or Hot water to increase appeal.
- Highlight unique or less common amenities you offer (e.g., hot tub, dedicated workspace, EV charger) in your listing description and photos.
- Regularly check competitor amenities in Cambo-les-Bains to stay competitive.
Cambo-les-Bains Airbnb Guest Demographics & Profile Analysis (2025)
Guest Profile Summary for Cambo-les-Bains
- The typical guest profile for Airbnb in Cambo-les-Bains consists of primarily domestic travelers (90%), often arriving from nearby Paris, typically belonging to the Post-2000s (Gen Z/Alpha) group (50%), primarily speaking French or English.
- Domestic travelers account for 89.8% of guests.
- Key international markets include France (89.8%) and Spain (4.9%).
- Top languages spoken are French (46%) followed by English (30.4%).
- A significant demographic segment is the Post-2000s (Gen Z/Alpha) group, representing 50% of guests.
Recommendations for Hosts
- Target domestic marketing efforts towards travelers from Paris and Bordeaux.
- Tailor amenities and listing descriptions to appeal to the dominant Post-2000s (Gen Z/Alpha) demographic (e.g., highlight fast WiFi, smart home features, local guides).
- Highlight unique local experiences or amenities relevant to the primary guest profile.
- Consider seasonal promotions aligned with peak travel times for key origin markets.
Nearby Short-Term Rental Market Comparison
How does the Cambo-les-Bains Airbnb market stack up against its neighbors? Compare key performance metrics like average monthly revenue, ADR, and occupancy rates in surrounding areas to understand the broader regional STR landscape.
| Market | Active Properties | Monthly Revenue | Daily Rate | Avg. Occupancy |
|---|---|---|---|---|
| San Sebastián | 1,426 | $3,546 | $262.81 | 49% |
| Saint-Laurent-des-Combes | 11 | $3,526 | $706.18 | 23% |
| Gautegiz Arteaga | 21 | $2,865 | $293.66 | 38% |
| Cénac | 18 | $2,773 | $268.58 | 53% |
| Labastida/Bastida | 11 | $2,662 | $268.80 | 34% |
| Cérons | 11 | $2,635 | $196.16 | 39% |
| Barrika | 13 | $2,629 | $314.61 | 41% |
| Galgon | 12 | $2,599 | $210.34 | 48% |
| Esteribar | 20 | $2,574 | $276.81 | 32% |
| Hernani | 11 | $2,572 | $345.16 | 40% |