Bourg Airbnb Market Analysis 2025: Short Term Rental Data & Vacation Rental Statistics in Nouvelle-Aquitaine, France
Is Airbnb profitable in Bourg in 2025? Explore comprehensive Airbnb analytics for Bourg, Nouvelle-Aquitaine, France to uncover income potential. This 2025 STR market report for Bourg, based on AirROI data from April 2024 to March 2025, reveals key trends in the niche market of 30 active listings.
Whether you're considering an Airbnb investment in Bourg, optimizing your existing vacation rental, or exploring rental arbitrage opportunities, understanding the Bourg Airbnb data is crucial. Leveraging the low regulation environment is key to maximizing your short term rental income potential. Let's dive into the specifics.
Key Bourg Airbnb Performance Metrics Overview
Monthly Airbnb Revenue Variations & Income Potential in Bourg (2025)
Understanding the monthly revenue variations for Airbnb listings in Bourg is key to maximizing your short term rental income potential. Seasonality significantly impacts earnings. Our analysis, based on data from the past 12 months, shows that the peak revenue month for STRs in Bourg is typically August, while January often presents the lowest earnings, highlighting opportunities for strategic pricing adjustments during shoulder and low seasons. Explore the typical Airbnb income in Bourg across different performance tiers:
- Best-in-class properties (Top 10%) achieve $3,582+ monthly, often utilizing dynamic pricing and superior guest experiences.
- Strong performing properties (Top 25%) earn $1,822 or more, indicating effective management and desirable locations/amenities.
- Typical properties (Median) generate around $1,060 per month, representing the average market performance.
- Entry-level properties (Bottom 25%) see earnings around $534, often with potential for optimization.
Average Monthly Airbnb Earnings Trend in Bourg
Bourg Airbnb Occupancy Rate Trends (2025)
Maximize your bookings by understanding the Bourg STR occupancy trends. Seasonal demand shifts significantly influence how often properties are booked. Typically, Augustsees the highest demand (peak season occupancy), while January experiences the lowest (low season). Effective strategies, like adjusting minimum stays or offering promotions, can boost occupancy during slower periods. Here's how different property tiers perform in Bourg:
- Best-in-class properties (Top 10%) achieve 63%+ occupancy, indicating high desirability and potentially optimized availability.
- Strong performing properties (Top 25%) maintain 50% or higher occupancy, suggesting good market fit and guest satisfaction.
- Typical properties (Median) have an occupancy rate around 29%.
- Entry-level properties (Bottom 25%) average 16% occupancy, potentially facing higher vacancy.
Average Monthly Occupancy Rate Trend in Bourg
Average Daily Rate (ADR) Airbnb Trends in Bourg (2025)
Effective short term rental pricing strategy in Bourg involves understanding monthly ADR fluctuations. The Average Daily Rate (ADR) for Airbnb in Bourg typically peaks in November and dips lowest during June. Leveraging Airbnb dynamic pricing tools or strategies based on this seasonality can significantly boost revenue. Here's a look at the typical nightly rates achieved:
- Best-in-class properties (Top 10%) command rates of $340+ per night, often due to premium features or locations.
- Strong performing properties (Top 25%) achieve nightly rates of $141 or more.
- Typical properties (Median) charge around $99 per night.
- Entry-level properties (Bottom 25%) earn around $68 per night.
Average Daily Rate (ADR) Trend by Month in Bourg
Get Live Bourg Market Intelligence 👇

Explore Real-time Analytics
Airbnb Seasonality Analysis & Trends in Bourg (2025)
Peak Season (August, July, May)
- Revenue averages $2,603 per month
- Occupancy rates average 48.5%
- Daily rates average $148
Shoulder Season
- Revenue averages $1,614 per month
- Occupancy maintains around 32.0%
- Daily rates hold near $156
Low Season (January, October, December)
- Revenue drops to average $973 per month
- Occupancy decreases to average 23.1%
- Daily rates adjust to average $157
Seasonality Insights for Bourg
- The Airbnb seasonality in Bourg shows highly seasonal trends requiring careful strategy. While the sections above show seasonal averages, it's also insightful to look at the extremes:
- During the high season, the absolute peak month showcases Bourg's highest earning potential, with monthly revenues capable of climbing to $2,870, occupancy reaching a high of 55.6%, and ADRs peaking at $169.
- Conversely, the slowest single month of the year, typically falling within the low season, marks the market's lowest point. In this month, revenue might dip to $735, occupancy could drop to 19.4%, and ADRs may adjust down to $145.
- Understanding both the seasonal averages and these monthly peaks and troughs in revenue, occupancy, and ADR is crucial for maximizing your Airbnb profit potential in Bourg.
Seasonal Strategies for Maximizing Profit
- Peak Season: Maximize revenue through premium pricing and potentially longer minimum stays. Ensure high availability.
- Low Season: Offer competitive pricing, special promotions (e.g., extended stay discounts), and flexible cancellation policies. Target off-season travelers like remote workers or budget-conscious guests.
- Shoulder Seasons: Implement dynamic pricing that balances peak and low rates. Target weekend travelers or specific events. Offer slightly more flexible terms than peak season.
- Regularly analyze your own performance against these Bourg seasonality benchmarks and adjust your pricing and availability strategy accordingly.
Best Areas for Airbnb Investment in Bourg (2025)
Exploring the top neighborhoods for short-term rentals in Bourg? This section highlights key areas, outlining why they are attractive for hosts and guests, along with notable local attractions. Consider these locations based on your target guest profile and investment strategy.
| Neighborhood / Area | Why Host Here? (Target Guests & Appeal) | Key Attractions & Landmarks |
|---|---|---|
| Bourg-sur-Gironde | Charming riverside town with a rich history and beautiful architecture. Ideal for tourists looking for a serene getaway and proximity to Bordeaux. | Place de la République, La Citadelle, Château de Bourg, Bourg Wine Museum, Riverside walks, Local markets |
| Saint-Émilion | Famous wine village known for its historic vineyards and beautiful landscapes. A UNESCO World Heritage site attracting wine enthusiasts and tourists. | Monolithic Church, Vineyard tours, Château Ausone, Saint-Émilion wine festival, Les Tours de la Porte de la Cadène, Local wine cellars |
| Libourne | A vibrant town on the banks of the Dordogne river, offering a mix of history and modern amenities. Great for visitors exploring the surrounding vineyards. | Libourne market, La rivière Dordogne, Château de la Dauphine, Basilique Saint-Émilion, Weekly local markets, Wine tasting tours |
| Pessac | Part of the Bordeaux Metropolis, known for its wine and proximity to the center of Bordeaux. Attractive to business travelers and tourists alike. | Pessac Leognan vineyards, Bordeaux Museum of Contemporary Art, Parc Bordelais, Château Pape Clément, Local cafés and bistros, Wine tasting tours |
| Blaye | Historic fortified town recognized by UNESCO, with stunning views over the Gironde estuary. Ideal for travelers interested in history and wine. | Citadel of Blaye, Vineyards of Blaye, Local wine shops, Historic town center, Promenade along the estuary, Blaye market |
| Cognac | Famous for its brandy, Cognac attracts visitors for its distilleries and scenic river views. Excellent for tourists wanting a unique experience. | Cognac vineyards, Hennessy distillery tours, Cognac museum, Charente river cruises, Place François 1er, Cognac festivals |
| Arcachon | Popular beach destination renowned for its sandy shores and vibrant summer atmosphere. A great spot for families and beach lovers. | Dune du Pilat, Arcachon Bay, Cap Ferret, Ocean beaches, Local seafood restaurants, Water sports activities |
| Cap Ferret | Charming coastal village known for its picturesque beaches and relaxing atmosphere. A preferred getaway for those seeking tranquility by the sea. | Bassin d'Arcachon, Cap Ferret lighthouse, Local oyster farms, Beaches, Cycling paths, Quaint shops and cafés |
Understanding Airbnb License Requirements & STR Laws in Bourg (2025)
While Bourg, Nouvelle-Aquitaine, France currently shows low STR regulations, specific Airbnb license requirements might still exist or change. Always verify the latest short term rental regulations and Airbnb license requirements directly with local government authorities for Bourg to ensure full compliance before hosting.
(Source: AirROI data, 2025, finding no licensed listings among those analyzed)
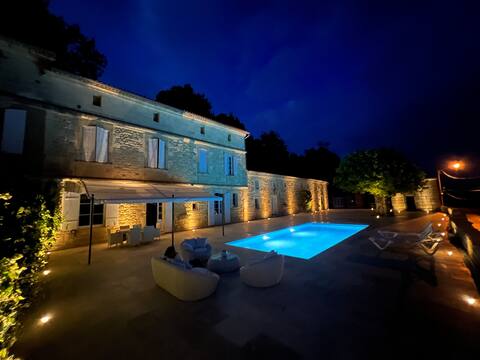
Top Performing Airbnb Properties in Bourg (2025)
Benchmark your potential! Explore examples of top-performing Airbnb properties in Bourgbased on Trailing Twelve Month (TTM) revenue. Analyze their characteristics, revenue, occupancy rate, and ADR to understand what drives success in this market.
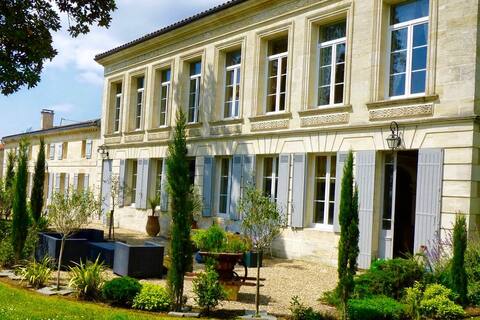
Historic villa with sunny pool and lovely grounds
Entire Place • 7 bedrooms
Château viticole
Entire Place • 3 bedrooms

Townhouse by the harbour
Entire Place • 3 bedrooms
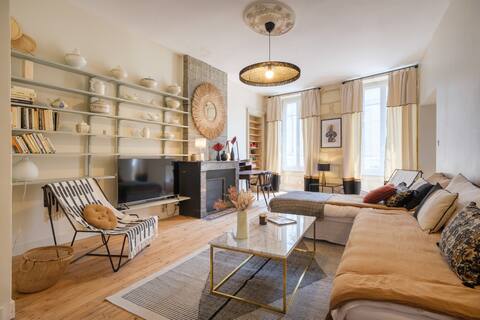
Apartment+ patio in the historic center of Bourg
Entire Place • 1 bedroom
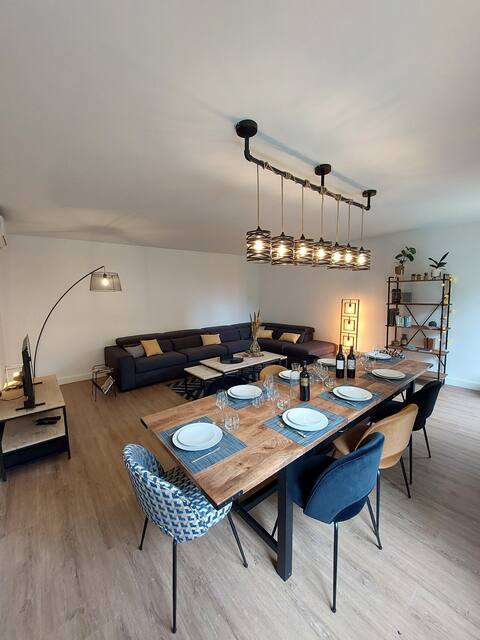
Gite des harvesters sur exploitation viticulture AB
Entire Place • 4 bedrooms

C.Cabane, Unusual Accommodation
Entire Place • 1 bedroom
Note: Performance varies based on location, size, amenities, seasonality, and management quality. Data reflects the past 12 months.
Top Performing Airbnb Hosts in Bourg (2025)
Learn from the best! This table showcases top-performing Airbnb hosts in Bourg based on the number of properties managed and estimated total revenue over the past year. Analyze their scale and performance metrics.
| Host Name | Properties | Grossing Revenue | Stay Reviews | Avg Rating |
|---|---|---|---|---|
| James | 1 | $96,512 | 33 | 4.91/5.0 |
| Aurelio Y Monica | 1 | $49,872 | 3 | 5.00/5.0 |
| Marion | 3 | $45,497 | 54 | 3.23/5.0 |
| David | 2 | $34,394 | 184 | 4.83/5.0 |
| Fanny Et Paul | 1 | $20,224 | 80 | 4.98/5.0 |
| Amélie | 1 | $19,071 | 6 | 5.00/5.0 |
| Dany | 1 | $18,624 | 126 | 4.96/5.0 |
| Mederick | 1 | $16,945 | 23 | 4.96/5.0 |
| Laurence | 1 | $16,863 | 9 | 4.89/5.0 |
| Valerie | 1 | $15,411 | 22 | 5.00/5.0 |
Analyzing the strategies of top hosts, such as their property selection, pricing, and guest communication, can offer valuable lessons for optimizing your own Airbnb operations in Bourg.
Dive Deeper: Advanced Bourg STR Market Data (2025)
Ready to unlock more insights? AirROI provides access to advanced metrics and comprehensive Airbnb data for Bourg. Explore detailed analytics beyond this report to refine your investment strategy, optimize pricing, and maximize your vacation rental profits.
Explore Advanced MetricsBourg Short-Term Rental Market Composition (2025): Property & Room Types
Room Type Distribution
Property Type Distribution
Market Composition Insights for Bourg
- The Bourg Airbnb market composition is heavily skewed towards Entire Home/Apt listings, which make up 93.3% of the 30 active rentals. This indicates strong guest preference for privacy and space.
- Looking at the property type distribution in Bourg, House properties are the most common (60%), reflecting the local real estate landscape.
- Houses represent a significant 60% portion, catering likely to families or larger groups.
- The presence of 6.7% Hotel/Boutique listings indicates integration with traditional hospitality.
- Smaller segments like outdoor/unique, unique stays (combined 6.6%) offer potential for unique stay experiences.
Bourg Airbnb Room Capacity Analysis (2025): Bedroom Distribution
Distribution of Listings by Number of Bedrooms
Room Capacity Insights for Bourg
- The dominant room capacity in Bourg is 1 bedroom listings, making up 40% of the market. This suggests a strong demand for properties suitable for couples or solo travelers.
- Together, 1 bedroom and 2 bedrooms properties represent 63.3% of the active Airbnb listings in Bourg, indicating a high concentration in these sizes.
- A significant 36.6% of listings offer 3+ bedrooms, catering to larger groups and families seeking more space in Bourg.
Bourg Vacation Rental Guest Capacity Trends (2025)
Distribution of Listings by Guest Capacity
Guest Capacity Insights for Bourg
- The most common guest capacity trend in Bourg vacation rentals is listings accommodating 2 guests (40%). This suggests the primary traveler segment is likely couples or solo travelers.
- Properties designed for 2 guests and 8+ guests dominate the Bourg STR market, accounting for 63.3% of listings.
- 29.9% of properties accommodate 6+ guests, serving the market segment for larger families or group travel in Bourg.
- On average, properties in Bourg are equipped to host 4.4 guests.
Bourg Airbnb Booking Patterns (2025): Available vs. Booked Days
Available Days Distribution
Booked Days Distribution
Booking Pattern Insights for Bourg
- The most common availability pattern in Bourg falls within the 271-366 days range, representing 50% of listings. This suggests many properties have significant open periods on their calendars.
- Approximately 86.7% of listings show high availability (181+ days open annually), indicating potential for increased bookings or specific owner usage patterns.
- For booked days, the 31-90 days range is most frequent in Bourg (36.7%), reflecting common guest stay durations or potential owner blocking patterns.
- A notable 16.7% of properties secure long booking periods (181+ days booked per year), highlighting successful long-term rental strategies or significant owner usage.
Bourg Airbnb Minimum Stay Requirements Analysis
Distribution of Listings by Minimum Night Requirement
1 Night
12 listings
41.4% of total
2 Nights
8 listings
27.6% of total
3 Nights
1 listings
3.4% of total
4-6 Nights
4 listings
13.8% of total
7-29 Nights
4 listings
13.8% of total
Key Insights
- The most prevalent minimum stay requirement in Bourg is 1 Night, adopted by 41.4% of listings. This highlights the market's preference for shorter, flexible bookings.
- A strong majority (69.0%) of the Bourg Airbnb data shows acceptance of very short stays (1-2 nights), indicating a dynamic, high-turnover market.
Recommendations
- Align with the market by considering a 1 Night minimum stay, as 41.4% of Bourg hosts use this setting.
- Adjust minimum nights based on seasonality – potentially shorter during low season and longer during peak demand periods in Bourg.
Bourg Airbnb Cancellation Policy Trends Analysis (2025)
Flexible
8 listings
30.8% of total
Moderate
11 listings
42.3% of total
Firm
4 listings
15.4% of total
Strict
3 listings
11.5% of total
Cancellation Policy Insights for Bourg
- The prevailing Airbnb cancellation policy trend in Bourg is Moderate, used by 42.3% of listings.
- The market strongly favors guest-friendly terms, with 73.1% of listings offering Flexible or Moderate policies. This suggests guests in Bourg may expect booking flexibility.
Recommendations for Hosts
- Consider adopting a Moderate policy to align with the 42.3% market standard in Bourg.
- Using a Strict policy might deter some guests, as only 11.5% of listings use it. Evaluate if potential revenue protection outweighs possible lower booking rates.
- Regularly review your cancellation policy against competitors and market demand shifts in Bourg.
Bourg STR Booking Lead Time Analysis (2025)
Average Booking Lead Time by Month
Booking Lead Time Insights for Bourg
- The overall average booking lead time for vacation rentals in Bourg is 71 days.
- Guests book furthest in advance for stays during August (average 106 days), likely coinciding with peak travel demand or local events.
- The shortest booking windows occur for stays in March (average 25 days), indicating more last-minute travel plans during this time.
- Seasonally, Summer (98 days avg.) sees the longest lead times, while Winter (35 days avg.) has the shortest, reflecting typical travel planning cycles.
Recommendations for Hosts
- Use the overall average lead time (71 days) as a baseline for your pricing and availability strategy in Bourg.
- For August stays, consider implementing length-of-stay discounts or slightly higher rates for bookings made less than 106 days out to capitalize on advance planning.
- Target marketing efforts for the Summer season well in advance (at least 98 days) to capture early planners.
- Monitor your own booking lead times against these Bourg averages to identify opportunities for dynamic pricing adjustments.
Popular & Essential Airbnb Amenities in Bourg (2025)
Amenity Prevalence
Amenity Insights for Bourg
- Essential amenities in Bourg that guests expect include: Heating, Essentials, Hair dryer, Wifi. Lacking these (any) could significantly impact bookings.
- Popular amenities like TV, Kitchen, Smoke alarm are common but not universal. Offering these can provide a competitive edge.
Recommendations for Hosts
- Ensure your listing includes all essential amenities for Bourg: Heating, Essentials, Hair dryer, Wifi.
- Prioritize adding missing essentials: Hair dryer, Wifi.
- Consider adding popular differentiators like TV or Kitchen to increase appeal.
- Highlight unique or less common amenities you offer (e.g., hot tub, dedicated workspace, EV charger) in your listing description and photos.
- Regularly check competitor amenities in Bourg to stay competitive.
Bourg Airbnb Guest Demographics & Profile Analysis (2025)
Guest Profile Summary for Bourg
- The typical guest profile for Airbnb in Bourg consists of primarily domestic travelers (76%), often arriving from nearby Bordeaux, typically belonging to the Post-2000s (Gen Z/Alpha) group (50%), primarily speaking French or English.
- Domestic travelers account for 75.7% of guests.
- Key international markets include France (75.7%) and United Kingdom (7.6%).
- Top languages spoken are French (46.8%) followed by English (29.5%).
- A significant demographic segment is the Post-2000s (Gen Z/Alpha) group, representing 50% of guests.
Recommendations for Hosts
- Target domestic marketing efforts towards travelers from Bordeaux and Paris.
- Tailor amenities and listing descriptions to appeal to the dominant Post-2000s (Gen Z/Alpha) demographic (e.g., highlight fast WiFi, smart home features, local guides).
- Highlight unique local experiences or amenities relevant to the primary guest profile.
- Consider seasonal promotions aligned with peak travel times for key origin markets.
Nearby Short-Term Rental Market Comparison
How does the Bourg Airbnb market stack up against its neighbors? Compare key performance metrics like average monthly revenue, ADR, and occupancy rates in surrounding areas to understand the broader regional STR landscape.
| Market | Active Properties | Monthly Revenue | Daily Rate | Avg. Occupancy |
|---|---|---|---|---|
| Saint-Laurent-des-Combes | 11 | $3,526 | $706.18 | 23% |
| Astaffort | 10 | $3,393 | $314.20 | 35% |
| Cénac | 18 | $2,773 | $268.58 | 53% |
| Bourneau | 11 | $2,747 | $442.07 | 35% |
| Nuaillé-d'Aunis | 10 | $2,741 | $373.83 | 37% |
| Cérons | 11 | $2,635 | $196.16 | 39% |
| Galgon | 12 | $2,599 | $210.34 | 48% |
| Eynesse | 14 | $2,564 | $282.87 | 36% |
| Le Bois-Plage-en-Ré | 303 | $2,528 | $284.63 | 45% |
| Le Grand-Pressigny | 11 | $2,511 | $266.72 | 31% |