Bordeaux Airbnb Market Analysis 2025: Short Term Rental Data & Vacation Rental Statistics in Nouvelle-Aquitaine, France
Is Airbnb profitable in Bordeaux in 2025? Explore comprehensive Airbnb analytics for Bordeaux, Nouvelle-Aquitaine, France to uncover income potential. This 2025 STR market report for Bordeaux, based on AirROI data from April 2024 to March 2025, reveals key trends in the bustling market of 3,407 active listings.
Whether you're considering an Airbnb investment in Bordeaux, optimizing your existing vacation rental, or exploring rental arbitrage opportunities, understanding the Bordeaux Airbnb data is crucial. Navigating the high regulation landscape is key to maximizing your short term rental income potential. Let's dive into the specifics.
Key Bordeaux Airbnb Performance Metrics Overview
Monthly Airbnb Revenue Variations & Income Potential in Bordeaux (2025)
Understanding the monthly revenue variations for Airbnb listings in Bordeaux is key to maximizing your short term rental income potential. Seasonality significantly impacts earnings. Our analysis, based on data from the past 12 months, shows that the peak revenue month for STRs in Bordeaux is typically May, while March often presents the lowest earnings, highlighting opportunities for strategic pricing adjustments during shoulder and low seasons. Explore the typical Airbnb income in Bordeaux across different performance tiers:
- Best-in-class properties (Top 10%) achieve $4,551+ monthly, often utilizing dynamic pricing and superior guest experiences.
- Strong performing properties (Top 25%) earn $2,838 or more, indicating effective management and desirable locations/amenities.
- Typical properties (Median) generate around $1,732 per month, representing the average market performance.
- Entry-level properties (Bottom 25%) see earnings around $886, often with potential for optimization.
Average Monthly Airbnb Earnings Trend in Bordeaux
Bordeaux Airbnb Occupancy Rate Trends (2025)
Maximize your bookings by understanding the Bordeaux STR occupancy trends. Seasonal demand shifts significantly influence how often properties are booked. Typically, Septembersees the highest demand (peak season occupancy), while March experiences the lowest (low season). Effective strategies, like adjusting minimum stays or offering promotions, can boost occupancy during slower periods. Here's how different property tiers perform in Bordeaux:
- Best-in-class properties (Top 10%) achieve 88%+ occupancy, indicating high desirability and potentially optimized availability.
- Strong performing properties (Top 25%) maintain 74% or higher occupancy, suggesting good market fit and guest satisfaction.
- Typical properties (Median) have an occupancy rate around 50%.
- Entry-level properties (Bottom 25%) average 25% occupancy, potentially facing higher vacancy.
Average Monthly Occupancy Rate Trend in Bordeaux
Average Daily Rate (ADR) Airbnb Trends in Bordeaux (2025)
Effective short term rental pricing strategy in Bordeaux involves understanding monthly ADR fluctuations. The Average Daily Rate (ADR) for Airbnb in Bordeaux typically peaks in November and dips lowest during April. Leveraging Airbnb dynamic pricing tools or strategies based on this seasonality can significantly boost revenue. Here's a look at the typical nightly rates achieved:
- Best-in-class properties (Top 10%) command rates of $239+ per night, often due to premium features or locations.
- Strong performing properties (Top 25%) achieve nightly rates of $151 or more.
- Typical properties (Median) charge around $100 per night.
- Entry-level properties (Bottom 25%) earn around $70 per night.
Average Daily Rate (ADR) Trend by Month in Bordeaux
Get Live Bordeaux Market Intelligence 👇

Explore Real-time Analytics
Airbnb Seasonality Analysis & Trends in Bordeaux (2025)
Peak Season (May, June, September)
- Revenue averages $2,738 per month
- Occupancy rates average 54.5%
- Daily rates average $126
Shoulder Season
- Revenue averages $2,348 per month
- Occupancy maintains around 51.6%
- Daily rates hold near $130
Low Season (January, February, March)
- Revenue drops to average $1,532 per month
- Occupancy decreases to average 39.6%
- Daily rates adjust to average $132
Seasonality Insights for Bordeaux
- The Airbnb seasonality in Bordeaux shows moderate seasonality with distinct peak and low periods. While the sections above show seasonal averages, it's also insightful to look at the extremes:
- During the high season, the absolute peak month showcases Bordeaux's highest earning potential, with monthly revenues capable of climbing to $2,890, occupancy reaching a high of 61.2%, and ADRs peaking at $137.
- Conversely, the slowest single month of the year, typically falling within the low season, marks the market's lowest point. In this month, revenue might dip to $1,480, occupancy could drop to 37.1%, and ADRs may adjust down to $125.
- Understanding both the seasonal averages and these monthly peaks and troughs in revenue, occupancy, and ADR is crucial for maximizing your Airbnb profit potential in Bordeaux.
Seasonal Strategies for Maximizing Profit
- Peak Season: Maximize revenue through premium pricing and potentially longer minimum stays. Ensure high availability.
- Low Season: Offer competitive pricing, special promotions (e.g., extended stay discounts), and flexible cancellation policies. Target off-season travelers like remote workers or budget-conscious guests.
- Shoulder Seasons: Implement dynamic pricing that balances peak and low rates. Target weekend travelers or specific events. Offer slightly more flexible terms than peak season.
- Regularly analyze your own performance against these Bordeaux seasonality benchmarks and adjust your pricing and availability strategy accordingly.
Best Areas for Airbnb Investment in Bordeaux (2025)
Exploring the top neighborhoods for short-term rentals in Bordeaux? This section highlights key areas, outlining why they are attractive for hosts and guests, along with notable local attractions. Consider these locations based on your target guest profile and investment strategy.
| Neighborhood / Area | Why Host Here? (Target Guests & Appeal) | Key Attractions & Landmarks |
|---|---|---|
| Place des Quinconces | A central square surrounded by stunning architecture and cultural landmarks. This area is perfect for tourists wanting to experience the heart of Bordeaux with easy access to major attractions. | La Monument aux Girondins, Jardin de l'Intendance, L'Opéra National de Bordeaux, Cité du Vin, Bordeaux's tramway |
| Saint-Pierre | The historical center of Bordeaux with cobblestone streets, charming boutiques, and excellent restaurants. Ideal for visitors looking for a vibrant atmosphere and rich history. | Place du Parlement, Église Saint-Pierre, Rue Sainte-Catherine, The Garonne River, Les Halles de Bacalan |
| Chartrons | A trendy neighborhood known for its antique shops, art galleries, and cafes. Attracts art lovers and those looking to soak in Bordeaux's creative vibe. | Musée des Beaux-Arts de Bordeaux, Antique shops, Quais de Bordeaux, Cafes and wine bars, Les Halles de Bordeaux |
| Les Chartrons | An area with a mix of old Bordeaux charm and modern developments. Great for those who want a quieter stay while still being close to the city center. | Parc Bordelais, Rue Notre-Dame, La Cité du Vin, Wine cellars, Quayside walks |
| Mériadeck | A modern business district that offers a mix of residential and business spaces. Suitable for business travelers and those looking for convenience and connectivity. | Palais des Congrès, Shopping center, Public transportation access, Nearby parks, Cultural venues |
| Gambetta | A lively area filled with shops, cafes, and nightlife. Attractive to younger visitors and those seeking a vibrant community spirit. | Place Gambetta, Shopping streets, Restaurants and bars, Cultural events, Tramway access |
| Belcier | Known for its proximity to the railway station, this area is great for travelers looking to explore Bordeaux and beyond. Offers convenient access to transport links. | Gare Saint-Jean, Les Bassins à Flot, Waterfront activities, Local markets, Nearby parks |
| Bordeaux Lac | A contemporary district with large parks and the beautiful lake. Perfect for families and those who enjoy outdoor activities. | Parc Floral, Bordeaux-Lac Golf Club, Wakepark Bordeaux, Nearby shopping centers, Cycling paths |
Understanding Airbnb License Requirements & STR Laws in Bordeaux (2025)
Yes, Bordeaux, Nouvelle-Aquitaine, France enforces high STR regulations. Obtaining a license and ensuring compliance is almost certainly required according to current 2025 STR laws. Always verify the latest short term rental regulations and Airbnb license requirements directly with local government authorities for Bordeaux to ensure full compliance before hosting.
(Source: AirROI data, 2025, based on 68% licensed listings)
Top Performing Airbnb Properties in Bordeaux (2025)
Benchmark your potential! Explore examples of top-performing Airbnb properties in Bordeauxbased on Trailing Twelve Month (TTM) revenue. Analyze their characteristics, revenue, occupancy rate, and ADR to understand what drives success in this market.

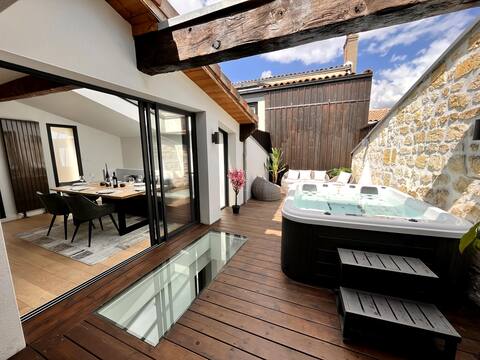
Big House with Jacuzzi Bordeaux
Entire Place • 4 bedrooms

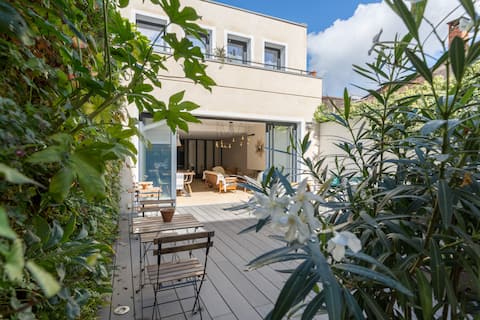
Chartrons family home 250m2 garden/ pool
Entire Place • 4 bedrooms
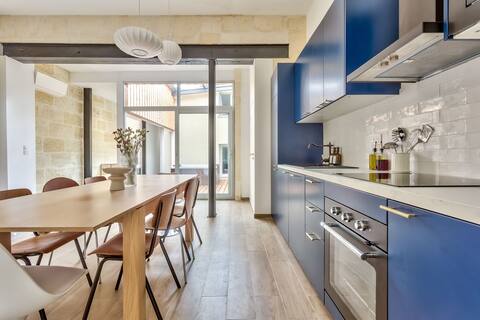
Splendide Chai 700 m2 Bordeaux
Entire Place • 6 bedrooms
Villa Rousseau - Jacuzzi and Cinema in Bordeaux
Entire Place • 3 bedrooms
Guesthouse, terrace & jacuzzi in the heart of the city
Entire Place • 5 bedrooms
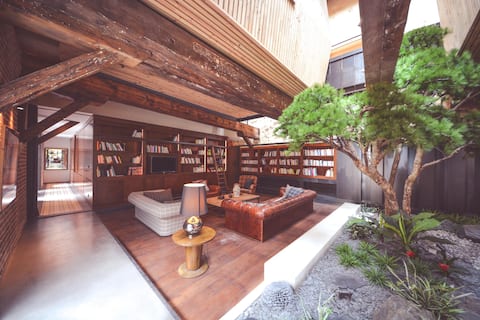
Nocnoc l'Oly - 9 BR, up to 20 PAX, 2 flats + spa
Entire Place • 9 bedrooms
Note: Performance varies based on location, size, amenities, seasonality, and management quality. Data reflects the past 12 months.
Top Performing Airbnb Hosts in Bordeaux (2025)
Learn from the best! This table showcases top-performing Airbnb hosts in Bordeaux based on the number of properties managed and estimated total revenue over the past year. Analyze their scale and performance metrics.
| Host Name | Properties | Grossing Revenue | Stay Reviews | Avg Rating |
|---|---|---|---|---|
| Agence COCOONR / BOOK&PAY | 46 | $1,277,367 | 825 | 3.84/5.0 |
| Guillaume | 21 | $1,030,883 | 888 | 4.53/5.0 |
| Julie | 30 | $994,711 | 3870 | 4.74/5.0 |
| Alfred | 32 | $790,448 | 1690 | 3.98/5.0 |
| Emilie | 25 | $659,035 | 1640 | 4.19/5.0 |
| Nicolas | 20 | $634,198 | 1236 | 4.02/5.0 |
| Pauline & Alison | 10 | $627,425 | 693 | 4.81/5.0 |
| Guillaume | 7 | $443,149 | 108 | 4.09/5.0 |
| Antoine Bugeaud | 15 | $442,176 | 3735 | 4.79/5.0 |
| Patricia | 11 | $439,648 | 921 | 4.75/5.0 |
Analyzing the strategies of top hosts, such as their property selection, pricing, and guest communication, can offer valuable lessons for optimizing your own Airbnb operations in Bordeaux.
Dive Deeper: Advanced Bordeaux STR Market Data (2025)
Ready to unlock more insights? AirROI provides access to advanced metrics and comprehensive Airbnb data for Bordeaux. Explore detailed analytics beyond this report to refine your investment strategy, optimize pricing, and maximize your vacation rental profits.
Explore Advanced MetricsBordeaux Short-Term Rental Market Composition (2025): Property & Room Types
Room Type Distribution
Property Type Distribution
Market Composition Insights for Bordeaux
- The Bordeaux Airbnb market composition is heavily skewed towards Entire Home/Apt listings, which make up 81.1% of the 3,407 active rentals. This indicates strong guest preference for privacy and space.
- Looking at the property type distribution in Bordeaux, Apartment/Condo properties are the most common (72.1%), reflecting the local real estate landscape.
- Houses represent a significant 20.8% portion, catering likely to families or larger groups.
- The presence of 6% Hotel/Boutique listings indicates integration with traditional hospitality.
- Smaller segments like others, outdoor/unique (combined 1.0%) offer potential for unique stay experiences.
Bordeaux Airbnb Room Capacity Analysis (2025): Bedroom Distribution
Distribution of Listings by Number of Bedrooms
Room Capacity Insights for Bordeaux
- The dominant room capacity in Bordeaux is 1 bedroom listings, making up 46% of the market. This suggests a strong demand for properties suitable for couples or solo travelers.
- Together, 1 bedroom and 2 bedrooms properties represent 66.3% of the active Airbnb listings in Bordeaux, indicating a high concentration in these sizes.
Bordeaux Vacation Rental Guest Capacity Trends (2025)
Distribution of Listings by Guest Capacity
Guest Capacity Insights for Bordeaux
- The most common guest capacity trend in Bordeaux vacation rentals is listings accommodating 2 guests (35.9%). This suggests the primary traveler segment is likely couples or solo travelers.
- Properties designed for 2 guests and 4 guests dominate the Bordeaux STR market, accounting for 61.8% of listings.
- 16.2% of properties accommodate 6+ guests, serving the market segment for larger families or group travel in Bordeaux.
- On average, properties in Bordeaux are equipped to host 3.2 guests.
Bordeaux Airbnb Booking Patterns (2025): Available vs. Booked Days
Available Days Distribution
Booked Days Distribution
Booking Pattern Insights for Bordeaux
- The most common availability pattern in Bordeaux falls within the 271-366 days range, representing 34.6% of listings. This suggests many properties have significant open periods on their calendars.
- Approximately 65.3% of listings show high availability (181+ days open annually), indicating potential for increased bookings or specific owner usage patterns.
- For booked days, the 91-180 days range is most frequent in Bordeaux (31.3%), reflecting common guest stay durations or potential owner blocking patterns.
- A notable 35.8% of properties secure long booking periods (181+ days booked per year), highlighting successful long-term rental strategies or significant owner usage.
Bordeaux Airbnb Minimum Stay Requirements Analysis
Distribution of Listings by Minimum Night Requirement
1 Night
713 listings
23.1% of total
2 Nights
1068 listings
34.6% of total
3 Nights
407 listings
13.2% of total
4-6 Nights
249 listings
8.1% of total
7-29 Nights
96 listings
3.1% of total
30+ Nights
555 listings
18% of total
Key Insights
- The most prevalent minimum stay requirement in Bordeaux is 2 Nights, adopted by 34.6% of listings. This highlights the market's preference for shorter, flexible bookings.
- A significant segment (18%) caters to monthly stays (30+ nights) in Bordeaux, pointing to opportunities in the extended-stay market.
Recommendations
- Align with the market by considering a 2 Nights minimum stay, as 34.6% of Bordeaux hosts use this setting.
- If feasible, allowing 1-night stays, especially midweek or during low season, could capture last-minute bookings, as only 23.1% currently do.
- Explore offering discounts for stays of 30+ nights to attract the 18% of the market seeking extended stays.
- Adjust minimum nights based on seasonality – potentially shorter during low season and longer during peak demand periods in Bordeaux.
Bordeaux Airbnb Cancellation Policy Trends Analysis (2025)
Refundable
5 listings
0.2% of total
Super Strict 30 Days
23 listings
0.8% of total
Non-refundable
1 listings
0% of total
Super Strict 60 Days
7 listings
0.2% of total
Flexible
730 listings
25.5% of total
Moderate
1073 listings
37.5% of total
Firm
478 listings
16.7% of total
Strict
544 listings
19% of total
Cancellation Policy Insights for Bordeaux
- The prevailing Airbnb cancellation policy trend in Bordeaux is Moderate, used by 37.5% of listings.
- There's a relatively balanced mix between guest-friendly (63.0%) and stricter (35.7%) policies, offering choices for different guest needs.
Recommendations for Hosts
- Consider adopting a Moderate policy to align with the 37.5% market standard in Bordeaux.
- Regularly review your cancellation policy against competitors and market demand shifts in Bordeaux.
Bordeaux STR Booking Lead Time Analysis (2025)
Average Booking Lead Time by Month
Booking Lead Time Insights for Bordeaux
- The overall average booking lead time for vacation rentals in Bordeaux is 49 days.
- Guests book furthest in advance for stays during June (average 80 days), likely coinciding with peak travel demand or local events.
- The shortest booking windows occur for stays in February (average 37 days), indicating more last-minute travel plans during this time.
- Seasonally, Summer (68 days avg.) sees the longest lead times, while Winter (40 days avg.) has the shortest, reflecting typical travel planning cycles.
Recommendations for Hosts
- Use the overall average lead time (49 days) as a baseline for your pricing and availability strategy in Bordeaux.
- For June stays, consider implementing length-of-stay discounts or slightly higher rates for bookings made less than 80 days out to capitalize on advance planning.
- Target marketing efforts for the Summer season well in advance (at least 68 days) to capture early planners.
- Monitor your own booking lead times against these Bordeaux averages to identify opportunities for dynamic pricing adjustments.
Popular & Essential Airbnb Amenities in Bordeaux (2025)
Amenity Prevalence
Amenity Insights for Bordeaux
- Essential amenities in Bordeaux that guests expect include: Wifi. Lacking these (this) could significantly impact bookings.
- Popular amenities like Heating, Kitchen, Hot water are common but not universal. Offering these can provide a competitive edge.
Recommendations for Hosts
- Ensure your listing includes all essential amenities for Bordeaux: Wifi.
- Prioritize adding missing essentials: Wifi.
- Consider adding popular differentiators like Heating or Kitchen to increase appeal.
- Highlight unique or less common amenities you offer (e.g., hot tub, dedicated workspace, EV charger) in your listing description and photos.
- Regularly check competitor amenities in Bordeaux to stay competitive.
Bordeaux Airbnb Guest Demographics & Profile Analysis (2025)
Guest Profile Summary for Bordeaux
- The typical guest profile for Airbnb in Bordeaux consists of a mix of domestic (51%) and international guests, often arriving from nearby Paris, typically belonging to the Post-2000s (Gen Z/Alpha) group (50%), primarily speaking English or French.
- Domestic travelers account for 50.7% of guests.
- Key international markets include France (50.7%) and United Kingdom (10.5%).
- Top languages spoken are English (39%) followed by French (30.6%).
- A significant demographic segment is the Post-2000s (Gen Z/Alpha) group, representing 50% of guests.
Recommendations for Hosts
- Balance marketing efforts between domestic and international channels based on the guest mix.
- Tailor amenities and listing descriptions to appeal to the dominant Post-2000s (Gen Z/Alpha) demographic (e.g., highlight fast WiFi, smart home features, local guides).
- Highlight unique local experiences or amenities relevant to the primary guest profile.
- Consider seasonal promotions aligned with peak travel times for key origin markets.
Nearby Short-Term Rental Market Comparison
How does the Bordeaux Airbnb market stack up against its neighbors? Compare key performance metrics like average monthly revenue, ADR, and occupancy rates in surrounding areas to understand the broader regional STR landscape.
| Market | Active Properties | Monthly Revenue | Daily Rate | Avg. Occupancy |
|---|---|---|---|---|
| San Sebastián | 1,426 | $3,546 | $262.81 | 49% |
| Saint-Laurent-des-Combes | 11 | $3,526 | $706.18 | 23% |
| Astaffort | 10 | $3,393 | $314.20 | 35% |
| Cénac | 18 | $2,773 | $268.58 | 53% |
| Cérons | 11 | $2,635 | $196.16 | 39% |
| Galgon | 12 | $2,599 | $210.34 | 48% |
| Hernani | 11 | $2,572 | $345.16 | 40% |
| Eynesse | 14 | $2,564 | $282.87 | 36% |
| Bourrou | 10 | $2,475 | $247.57 | 36% |
| Saint-Hippolyte | 10 | $2,443 | $204.98 | 44% |