Bonnes Airbnb Market Analysis 2025: Short Term Rental Data & Vacation Rental Statistics in Nouvelle-Aquitaine, France
Is Airbnb profitable in Bonnes in 2025? Explore comprehensive Airbnb analytics for Bonnes, Nouvelle-Aquitaine, France to uncover income potential. This 2025 STR market report for Bonnes, based on AirROI data from April 2024 to March 2025, reveals key trends in the niche market of 26 active listings.
Whether you're considering an Airbnb investment in Bonnes, optimizing your existing vacation rental, or exploring rental arbitrage opportunities, understanding the Bonnes Airbnb data is crucial. Understanding the local regulations is key to maximizing your short term rental income potential. Let's dive into the specifics.
Key Bonnes Airbnb Performance Metrics Overview
Monthly Airbnb Revenue Variations & Income Potential in Bonnes (2025)
Understanding the monthly revenue variations for Airbnb listings in Bonnes is key to maximizing your short term rental income potential. Seasonality significantly impacts earnings. Our analysis, based on data from the past 12 months, shows that the peak revenue month for STRs in Bonnes is typically August, while February often presents the lowest earnings, highlighting opportunities for strategic pricing adjustments during shoulder and low seasons. Explore the typical Airbnb income in Bonnes across different performance tiers:
- Best-in-class properties (Top 10%) achieve $5,465+ monthly, often utilizing dynamic pricing and superior guest experiences.
- Strong performing properties (Top 25%) earn $2,800 or more, indicating effective management and desirable locations/amenities.
- Typical properties (Median) generate around $1,173 per month, representing the average market performance.
- Entry-level properties (Bottom 25%) see earnings around $534, often with potential for optimization.
Average Monthly Airbnb Earnings Trend in Bonnes
Bonnes Airbnb Occupancy Rate Trends (2025)
Maximize your bookings by understanding the Bonnes STR occupancy trends. Seasonal demand shifts significantly influence how often properties are booked. Typically, Augustsees the highest demand (peak season occupancy), while April experiences the lowest (low season). Effective strategies, like adjusting minimum stays or offering promotions, can boost occupancy during slower periods. Here's how different property tiers perform in Bonnes:
- Best-in-class properties (Top 10%) achieve 64%+ occupancy, indicating high desirability and potentially optimized availability.
- Strong performing properties (Top 25%) maintain 47% or higher occupancy, suggesting good market fit and guest satisfaction.
- Typical properties (Median) have an occupancy rate around 29%.
- Entry-level properties (Bottom 25%) average 13% occupancy, potentially facing higher vacancy.
Average Monthly Occupancy Rate Trend in Bonnes
Average Daily Rate (ADR) Airbnb Trends in Bonnes (2025)
Effective short term rental pricing strategy in Bonnes involves understanding monthly ADR fluctuations. The Average Daily Rate (ADR) for Airbnb in Bonnes typically peaks in January and dips lowest during October. Leveraging Airbnb dynamic pricing tools or strategies based on this seasonality can significantly boost revenue. Here's a look at the typical nightly rates achieved:
- Best-in-class properties (Top 10%) command rates of $321+ per night, often due to premium features or locations.
- Strong performing properties (Top 25%) achieve nightly rates of $244 or more.
- Typical properties (Median) charge around $120 per night.
- Entry-level properties (Bottom 25%) earn around $87 per night.
Average Daily Rate (ADR) Trend by Month in Bonnes
Get Live Bonnes Market Intelligence 👇

Explore Real-time Analytics
Airbnb Seasonality Analysis & Trends in Bonnes (2025)
Peak Season (August, July, June)
- Revenue averages $3,746 per month
- Occupancy rates average 48.9%
- Daily rates average $167
Shoulder Season
- Revenue averages $1,702 per month
- Occupancy maintains around 30.0%
- Daily rates hold near $165
Low Season (February, March, November)
- Revenue drops to average $777 per month
- Occupancy decreases to average 23.9%
- Daily rates adjust to average $174
Seasonality Insights for Bonnes
- The Airbnb seasonality in Bonnes shows highly seasonal trends requiring careful strategy. While the sections above show seasonal averages, it's also insightful to look at the extremes:
- During the high season, the absolute peak month showcases Bonnes's highest earning potential, with monthly revenues capable of climbing to $4,344, occupancy reaching a high of 63.9%, and ADRs peaking at $182.
- Conversely, the slowest single month of the year, typically falling within the low season, marks the market's lowest point. In this month, revenue might dip to $627, occupancy could drop to 11.5%, and ADRs may adjust down to $155.
- Understanding both the seasonal averages and these monthly peaks and troughs in revenue, occupancy, and ADR is crucial for maximizing your Airbnb profit potential in Bonnes.
Seasonal Strategies for Maximizing Profit
- Peak Season: Maximize revenue through premium pricing and potentially longer minimum stays. Ensure high availability.
- Low Season: Offer competitive pricing, special promotions (e.g., extended stay discounts), and flexible cancellation policies. Target off-season travelers like remote workers or budget-conscious guests.
- Shoulder Seasons: Implement dynamic pricing that balances peak and low rates. Target weekend travelers or specific events. Offer slightly more flexible terms than peak season.
- Regularly analyze your own performance against these Bonnes seasonality benchmarks and adjust your pricing and availability strategy accordingly.
Best Areas for Airbnb Investment in Bonnes (2025)
Exploring the top neighborhoods for short-term rentals in Bonnes? This section highlights key areas, outlining why they are attractive for hosts and guests, along with notable local attractions. Consider these locations based on your target guest profile and investment strategy.
| Neighborhood / Area | Why Host Here? (Target Guests & Appeal) | Key Attractions & Landmarks |
|---|---|---|
| Biarritz | Biarritz is a stunning coastal town known for its beautiful beaches, surfing culture, and vibrant nightlife. It's popular among tourists seeking both relaxation and adventure. | Grande Plage, Cité de l'Océan, Rocher de la Vierge, Biarritz Lighthouse, Aquarium de Biarritz |
| La Rochelle | La Rochelle is a charming port city with a rich maritime history, beautiful architecture, and a vibrant atmosphere. It's ideal for visitors who enjoy history and culture. | Old Port, Towers of La Rochelle, Lighthouse of the Chassiron, La Rochelle Aquarium, Musee des Comores |
| Saint-Émilion | Famous for its vineyards and wine production, Saint-Émilion attracts wine enthusiasts and tourists looking for a picturesque village with stunning vineyards. | Saint-Émilion Monolithic Church, Wine estates, King's Tower, Monolithic Church, Underground Catacombs |
| Périgueux | Périgueux is known for its rich history and Roman architecture, making it great for history buffs and travelers who appreciate culture and gastronomy. | Périgueux Cathedral, Vesunna Gallo-Roman Museum, L'Isle River, Périgueux market, Historical center |
| Arcachon | Arcachon is a popular seaside resort known for its beautiful beaches and the nearby Dune du Pilat, perfect for those who love nature and beach activities. | Dune du Pilat, Arcachon Bay, Bird Island, Arcachon Aquarium, Winter Town |
| Angoulême | Renowned for its comic art and festival, Angoulême offers a unique cultural experience along with its historical sites, attracting a variety of tourists. | Cité de la Bande Dessinée, Angoulême Cathedral, Riverside Promenade, Museum of Angoulême, Film Festival |
| Niort | Niort is an under-the-radar destination with charming architecture and history, perfect for travelers looking for a quiet place with authentic experiences. | Niort Castle, Donjon de Niort, Maraîchines Museum, Brioux-sur-Boutonne Museum, Local markets |
| Cognac | Famous for its brandy, Cognac is a delightful town with beautiful vineyards, great for wine lovers and those interested in gourmet experiences. | Cognac houses, Cognac Museum, The River Charente, Martell Cognac Museum, Historic center |
Understanding Airbnb License Requirements & STR Laws in Bonnes (2025)
With 12% of listings showing registration in 2025, understanding potential Airbnb license requirements is crucial in Bonnes. Always verify the latest short term rental regulations and Airbnb license requirements directly with local government authorities for Bonnes to ensure full compliance before hosting.
(Source: AirROI data, 2025, based on 12% licensed listings)
Top Performing Airbnb Properties in Bonnes (2025)
Benchmark your potential! Explore examples of top-performing Airbnb properties in Bonnesbased on Trailing Twelve Month (TTM) revenue. Analyze their characteristics, revenue, occupancy rate, and ADR to understand what drives success in this market.
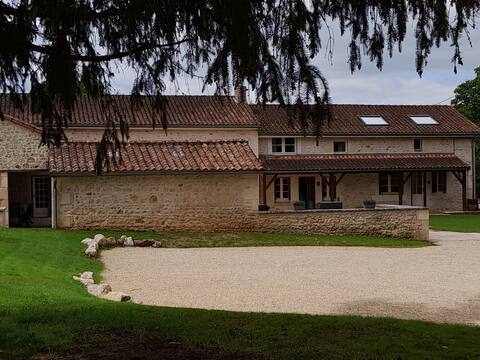
Spacious Barn Conversion
Entire Place • 6 bedrooms
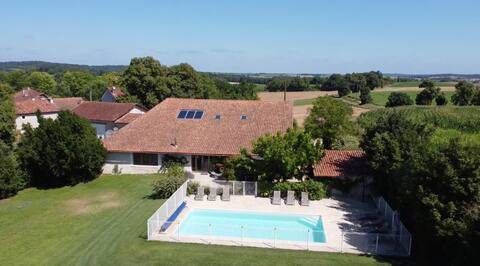
Fabulous Bonnes house with pool
Entire Place • 6 bedrooms
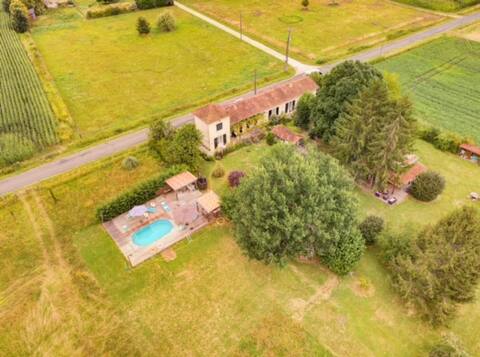
Sleeps 13/15. 270 m2 house with pool
Entire Place • 5 bedrooms
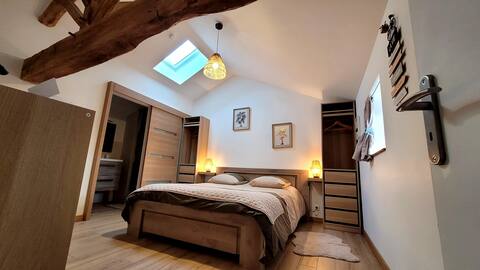
L'Etape des Vigealieres: 3 bedroom cottage
Entire Place • 3 bedrooms
Home with private pool near Aubeterre- sur -Dronne
Entire Place • 4 bedrooms

Rural French idyll next to the river
Entire Place • 4 bedrooms
Note: Performance varies based on location, size, amenities, seasonality, and management quality. Data reflects the past 12 months.
Top Performing Airbnb Hosts in Bonnes (2025)
Learn from the best! This table showcases top-performing Airbnb hosts in Bonnes based on the number of properties managed and estimated total revenue over the past year. Analyze their scale and performance metrics.
| Host Name | Properties | Grossing Revenue | Stay Reviews | Avg Rating |
|---|---|---|---|---|
| Michele | 1 | $57,973 | 8 | 5.00/5.0 |
| Vicky | 1 | $54,395 | 8 | 4.50/5.0 |
| Sandrine Et Fabrice | 1 | $52,027 | 38 | 4.97/5.0 |
| Celine | 2 | $42,625 | 60 | 4.95/5.0 |
| Deborah | 1 | $30,114 | 5 | 5.00/5.0 |
| Lena | 1 | $21,702 | 16 | 4.75/5.0 |
| Alexandre | 2 | $21,241 | 19 | 5.00/5.0 |
| Edouard Et Justine | 1 | $19,324 | 97 | 4.96/5.0 |
| Aline | 1 | $18,743 | 23 | 4.52/5.0 |
| Didier | 1 | $16,609 | 93 | 4.68/5.0 |
Analyzing the strategies of top hosts, such as their property selection, pricing, and guest communication, can offer valuable lessons for optimizing your own Airbnb operations in Bonnes.
Dive Deeper: Advanced Bonnes STR Market Data (2025)
Ready to unlock more insights? AirROI provides access to advanced metrics and comprehensive Airbnb data for Bonnes. Explore detailed analytics beyond this report to refine your investment strategy, optimize pricing, and maximize your vacation rental profits.
Explore Advanced MetricsBonnes Short-Term Rental Market Composition (2025): Property & Room Types
Room Type Distribution
Property Type Distribution
Market Composition Insights for Bonnes
- The Bonnes Airbnb market composition is heavily skewed towards Entire Home/Apt listings, which make up 84.6% of the 26 active rentals. This indicates strong guest preference for privacy and space.
- Looking at the property type distribution in Bonnes, House properties are the most common (73.1%), reflecting the local real estate landscape.
- Houses represent a significant 73.1% portion, catering likely to families or larger groups.
- Smaller segments like hotel/boutique, apartment/condo (combined 7.6%) offer potential for unique stay experiences.
Bonnes Airbnb Room Capacity Analysis (2025): Bedroom Distribution
Distribution of Listings by Number of Bedrooms
Room Capacity Insights for Bonnes
- The dominant room capacity in Bonnes is 3 bedrooms listings, making up 23.1% of the market. This suggests a strong demand for properties suitable for families or small groups.
- Together, 3 bedrooms and 4 bedrooms properties represent 46.2% of the active Airbnb listings in Bonnes, indicating a high concentration in these sizes.
- A significant 69.3% of listings offer 3+ bedrooms, catering to larger groups and families seeking more space in Bonnes.
Bonnes Vacation Rental Guest Capacity Trends (2025)
Distribution of Listings by Guest Capacity
Guest Capacity Insights for Bonnes
- The most common guest capacity trend in Bonnes vacation rentals is listings accommodating 8+ guests (46.2%). This suggests the primary traveler segment is likely larger groups.
- Properties designed for 8+ guests and 6 guests dominate the Bonnes STR market, accounting for 69.3% of listings.
- 73.1% of properties accommodate 6+ guests, serving the market segment for larger families or group travel in Bonnes.
- On average, properties in Bonnes are equipped to host 5.7 guests.
Bonnes Airbnb Booking Patterns (2025): Available vs. Booked Days
Available Days Distribution
Booked Days Distribution
Booking Pattern Insights for Bonnes
- The most common availability pattern in Bonnes falls within the 271-366 days range, representing 53.8% of listings. This suggests many properties have significant open periods on their calendars.
- Approximately 92.3% of listings show high availability (181+ days open annually), indicating potential for increased bookings or specific owner usage patterns.
- For booked days, the 91-180 days range is most frequent in Bonnes (42.3%), reflecting common guest stay durations or potential owner blocking patterns.
- A notable 11.5% of properties secure long booking periods (181+ days booked per year), highlighting successful long-term rental strategies or significant owner usage.
Bonnes Airbnb Minimum Stay Requirements Analysis
Distribution of Listings by Minimum Night Requirement
1 Night
9 listings
34.6% of total
2 Nights
5 listings
19.2% of total
3 Nights
2 listings
7.7% of total
4-6 Nights
4 listings
15.4% of total
7-29 Nights
5 listings
19.2% of total
30+ Nights
1 listings
3.8% of total
Key Insights
- The most prevalent minimum stay requirement in Bonnes is 1 Night, adopted by 34.6% of listings. This highlights the market's preference for shorter, flexible bookings.
Recommendations
- Align with the market by considering a 1 Night minimum stay, as 34.6% of Bonnes hosts use this setting.
- Adjust minimum nights based on seasonality – potentially shorter during low season and longer during peak demand periods in Bonnes.
Bonnes Airbnb Cancellation Policy Trends Analysis (2025)
Flexible
7 listings
30.4% of total
Moderate
5 listings
21.7% of total
Firm
4 listings
17.4% of total
Strict
7 listings
30.4% of total
Cancellation Policy Insights for Bonnes
- The prevailing Airbnb cancellation policy trend in Bonnes is Flexible, used by 30.4% of listings.
- There's a relatively balanced mix between guest-friendly (52.1%) and stricter (47.8%) policies, offering choices for different guest needs.
Recommendations for Hosts
- Consider adopting a Flexible policy to align with the 30.4% market standard in Bonnes.
- With 30.4% using Strict terms, this is a viable option in Bonnes, particularly for high-value properties or during peak demand periods.
- Regularly review your cancellation policy against competitors and market demand shifts in Bonnes.
Bonnes STR Booking Lead Time Analysis (2025)
Average Booking Lead Time by Month
Booking Lead Time Insights for Bonnes
- The overall average booking lead time for vacation rentals in Bonnes is 59 days.
- Guests book furthest in advance for stays during July (average 110 days), likely coinciding with peak travel demand or local events.
- The shortest booking windows occur for stays in January (average 19 days), indicating more last-minute travel plans during this time.
- Seasonally, Summer (91 days avg.) sees the longest lead times, while Winter (39 days avg.) has the shortest, reflecting typical travel planning cycles.
Recommendations for Hosts
- Use the overall average lead time (59 days) as a baseline for your pricing and availability strategy in Bonnes.
- For July stays, consider implementing length-of-stay discounts or slightly higher rates for bookings made less than 110 days out to capitalize on advance planning.
- Target marketing efforts for the Summer season well in advance (at least 91 days) to capture early planners.
- Monitor your own booking lead times against these Bonnes averages to identify opportunities for dynamic pricing adjustments.
Popular & Essential Airbnb Amenities in Bonnes (2025)
Amenity Prevalence
Amenity Insights for Bonnes
- Essential amenities in Bonnes that guests expect include: Free parking on premises. Lacking these (this) could significantly impact bookings.
- Popular amenities like Smoke alarm, Hot water, Wifi are common but not universal. Offering these can provide a competitive edge.
- Warning: Wifi is not universally provided but is considered essential globally. Ensure reliable Wifi is offered.
Recommendations for Hosts
- Ensure your listing includes all essential amenities for Bonnes: Free parking on premises.
- Prioritize adding missing essentials: Free parking on premises.
- Consider adding popular differentiators like Smoke alarm or Hot water to increase appeal.
- Highlight unique or less common amenities you offer (e.g., hot tub, dedicated workspace, EV charger) in your listing description and photos.
- Regularly check competitor amenities in Bonnes to stay competitive.
Bonnes Airbnb Guest Demographics & Profile Analysis (2025)
Guest Profile Summary for Bonnes
- The typical guest profile for Airbnb in Bonnes consists of primarily domestic travelers (78%), often arriving from nearby Paris, typically belonging to the Post-2000s (Gen Z/Alpha) group (50%), primarily speaking French or English.
- Domestic travelers account for 78.0% of guests.
- Key international markets include France (78%) and United Kingdom (11.6%).
- Top languages spoken are French (46.7%) followed by English (35.8%).
- A significant demographic segment is the Post-2000s (Gen Z/Alpha) group, representing 50% of guests.
Recommendations for Hosts
- Target domestic marketing efforts towards travelers from Paris and London.
- Tailor amenities and listing descriptions to appeal to the dominant Post-2000s (Gen Z/Alpha) demographic (e.g., highlight fast WiFi, smart home features, local guides).
- Highlight unique local experiences or amenities relevant to the primary guest profile.
- Consider seasonal promotions aligned with peak travel times for key origin markets.
Nearby Short-Term Rental Market Comparison
How does the Bonnes Airbnb market stack up against its neighbors? Compare key performance metrics like average monthly revenue, ADR, and occupancy rates in surrounding areas to understand the broader regional STR landscape.
| Market | Active Properties | Monthly Revenue | Daily Rate | Avg. Occupancy |
|---|---|---|---|---|
| Saint-Laurent-des-Combes | 11 | $3,526 | $706.18 | 23% |
| Astaffort | 10 | $3,393 | $314.20 | 35% |
| Cénac | 18 | $2,773 | $268.58 | 53% |
| Bourneau | 11 | $2,747 | $442.07 | 35% |
| Nuaillé-d'Aunis | 10 | $2,741 | $373.83 | 37% |
| Cérons | 11 | $2,635 | $196.16 | 39% |
| Galgon | 12 | $2,599 | $210.34 | 48% |
| Eynesse | 14 | $2,564 | $282.87 | 36% |
| Le Grand-Pressigny | 11 | $2,511 | $266.72 | 31% |
| Bourrou | 10 | $2,475 | $247.57 | 36% |