Biron Airbnb Market Analysis 2025: Short Term Rental Data & Vacation Rental Statistics in Nouvelle-Aquitaine, France
Is Airbnb profitable in Biron in 2025? Explore comprehensive Airbnb analytics for Biron, Nouvelle-Aquitaine, France to uncover income potential. This 2025 STR market report for Biron, based on AirROI data from April 2024 to March 2025, reveals key trends in the niche market of 18 active listings.
Whether you're considering an Airbnb investment in Biron, optimizing your existing vacation rental, or exploring rental arbitrage opportunities, understanding the Biron Airbnb data is crucial. Leveraging the low regulation environment is key to maximizing your short term rental income potential. Let's dive into the specifics.
Key Biron Airbnb Performance Metrics Overview
Monthly Airbnb Revenue Variations & Income Potential in Biron (2025)
Understanding the monthly revenue variations for Airbnb listings in Biron is key to maximizing your short term rental income potential. Seasonality significantly impacts earnings. Our analysis, based on data from the past 12 months, shows that the peak revenue month for STRs in Biron is typically August, while February often presents the lowest earnings, highlighting opportunities for strategic pricing adjustments during shoulder and low seasons. Explore the typical Airbnb income in Biron across different performance tiers:
- Best-in-class properties (Top 10%) achieve $3,336+ monthly, often utilizing dynamic pricing and superior guest experiences.
- Strong performing properties (Top 25%) earn $2,218 or more, indicating effective management and desirable locations/amenities.
- Typical properties (Median) generate around $845 per month, representing the average market performance.
- Entry-level properties (Bottom 25%) see earnings around $531, often with potential for optimization.
Average Monthly Airbnb Earnings Trend in Biron
Biron Airbnb Occupancy Rate Trends (2025)
Maximize your bookings by understanding the Biron STR occupancy trends. Seasonal demand shifts significantly influence how often properties are booked. Typically, Augustsees the highest demand (peak season occupancy), while February experiences the lowest (low season). Effective strategies, like adjusting minimum stays or offering promotions, can boost occupancy during slower periods. Here's how different property tiers perform in Biron:
- Best-in-class properties (Top 10%) achieve 71%+ occupancy, indicating high desirability and potentially optimized availability.
- Strong performing properties (Top 25%) maintain 50% or higher occupancy, suggesting good market fit and guest satisfaction.
- Typical properties (Median) have an occupancy rate around 28%.
- Entry-level properties (Bottom 25%) average 15% occupancy, potentially facing higher vacancy.
Average Monthly Occupancy Rate Trend in Biron
Average Daily Rate (ADR) Airbnb Trends in Biron (2025)
Effective short term rental pricing strategy in Biron involves understanding monthly ADR fluctuations. The Average Daily Rate (ADR) for Airbnb in Biron typically peaks in July and dips lowest during February. Leveraging Airbnb dynamic pricing tools or strategies based on this seasonality can significantly boost revenue. Here's a look at the typical nightly rates achieved:
- Best-in-class properties (Top 10%) command rates of $285+ per night, often due to premium features or locations.
- Strong performing properties (Top 25%) achieve nightly rates of $184 or more.
- Typical properties (Median) charge around $136 per night.
- Entry-level properties (Bottom 25%) earn around $98 per night.
Average Daily Rate (ADR) Trend by Month in Biron
Get Live Biron Market Intelligence 👇

Explore Real-time Analytics
Airbnb Seasonality Analysis & Trends in Biron (2025)
Peak Season (August, July, September)
- Revenue averages $2,422 per month
- Occupancy rates average 54.2%
- Daily rates average $166
Shoulder Season
- Revenue averages $1,451 per month
- Occupancy maintains around 36.0%
- Daily rates hold near $156
Low Season (January, February, March)
- Revenue drops to average $503 per month
- Occupancy decreases to average 14.1%
- Daily rates adjust to average $145
Seasonality Insights for Biron
- The Airbnb seasonality in Biron shows highly seasonal trends requiring careful strategy. While the sections above show seasonal averages, it's also insightful to look at the extremes:
- During the high season, the absolute peak month showcases Biron's highest earning potential, with monthly revenues capable of climbing to $3,063, occupancy reaching a high of 65.8%, and ADRs peaking at $169.
- Conversely, the slowest single month of the year, typically falling within the low season, marks the market's lowest point. In this month, revenue might dip to $384, occupancy could drop to 8.3%, and ADRs may adjust down to $144.
- Understanding both the seasonal averages and these monthly peaks and troughs in revenue, occupancy, and ADR is crucial for maximizing your Airbnb profit potential in Biron.
Seasonal Strategies for Maximizing Profit
- Peak Season: Maximize revenue through premium pricing and potentially longer minimum stays. Ensure high availability.
- Low Season: Offer competitive pricing, special promotions (e.g., extended stay discounts), and flexible cancellation policies. Target off-season travelers like remote workers or budget-conscious guests.
- Shoulder Seasons: Implement dynamic pricing that balances peak and low rates. Target weekend travelers or specific events. Offer slightly more flexible terms than peak season.
- Regularly analyze your own performance against these Biron seasonality benchmarks and adjust your pricing and availability strategy accordingly.
Best Areas for Airbnb Investment in Biron (2025)
Exploring the top neighborhoods for short-term rentals in Biron? This section highlights key areas, outlining why they are attractive for hosts and guests, along with notable local attractions. Consider these locations based on your target guest profile and investment strategy.
| Neighborhood / Area | Why Host Here? (Target Guests & Appeal) | Key Attractions & Landmarks |
|---|---|---|
| Biron Village | Charming small village atmosphere with proximity to beautiful landscapes and local attractions. Ideal for travelers seeking a peaceful rural retreat along with modern amenities. | Château de Biron, Les Jardins de Marqueyssac, Le Parc Naturel Régional des Landes de Gascogne, Local vineyards, Biron's Sunday market |
| Sarlat-la-Canéda | Historical town known for its well-preserved medieval architecture and vibrant local markets. A popular destination for tourists exploring the Dordogne region. | Sarlat Market, La Cathedral Saint-Sacerdos, L'Abbaye Sainte-Marie, Jardins du Cadiot, The Great Casino of Sarlat |
| Laguiole | Renowned for its knife-making tradition and stunning rural landscapes, this quaint town attracts nature lovers and culinary enthusiasts alike. | Laguiole Knife Factory, Aubrac Regional Natural Park, Local cheese producers, Gourmet restaurants, Annual cheese festivals |
| Bergerac | Nestled in the heart of the Dordogne, Bergerac is famous for its wine production and charming riverside setting, appealing to wine lovers and leisurely tourists. | Château de Monbazillac, La Petite France, Bergerac Wine Tours, The Historical Museum, Scenic River Dordogne |
| Rocamadour | A stunning cliffside village known for its religious significance and breathtaking views, making it a key pilgrimage site and tourist destination. | Sanctuary of Rocamadour, Château de Rocamadour, The Great Stairs of Rocamadour, Monkey Forest, St. Sauveur Church |
| Toulouse | Dynamic urban center with a mix of history and modernity. Benefits from its status as a university city and offers diverse attractions for visitors. | Place du Capitole, Cité de l'Espace, Museum of Natural History, Garonne River waterfront, Airbus factory tours |
| Cahors | An ancient town located at the bend of the Lot River, famous for its medieval bridge and wine production, making it a delightful stop for tourists. | Pont Valentré, Cahors Wine Tastings, Félibre Museum, The Cathedral of Saint-Étienne, Historical old town |
| Périgueux | With its rich Roman history and gastronomic delights, P�érigueux combines cultural exploration with culinary experiences, attracting both history buffs and foodies. | Vesunna Gallo-Roman Museum, Cathedral of St. Front, Local truffle and foie gras markets, Périgueux Archaeological Museum, The old town's charm |
Understanding Airbnb License Requirements & STR Laws in Biron (2025)
While Biron, Nouvelle-Aquitaine, France currently shows low STR regulations, specific Airbnb license requirements might still exist or change. Always verify the latest short term rental regulations and Airbnb license requirements directly with local government authorities for Biron to ensure full compliance before hosting.
(Source: AirROI data, 2025, based on 6% licensed listings)
Top Performing Airbnb Properties in Biron (2025)
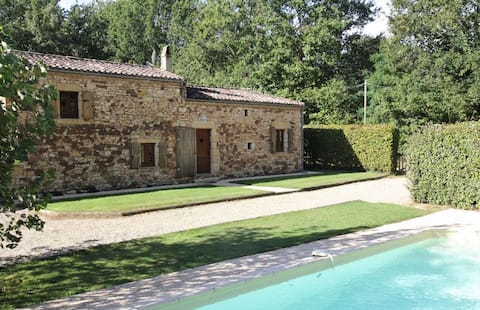
Benchmark your potential! Explore examples of top-performing Airbnb properties in Bironbased on Trailing Twelve Month (TTM) revenue. Analyze their characteristics, revenue, occupancy rate, and ADR to understand what drives success in this market.

Les gites de Vigne (le Four et la Grange)
Entire Place • 5 bedrooms
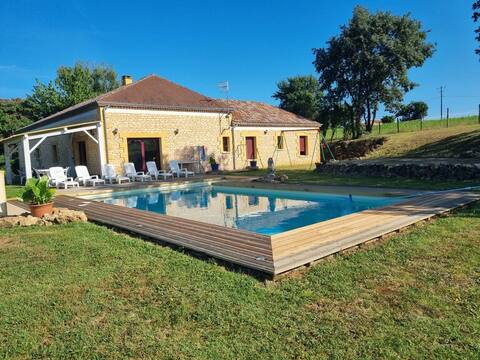
Le Mounard - Biron. House with heated pool
Entire Place • 2 bedrooms
hébergement biron dordogne .11 lits
Entire Place • 5 bedrooms
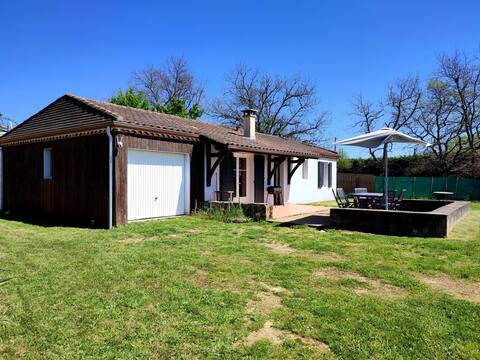
FULLY-EQUIPPED HOUSE WARM AND MODERN
Entire Place • 3 bedrooms

gite Jean de Bearn
Entire Place • 4 bedrooms
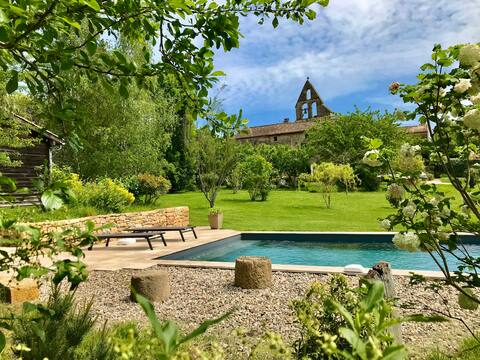
Maison Palissy charming gîte for 2 in Biron +pool!
Entire Place • 1 bedroom
Note: Performance varies based on location, size, amenities, seasonality, and management quality. Data reflects the past 12 months.
Top Performing Airbnb Hosts in Biron (2025)
Learn from the best! This table showcases top-performing Airbnb hosts in Biron based on the number of properties managed and estimated total revenue over the past year. Analyze their scale and performance metrics.
| Host Name | Properties | Grossing Revenue | Stay Reviews | Avg Rating |
|---|---|---|---|---|
| Viviane | 1 | $40,583 | 64 | 4.94/5.0 |
| Régis | 2 | $26,719 | 13 | 5.00/5.0 |
| Host #75726320 | 1 | $21,643 | 0 | 0.00/5.0 |
| Stéphanie | 3 | $16,731 | 12 | 1.57/5.0 |
| Natalie | 3 | $15,176 | 8 | 1.67/5.0 |
| Anne | 1 | $14,649 | 48 | 4.92/5.0 |
| Patrice | 1 | $12,825 | 54 | 4.76/5.0 |
| Helen | 1 | $9,437 | 17 | 5.00/5.0 |
| Laure | 1 | $8,133 | 68 | 4.88/5.0 |
| Noel | 1 | $6,906 | 9 | 4.11/5.0 |
Analyzing the strategies of top hosts, such as their property selection, pricing, and guest communication, can offer valuable lessons for optimizing your own Airbnb operations in Biron.
Dive Deeper: Advanced Biron STR Market Data (2025)
Ready to unlock more insights? AirROI provides access to advanced metrics and comprehensive Airbnb data for Biron. Explore detailed analytics beyond this report to refine your investment strategy, optimize pricing, and maximize your vacation rental profits.
Explore Advanced MetricsBiron Short-Term Rental Market Composition (2025): Property & Room Types
Room Type Distribution
Property Type Distribution
Market Composition Insights for Biron
- The Biron Airbnb market composition is heavily skewed towards Entire Home/Apt listings, which make up 100% of the 18 active rentals. This indicates strong guest preference for privacy and space.
- Looking at the property type distribution in Biron, House properties are the most common (77.8%), reflecting the local real estate landscape.
- Houses represent a significant 77.8% portion, catering likely to families or larger groups.
Biron Airbnb Room Capacity Analysis (2025): Bedroom Distribution
Distribution of Listings by Number of Bedrooms
Room Capacity Insights for Biron
- The dominant room capacity in Biron is 2 bedrooms listings, making up 38.9% of the market. This suggests a strong demand for properties suitable for couples or solo travelers.
- Together, 2 bedrooms and 5+ bedrooms properties represent 55.6% of the active Airbnb listings in Biron, indicating a high concentration in these sizes.
- A significant 38.9% of listings offer 3+ bedrooms, catering to larger groups and families seeking more space in Biron.
Biron Vacation Rental Guest Capacity Trends (2025)
Distribution of Listings by Guest Capacity
Guest Capacity Insights for Biron
- The most common guest capacity trend in Biron vacation rentals is listings accommodating 4 guests (38.9%). This suggests the primary traveler segment is likely small families or groups.
- Properties designed for 4 guests and 8+ guests dominate the Biron STR market, accounting for 61.1% of listings.
- 38.9% of properties accommodate 6+ guests, serving the market segment for larger families or group travel in Biron.
- On average, properties in Biron are equipped to host 4.8 guests.
Biron Airbnb Booking Patterns (2025): Available vs. Booked Days
Available Days Distribution
Booked Days Distribution
Booking Pattern Insights for Biron
- The most common availability pattern in Biron falls within the 271-366 days range, representing 66.7% of listings. This suggests many properties have significant open periods on their calendars.
- Approximately 100.0% of listings show high availability (181+ days open annually), indicating potential for increased bookings or specific owner usage patterns.
- For booked days, the 31-90 days range is most frequent in Biron (50%), reflecting common guest stay durations or potential owner blocking patterns.
Biron Airbnb Minimum Stay Requirements Analysis
Distribution of Listings by Minimum Night Requirement
1 Night
1 listings
5.6% of total
2 Nights
7 listings
38.9% of total
3 Nights
4 listings
22.2% of total
4-6 Nights
5 listings
27.8% of total
7-29 Nights
1 listings
5.6% of total
Key Insights
- The most prevalent minimum stay requirement in Biron is 2 Nights, adopted by 38.9% of listings. This highlights the market's preference for shorter, flexible bookings.
Recommendations
- Align with the market by considering a 2 Nights minimum stay, as 38.9% of Biron hosts use this setting.
- If feasible, allowing 1-night stays, especially midweek or during low season, could capture last-minute bookings, as only 5.6% currently do.
- A 2-night minimum appears standard (38.9%). Consider this for weekends or peak periods.
- Adjust minimum nights based on seasonality – potentially shorter during low season and longer during peak demand periods in Biron.
Biron Airbnb Cancellation Policy Trends Analysis (2025)
Flexible
3 listings
25% of total
Moderate
2 listings
16.7% of total
Firm
6 listings
50% of total
Strict
1 listings
8.3% of total
Cancellation Policy Insights for Biron
- The prevailing Airbnb cancellation policy trend in Biron is Firm, used by 50% of listings.
- A majority (58.3%) of hosts in Biron utilize Firm or Strict policies, indicating a market where hosts prioritize booking security.
- Strict cancellation policies are quite rare (8.3%), potentially making listings with this policy less competitive unless justified by high demand or property type.
Recommendations for Hosts
- Consider adopting a Firm policy to align with the 50% market standard in Biron.
- Using a Strict policy might deter some guests, as only 8.3% of listings use it. Evaluate if potential revenue protection outweighs possible lower booking rates.
- Regularly review your cancellation policy against competitors and market demand shifts in Biron.
Biron STR Booking Lead Time Analysis (2025)
Average Booking Lead Time by Month
Booking Lead Time Insights for Biron
- The overall average booking lead time for vacation rentals in Biron is 62 days.
- Guests book furthest in advance for stays during July (average 116 days), likely coinciding with peak travel demand or local events.
- The shortest booking windows occur for stays in March (average 7 days), indicating more last-minute travel plans during this time.
- Seasonally, Summer (102 days avg.) sees the longest lead times, while Spring (38 days avg.) has the shortest, reflecting typical travel planning cycles.
Recommendations for Hosts
- Use the overall average lead time (62 days) as a baseline for your pricing and availability strategy in Biron.
- For July stays, consider implementing length-of-stay discounts or slightly higher rates for bookings made less than 116 days out to capitalize on advance planning.
- During March, focus on last-minute booking availability and promotions, as guests book with very short notice (7 days avg.).
- Target marketing efforts for the Summer season well in advance (at least 102 days) to capture early planners.
- Monitor your own booking lead times against these Biron averages to identify opportunities for dynamic pricing adjustments.
Popular & Essential Airbnb Amenities in Biron (2025)
Amenity Prevalence
Amenity Insights for Biron
- Essential amenities in Biron that guests expect include: Kitchen, Free parking on premises. Lacking these (any) could significantly impact bookings.
- Popular amenities like Smoke alarm, BBQ grill, Hot water are common but not universal. Offering these can provide a competitive edge.
- Warning: Wifi is not universally provided but is considered essential globally. Ensure reliable Wifi is offered.
Recommendations for Hosts
- Ensure your listing includes all essential amenities for Biron: Kitchen, Free parking on premises.
- Consider adding popular differentiators like Smoke alarm or BBQ grill to increase appeal.
- Highlight unique or less common amenities you offer (e.g., hot tub, dedicated workspace, EV charger) in your listing description and photos.
- Regularly check competitor amenities in Biron to stay competitive.
Biron Airbnb Guest Demographics & Profile Analysis (2025)
Guest Profile Summary for Biron
- The typical guest profile for Airbnb in Biron consists of primarily domestic travelers (70%), often arriving from nearby Bordeaux, typically belonging to the Post-2000s (Gen Z/Alpha) group (50%), primarily speaking English or French.
- Domestic travelers account for 69.8% of guests.
- Key international markets include France (69.8%) and United Kingdom (13.2%).
- Top languages spoken are English (31.8%) followed by French (25%).
- A significant demographic segment is the Post-2000s (Gen Z/Alpha) group, representing 50% of guests.
Recommendations for Hosts
- Target domestic marketing efforts towards travelers from Bordeaux and London.
- Tailor amenities and listing descriptions to appeal to the dominant Post-2000s (Gen Z/Alpha) demographic (e.g., highlight fast WiFi, smart home features, local guides).
- Highlight unique local experiences or amenities relevant to the primary guest profile.
- Consider seasonal promotions aligned with peak travel times for key origin markets.
Nearby Short-Term Rental Market Comparison
How does the Biron Airbnb market stack up against its neighbors? Compare key performance metrics like average monthly revenue, ADR, and occupancy rates in surrounding areas to understand the broader regional STR landscape.
| Market | Active Properties | Monthly Revenue | Daily Rate | Avg. Occupancy |
|---|---|---|---|---|
| Saint-Laurent-des-Combes | 11 | $3,526 | $706.18 | 23% |
| Astaffort | 10 | $3,393 | $314.20 | 35% |
| Cénac | 18 | $2,773 | $268.58 | 53% |
| Cérons | 11 | $2,635 | $196.16 | 39% |
| Galgon | 12 | $2,599 | $210.34 | 48% |
| Eynesse | 14 | $2,564 | $282.87 | 36% |
| Bourrou | 10 | $2,475 | $247.57 | 36% |
| Saint-Hippolyte | 10 | $2,443 | $204.98 | 44% |
| Carignan-de-Bordeaux | 30 | $2,418 | $236.77 | 48% |
| Abzac | 12 | $2,415 | $349.03 | 36% |